1. Surface-Based Observations
In November of 2010, stemming from an undergraduate atmospheric measurement and observation course, a team from Purdue University distributed weather stations and evaporation containers across an Indiana wind turbine array and analyzed data over a 13-day period
[1]. The cluster pattern wind turbine array was composed of 121 Vestas V82 1.65 MW wind turbines, 66 Acciona AWs 1.5 MW turbines, 69 model sle GE 1.5 MW turbines, and 47 Suzlon S88 2.1 MW turbines. These turbines ranged from 135 to 380 feet in height. Four weather stations were placed to create a square across a subcluster of the array, while a lone station was placed at the center of this square. Each station collected data at a two-minute frequency. In addition to the weather stations, evaporation containers were placed at the northwest and northeast corners of the square.
The group hypothesized that eddies leeward of the turbines would lead to mixing that would bring about warmer nighttime conditions and dryer areas downstream. When the wind direction placed weather stations directly upwind and downwind of the wind turbine array, a significant change in RH was realized. Under the most ideal conditions, where the wind direction made the upwind and downwind weather stations and wind turbine collinear along a leg of the square (spreading each of the aforementioned items across the shortest span), observed RH decreased by 11 percent. This observed wind-turbine-array-induced reduction in RH was also supported by higher evaporation rates from containers located downwind in the array, thus reinforcing that the air dried out as it progressed through the farm. In scenarios where the wind direction resulted in weather stations receiving a given wind concurrently, thus not passing through a turbine upstream, RH was observed to be nearly the same.
Tower measurements have been used to extend surface observations of humidity upward in another Midwest investigation at the Iowa Atmospheric Observatory (IAO)
[2][3]. The IAO consists of two 120 m meteorologically instrumented observation towers. One of the towers is located within a 200-turbine array; the second tower is located 22 km away, and outside of the wind farm. Each tower is identically instrumented at 5, 10, 20, 40, 80, and 120 m, with a redundant temperature-humidity probe present at the 120 m level. Observations from the towers were reported at 1 Hz. With an entire suite of instruments at each discrete level, moisture changes were investigated comparing vertical profiles of a mixing ratio and a ratio of the mass of water vapor to the mass of dry air
[3]. Comparisons were made under various stability scenarios, as characterized by the Richardson number (Ri), when a tower was both influenced (i.e., waked flow) and uninfluenced (i.e., no wake) by the prevailing wind.
For neutral (well-mixed) conditions, no appreciable difference in upstream and downstream vertical profiles of mixing ratios were apparent. Under the condition of weak stable stratification, a downstream profile of increasing moisture with height emerged. However, increasingly strong stability (warm air above cold air) and combined wakes exacerbated this moisture profile to one that was characterized by a strong moisture deficit below the rotor swept area and an analogous moisture increase at the uppermost observation levels. These perturbations to the moisture profile were most stark in the absence of other mesoscale influences (e.g., nocturnal low-level jets)
[4].
Armstrong et al. extended the analysis of wind turbine-induced changes to surface-level humidity in the downstream direction
[5]. The analysis took place in an array of 54 turbines with a hub height of approximately 70 m and rotor diameters of 82 m. In contrast to the previously discussed Midwest investigations, which took place within relatively open and homogenous land, this wind farm contained coniferous trees, up to 20 m in height, spread across a bog, and an improved grassland area. RH was measured at 1 Hz and made into five-minute data records. In the manner described previously, all RH observations were converted to AH values for analysis. Observations were made with a grid of 101 sensors across a 2.6 × 1.4 km area at a height of 2 m. In conjunction with measurements of RH, soil moisture was measured (−10 cm) coincident with the placement of the RH sensors. One-minute observations were averaged into 30 min data records. Using historical data from the nearest Met Office, the observational period was confirmed to be climatologically ‘normal’ (lay within ±1 standard deviation) with respect to wind speed and stability.
Extended observational periods were available for analysis when the turbines were both on and off. This enabled the integrated effect of the wind farm on changes to AH to be considered between these two operational states. Thus, wind speed and direction were not considered in the analysis. Appreciable changes in AH were not observed during daytime observations, presumably due to a well-mixed boundary layer. However, at night, differences between the on and off states were significant. During the night, air located within close proximity downwind of a turbine was found to be moister. Within 200 m downstream of the turbines, AH values were higher than when the wind turbines were not operational. This difference in moisture decreased logarithmically with downstream distance, becoming drier beyond 200 m. While a moistening of surface air in the near wake of a turbine may appear to contradict other studies, consideration of midnight soundings from the two nearest upper-air stations shows consistency in the downward mixing of air in stable conditions as these soundings revealed an increased moistening of ambient air with height. No spatial variation in AH could be detected across the wind farm during the time period when the farm was not operational.
To further extend the study’s aggregate nighttime study, a complementary analysis of wind turbine effects on AH was undertaken that allowed comparison of AH upwind and downwind of turbines. The AH of air downwind of turbines was, on average, 0.03 gm−3 greater than air upwind. Again, when the farms were not operational, AH departures were variable, with no statistically significant difference between downwind and upwind locations.
Armstrong et al.’s observations of RH and other associated meteorological parameters enabled the conversion of RH observations to AH values and also facilitated a more detailed analysis of the combined effects of humidity and temperature. This analysis revealed that the increase in saturated water vapor pressure had more of an effect on AH than the combined effects of an increase in temperature and reduction in RH. This, again, supports the idea of turbine-induced downward mixing of air, which, in this circumstance, was found to be moister.
Since the occurrence of dew is contingent on near-surface moisture and atmospheric stability, the presence and duration of dew within wind farms, particularly downwind of turbines, is likely impacted by any changes to humidity that turbine-induced mixing may bring about. Thus, a dew duration study may also offer insight into humidity changes brought about by wind turbines. Such a study was accomplished within a 200 1.5 MW, 80 m hub height, and GE wind turbine array
[6]. Embedded within the southwestern corner of this farm were flux stations positioned 260 m north and 160 m south of a single line of turbines. Leaf wetness sensors were deployed for one month adjacent to these flux stations at 2 m. The study noted, however, that faulty sensors, precipitation, and corn transpiration reduced the number of good observations to only 12 nights. Consequently, the study’s results were put forth as conditional. Nonetheless, when neither of the stations laid in the wake of a turbine, dew duration was observed to remain consistent between the two stations. However, when the wind direction placed one station upwind and the other station downwind of the turbine, dew duration was shortened for the group of leeward sensors. Further, the magnitude of this reduction correlated to the length of time that the leaf wetness sensors spent in the wake of the turbine. Overall, an average decrease in dew duration of 120 min was observed when the stations provided upwind and downwind observations.
2. Aircraft Observations
2.1. Crewed Aircraft Observations
Manned aircraft have been used to cover the vast distances over wind turbine array marine boundary layers (WTAMBL) and observe changes to the near-surface environment. Changes to humidity within the marine boundary layer can impact cloud and fog formation and dispersion
[7]. The Wind Park Far Field (WIPAFF) project flew 41 observation flights across different seasons and stability conditions to observe humidity, among other parameters, within a WTAMBL
[8][9][10][11]. Of the 41 flights, 26 were conducted in the far field wake. Eight of these 26 flights resulted in an observed change to near-surface humidity.
The overall humidity profile was found to vary strongly depending on the stability condition, and the wind farm was seen to bring about changes to humidity only under strongly stable conditions. Near-surface humidity values were observed to increase or decrease depending on the height of the temperature inversion and how it compared to the rotor tip height. All but one flight observed wake drying. Since an inversion serves as a lid for water vapor that has evaporated from the ocean’s surface, water vapor concentration is highest directly underneath an inversion. Consequently, if an inversion is broken apart by turbines, it results in drier air being mixed downward and, consequently, a drier wake. Decreases of up to 0.5 gkg−1 were observed for up to 60 km downstream when this dynamic occurred. When an inversion did not exist, or was located well above the turbine, this drying was not observed. Further, no coupling between warming or cooling and the drying of the wake was demonstrated. This implies that the moisture flux was decoupled from the heat flux.
2.2. Uncrewed Aircraft Observations
Uncrewed aircraft systems (UAS), colloquially referred to as drones, have also been utilized to increase the spatial resolution of humidity observations above the surface in a wind turbine array boundary layer (WTABL). An instrumented multirotor was flown for this purpose on prescribed paths both upstream and downstream of a GE 1.7 MW wind turbine with an 80 m hub height and 100 m rotor diameter, sited on the upstream side of a WTABL
[12][13]. Within the same Midwest field campaign, a similar flight profile was flown around a Gamesa G114 2.0 MW turbine with a 93 m hub height and 114 m diameter rotor similarly sited. Upstream of the turbine, a vertical profile was flown with measurements made from 2 to 120 m in height. Below the hub height, measurements were undertaken in a hover at 5 m increments; above the hub height, measurements were undertaken at 10 m intervals. For comparison, similar vertical profiles were completed downstream at 1 and 2 rotor diameters. In addition to the downstream vertical profiles, downstream observations were made every 25 m extending from 50 to 300 m downstream at the bottom turbine tip height. Beyond 300 m downstream, observations were made in a hover at 50 m increments to 500 m. Vertical and downstream observations were complemented by a spanwise transect that extended 90 m out to either side of the centerline. This brought spanwise measurements out 40 m beyond the lateral extent of the rotor. Observations were made at 10 m increments along the spanwise transect, which was flown at the bottom turbine tip height and at a downstream distance of two rotor diameters.
Observations were captured just after morning civil twilight, before the nocturnal inversion was broken. Upstream observed inversions within the first 100 m ranged from 0.5 °C to 4 °C. A positive humidity lapse rate (decreasing humidity with height) persisted for each of the flights across the observational days. Hub height wind speeds were observed to be 4–7 m/s.
Relative to the upstream profile, each of the downstream vertical profiles recorded a decrease in RH near the surface and an increase in RH aloft, with an inflection point at or just below the turbine hub height. The greatest decrease in RH was consistently observed just below the lower turbine tip height and was in the order of 3%. The magnitude of the RH decrease in this area was often on par with the increased observed above the hub height.
Spanwise observations made at the lower turbine tip height pointed toward a laterally asymmetric reduction in RH. The sharpest reduction in RH was found just to the right of the centerline, while, in general, relatively lower RH values populated the entirety of the right-hand side of the transect. Centerline spanwise observations were on par with the reduction in RH observed in the corresponding vertical profiles.
Downstream measurements made along the wake’s centerline at the same lower turbine tip height portrayed a steep reduction in RH until the point of greatest reduction was realized at approximately 1.25 rotor diameters. Following this point, the wake exhibited a gradual recovery. Observations made at the greatest downstream distance of 500 m showed that 60–80% of the RH deficit had been recovered by this point.
During a subsequent return to the aforementioned WTABL, upstream and downstream observations were made at 3 m above the crop canopy (wheat)
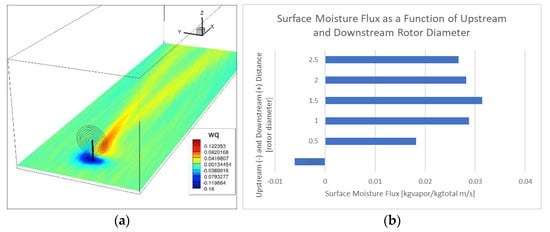
[14]. During this investigation, a larger but similarly meteorologically instrumented UAS was flown. However, the platform now possessed the ability to observe the mean and fluctuating vertical component of velocity (w). This afforded the opportunity to make kinematic moisture flux calculations in the presence of a 0.5 K per 100 m inversion and a hub height wind speed that averaged 6.7 m/s. As shown in
Figure 1, both observations and numerical simulations compare well and exhibit a negative moisture flux within the immediate vicinity under the turbine. However, a region of positive moisture flux stretched from a downstream distance of approximately one-half the rotor diameter to just beyond two rotor diameters along the centerline of the wake. A smaller positive moisture flux then extended along the lateral extents of the expanding turbine wake throughout the remainder of the near-wake region.
Figure 1. (a) Contour plots of LES averaged surface moisture flux in a horizontal plane section (the legend shows surface moisture flux in units of kgwater vapor/kgtotal air m/s; (b) observed values of surface moisture flux, as a function of upstream and downstream rotor diameter, obtained by a meteorologically-instrumented uncrewed aircraft in a horizontal plane 3 m above the crop canopy.
3. Wind Tunnel Observations
By their very nature, field observations present challenges associated with isolating the role of any given factor to changes in downstream conditions. The controlled environment of a wind tunnel provides a unique opportunity for a more controlled experiment where only one variable is changed at a time. Capitalizing on this, an investigation was undertaken to explore the viability of studying the mixing of stratified scalars by a turbine in a wind tunnel environment
[15]. Toward this purpose, humidifiers were placed on the floor of the tunnel, upstream of the convergence and test sections. This enabled the development of a stable, stratified, and stationary humidity layer. Humidity and temperature sensors were then placed upstream and downstream of the tunnel’s test section, affording the opportunity to quantify how a three-blade, horizontal axis, scaled wind turbine rotor enhances the mixing of moist air.
Vertical profiles of temperature and moisture were observed at one and ten rotor diameters downstream and compared to inflow conditions. These observations were made at two different incoming flow velocities, hence providing observations at two different Reynolds numbers. Although observational configurations were limited, the moisture stratification was found to be dependent on both the downstream distance and the Reynolds number. For each Reynolds number flow, mixing was significantly enhanced at one rotor diameter downstream but largely recovered by ten rotor dimeters downstream, with any such effect completely disappearing for the highest Reynolds number.
4. Numerical Simulations
In the context of scalar transport and diffusion in the ABL, most numerical simulations have targeted the effect of wind farms on temperature
[16][17][18][19][20][21][22][23]. In these studies, large eddy simulations (LES) of both unstable and stable boundary layers have revealed that there is an increase in temperature near the surface. This can be especially favorable for agriculture during the overnight period when a stable ABL cools the air adjacent to the ground. For an unstable ABL, the same increase in near-surface temperature exacerbates the positive temperature lapse rate.
LES and other numerical studies on the effect of wind turbines or wind farms on humidity are scarcer. Numerical simulations using the Weather Research and Forecasting (WRF) model
[24][25][26] found that seasonally averaging near-surface humidity over large areas in Iowa increased the RH to some extent. For the Iowa wind farms considered, the impact on humidity was more significant during the summer months, with the relative increase in near-surface specific humidity amounting to less than 5%. This change was mostly confined to the wind-farm region. For example, during the summer months, the wind farm simulation showed that the mean near-surface air temperature can be as great as 0.5 K higher and specific humidity can increase to up to 0.4 g/kg
[24][25].
Other WRF numerical simulations of the Crop Wind Experiment (CWEX-13) also considered a physical Iowa wind farm of 200 turbines
[27]. Among other variables, this study targeted the near-surface moisture content. Here, it was shown that turbine-generated wakes brought relatively drier air closer to the ground while simultaneously lifting moister surface air to the upper layers of the ABL. The investigators’ analysis of grid spacing resolution determined that vertical resolution has a substantial impact on the moisture budget.
In a series of LES studies
[28][29][30][31], an investigation of both individual wind turbines and the interactions between arrays of turbines was conducted, taking into account different levels of RH. Numerical simulations for a single wind turbine interacting with a humid ABL were conducted in a domain with downstream, lateral, and vertical dimensions of 1500 m × 400 m × 400 m, respectively (more details about the flow conditions, flow domain, and the mesh can be found in [
36,
51]). In
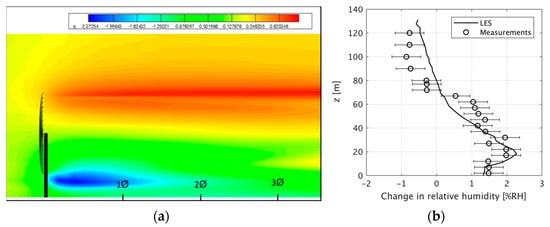
Figure 2a, contours of the averaged RH change taken in a vertical plane passing through the turbine’s axis are shown. Numerical simulation results are consistent with the aforementioned observations, along with other numerical simulations, and show that there is an increase in the RH above the turbine hub, roughly at the upper rotor tip height, and that this increase continues downstream at the same level. The maximum decrease in the RH occurs just below the lower rotor tip height. A vertical profile of the averaged RH difference, taken at 100 m downstream of the wind turbine, was compared to measurements in
Figure 2b [
36]. In Equation (10), qup(y,z,t) is the humidity upstream of the wind turbines, T is a time window for averaging, and y1 and y2 are the coordinates of the lateral boundaries. Fairly good qualitative agreement is observed in this figure, although some small differences above the hub height are apparent. While these results were obtained for a stable ABL, the same trend was observed in numerical simulations for the neutral and unstable ABL, although in these conditions the delineation between the two regions of increase and decrease are not as obvious as in the stable condition. It was also found that the distribution of the RH change is dependent on the thermal stratification and on the humidity flux from the ground (increasing thermal stratification, for example, triggered an intensification of the RH change both at the ground and above the hub height).
Figure 2. (
a) Contour plots of time-averaged RH change in a vertical plane section passing through the hub and parallel to the streamwise direction; (
b) LES time-averaged output and observed changes in RH, as a function of height (reprinted with permission from
[29].
RH variation inside an infinitely wide wind farm (i.e., periodic boundary condition in the lateral direction) with seven rows of turbines in the streamwise direction was studied using LES in all three thermal stratification conditions: stable, neutral, and unstable (more details about the flow conditions, flow domain, and the mesh can be found in
[29][30]). Two wind farm layout configurations, corresponding to aligned and staggered rotors, and two thermal stratifications were considered in the analysis (wind turbine spacing and wind farm layouts have been recently discussed in recent studies by Sun et al.
[32] and Win Naung et al.
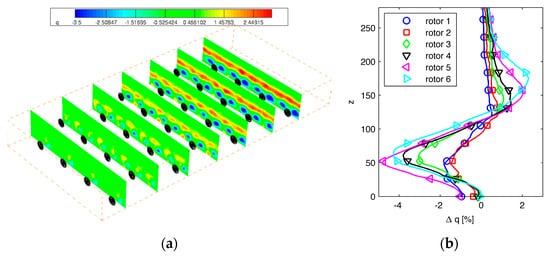
[33]). Similar to the numerical results obtained for a single wind turbine, there is an up-lift of moisture from the ground accompanied by a downward transport of dry air toward the ground, due to enhanced vertical mixing, in the presence of a positive humidity lapse rate. In
Figure 3a, for example, contours of averaged RH change taken at vertical cross sections in the domain show drier air under the turbine hubs and more humid air in the upper layers. These contours, taken in multiple streamwise sections, indicate how these regions of RH difference increase in magnitude. While these contours represent the staggered layout, similar results were observed from the simulations of a wind farm with aligned turbines. A quantitative representation of this build-up process is illustrated in
Figure 3b via vertical profiles of averaged RH change taken at 1 rotor diameter downstream of turbines from a single column (the profiles are taken from the right side of the rotor wake).
Figure 3. (
a) Contour plots of time-averaged RH difference in vertical plane slices at fixed downstream distances within a staggered array; (
b) Variation of the RH with vertical direction (reprinted with permission from
[29]).
A suite of LES was performed to investigate the impact of a large wind farm on the RH variation in the downstream (more details about the flow conditions, flow domain, and the mesh can be found in
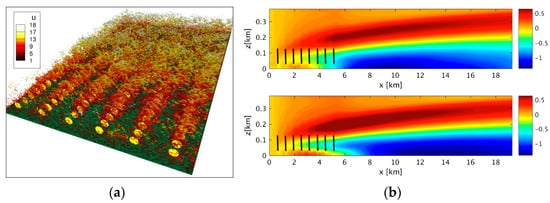
[34]). The flow domain had downstream, lateral, and vertical dimensions of 20 km × 2.5 km × 0.5 km, respectively, on a grid consisting of 512 × 128 × 96 points. For the specific humidity, a positive lapse rate of 0.5 g/kg was imposed, while at the ground level a constant potential temperature of 300 K and a constant specific humidity flux of 0.01 g/kg m/s were considered. For illustrative purposes, a qualitative representation of the flow structures that develop in the rotor wakes and in the shadow of the wind farm are revealed is
Figure 4a by iso-surfaces of Q criterion colored by the streamwise velocity component. It was observed that for the aligned wind farm layout that the effect of the compounding wakes (the buildup of the flow structures along a column of wind turbines) is more pronounced than for the corresponding staggered layout (not shown here). In the shadow region, however, these wakes are blended together to form a homogeneous turbulence field that is much more intense than the upstream flow field. An interesting follow-up investigation would be to extend the flow domain further in the downstream and monitor the distance over which turbulent kinetic energy (TKE) and the RH variation decay and reach the level of the upstream region. Such a numerical investigation will warrant an increased computational effort. In fact, line plots of spanwise-averaged TKE and mean RH variations
[31] suggested that this downstream decay happens, but the domain was not sufficiently long enough to justify an extrapolation.
Figure 4. (
a) Iso-surfaces of Q criterion colored by the streamwise velocity component for a 6 × 7 wind farm; (
b) contours of mean RH variation in the shadow region (reprinted with permission from
[31]).
Contours of the time-averaged and spanwise-averaged RH variation inside the wind farm and in the shadow, shown in
Figure 4b
[31], provide a clearer picture of how layers of low and high RH levels are distributed in the shadow of the wind farm. Among other traits, it was observed that the decrease in RH in proximity to the ground is further enhanced in the shadow of the wind farm for a relatively long distance, and that the decay of the RH decrease (blue regions in
Figure 4b) appears to happen at a higher rate for the aligned layout. Other important results in
[31] consist of vertical and spanwise profiles of mean RH, along with contours of humidity flux distribution in cross-flow planes at different streamwise locations. The spanwise profiles of RH were fuller in the case of a staggered wind farm layout, as a consequence of an enhanced mixing of the wakes.
5. Discussion and Conclusions
Across the range of empirical investigations, changes to humidity brought about by wind turbine enhanced vertical mixing have not been observed in neutral or unstable conditions. Conversely, when the ABL is stably stratified, and consequently less well mixed, the presence of a utility-scale wind turbine has shown to change the downstream moisture profile. These changes are exacerbated by the combined wakes of multiple turbines and greatest in the absence of mesoscale influences. While many of the investigations have observed and demonstrated changes to RH, along with changes to downstream temperature profiles, it has been shown that changes to downstream RH are produced by not only changes to temperature but by changes to moisture content. Hence, observed changes to RH, the mixing ratio, virtual temperature, and AH portray a similar dynamic, along with measurements of dew duration.
The following are the main findings from our observations:
-
Surface and profile measurements have shown that the character of the humidity change is dependent on the upstream profile of moisture because near-surface air and air aloft are exchanged with the other. Consequently, a positive upstream humidity profile (decreasing humidity with height) tends to result in increased downstream drying at the surface and moistening aloft.
-
Alternatively, negative upstream humidity profiles have proven to result in an increase in downstream near-surface moistening and drying aloft. Each of these scenarios has been observed. Consequently, the height of the associated inversion may dictate the moisture characteristics of the air being mixed down.
-
The inflection point for these increases and decreases in humidity occurs at or just below the hub height of the turbine, with the magnitude of the increase and decrease nearly the same. The change to the near-surface environment tends to be most pronounced just below the lower turbine tip height as a result of the aforementioned mixing and a sinking wake.
-
The departure from upstream humidity profiles has been shown to be strongly dependent on the downstream distance from the turbine, with a suggestion of a possible logarithmic dependency on distance from the nearest wind turbine and the Reynolds number. The influence of the wind turbine on changes to downstream humidity, including support for the exchange of near-surface air with air aloft, is also present in the spanwise asymmetry observed in the near wake of the turbine. Here, air found on the descending blade side of the turbine is found to be drier.
From the few numerical investigations of the effect of individual wind turbines or large wind farms on atmospheric humidity that we were identified in the open literature, several conclusions can be outlined:
-
WRF simulations found that there is an increase in the averaged near-surface humidity over multiple seasons and over large areas, as a result of the wakes generated by large wind farms. This impact on humidity was considerably more significant during summer months, with the near-surface-specific humidity not exceeding 5%, mostly in the wind-farm enclosures.
-
Other investigations found that the swirl associated with the wakes of wind turbines brings relatively drier air from the upper layers closer to the ground while driving the moister surface air upward.
-
The level of the RH change within the wind farm, along within the shadow, was found to be dependent on the vertical temperature difference, the type of thermal stratification, and the surface humidity flux. An increase in the vertical temperature difference is accompanied by an increase in the RH change both below and above the turbine hub height.
-
A study targeting the effect of large wind farms (with both aligned and staggered layouts) on RH several miles downstream of the array, known as a wind farm shadow, found that the decrease in near-surface RH extended in the shadow of the wind farm for a relatively long distance. Further, the decay of the RH decrease (blue regions in Figure 5b) appears to happen at a higher rate for the aligned layout.
This entry is adapted from the peer-reviewed paper 10.3390/en15072603