Your browser does not fully support modern features. Please upgrade for a smoother experience.
Please note this is an old version of this entry, which may differ significantly from the current revision.
Subjects:
Economics
By exploring the effect of disruption on transaction network structure between Indonesian banks during the 2008 financial crisis, we have the research objective to propose a financial shock detection from a macro and micro-network transaction pattern. We investigate the most changing triadic motifs as a crisis predictor from the micro perspective. From a macro perspective, we measure global networks as dynamics metrics over the crises duration.
- transaction network
- network structure
- network topology
- network motifs
- financial crisis
1. Introduction
An extreme stress period on global financial markets started in mid-2007, peaking in 2008, and ending in early 2009, negatively impacted worldwide banking (Bosworth and Flaeen 2009). This phenomenon is known as the Global Financial Crisis (GFC). The shock began when the investment bank Lehman Brothers suffered drastic losses in its stock. Investors were pulling their investments out of banks due to uncertain conditions. The global financial market was stressed as worldwide investors tried to sell simultaneously, while banks were having trouble finding other financing sources. Banks’ liquidity problems, spread over the whole system, triggered the world financial market panic. The continuous failures spread in a short time, proving that the entities incorporated in the financial system are highly interdependent to each other (Roszkowska and Prorokowski 2013). Therefore, financial stability evaluation through a system-wide network becomes a more advisable approach than a bank as an individual. In the system-wide network approach, individual banks and their transaction activities are modeled into a transaction network.
Network science has been popularly used to explain the relationship between entities in a complex system (Dehmer and Basak 2012). The network approach is suitable to represent complex interactions to gain knowledge in various real-world domains. A network is built on a set of nodes connected by edges. The network is built upon individual banks as nodes and the inter-bank transaction activities as edges in a transaction network. The continuous transaction between banks forms a highly interdependent network. An economist could analyze transaction patterns in macro and micro views by modeling the network. The macro view observes the transaction behavior by measuring the dynamics of network properties during the observable time, while the micro view sees the change on the network microscopic structure named motif. Network motifs are discovered by breaking down the whole complex network into specific small-connected nodes patterns. Each motif reveals unique characteristics. The fluctuation of these motifs’ occurrence in a particular time range emphasizes a better understanding of the underlying transaction pattern change due to a financial symptom.
Economic crises happen when the whole ecosystem state experiences a sudden downturn and the stakeholder accumulated action in the financial network perform less than expected. A deterioration in an economic condition is marked by the following phenomena: significant production decline, enterprise bankruptcy, an explosion of unemployment, and a decrease in gross national product. The nature of economic crises is far from an isolated event. There is a buildup precursor to the main event; thus, eventually, we would have the opportunity to measure the characteristics of a pre-economic crises event. One attribute is financial instability which significantly reduces commodity trading volume, e.g., profit, personal income, and income tax. It is consequently interrupting the welfare of human life in almost every sector (Haldane and May 2011). From the view of an inter-bank transaction network, a failure in a critical node could potentially trigger the entire network to face constant collapse risk. The rapid shock, spread within the highly interconnected financial system, significantly impacted human wellbeing, and has attracted many researchers to contribute through a network approach (Longstaff 2010).
Financial crises prediction might strengthen the opportunities to minimize financial turmoil risks and prevent the economic system collapse. Then, the question is how to determine the crisis predictor? This study looks for the most correlating motif pattern as an early predictor of Indonesia’s financial crisis. A network motifs exploration study for early warning of financial crisis was conducted by Squartini (Squartini et al. 2013); however, this study focuses on the financial crisis in Indonesia. In its role as the Central Bank, Bank Indonesia regulates and maintains the stability of the national payment systems in Indonesia. One of Indonesia’s most critical financial systems is the Bank Indonesia Real Time Gross Settlement (BI-RTGS) system. The BI-RTGS is an infrastructure used for electronic fund transfer where the settlement is instantaneous per individual transaction. Since being operated on 17 November 2000, the BI-RTGS System has played an essential role in processing enormous value urgent transactions above 7000 USD or High-Value Payment System (HVPS) transactions (Bank Indonesia 2017). The HVPS transactions currently account for 90% of all payment transactions in Indonesia. Undoubtedly, the BI-RTGS system is categorized as a systemically important payment system. The construction of a transaction network on the BI-RTGS system provides an opportunity to study the structure and dynamics of most Indonesia-wide payment transactions.
In general, financial crises are marked by an asset price and credit boom, and then a sudden bust. They appear in different forms and magnitude, evolve over time into different shapes, and rapidly spread across borders. They require immediate and comprehensive policy responses. Crises at a certain level manifest the interactions between the financial sector and the real economy; they need an understanding of macroeconomic linkages, which is a complex challenge in itself (Reinhart and Rogoff 2009). In short, there are several indications, including an institutional weakness; for example, regulation, supervision, and market discipline are slow to catch up with tight competition and innovation (Dell’Ariccia et al. 2012). Depending on the theory used, mechanism, and root cause analysis, the survey study shows crises could be classified into four groups: currency, sudden stops, foreign and domestic debts, and banking crises (Claessens and Kose 2013). Most financial crises left fingerprints or symptoms such as a structural change in the financial network that could be used as a crisis predictor (Marsili et al. 2011; Upper 2011).
2. Predicting Economic Crises
Modern society’s “connectedness” has many incarnations, such as social interactions, large-scale conversations, and trade between entities, constituting economic activity. Society’s complex relationship between its entities is easily modeled in a network (Easley and Kleinberg 2010). News and information propagate at lighting speed as the mass communications network delivers real-time feed to society. The phenomenon impacts the decision-making process and overall human social behavior (Jackson 2008). The speed at which activities can switch money in and out of currencies and countries has grown exponentially recently because of the efficiency of modern communications, which in the end, shortens the time for the policymaker to respond to emerging crises. In macroeconomics, we usually view an entity’s economic performance, such as a country, intending to predict the entity’s future performance. Its focus is on aggregating economic indicators, for example, purchase managers index, consumer price index, unemployment rate, gross domestic product, money supply, and interest rate.
In terms of predicting economic crises, financial markets perform poorly at spotting crisis coming; it is evident in the case of Mexico in 1994 and Thailand in 1997 (Berg and Pattillo 2000) and also the global crisis in 2008 (Spange 2010). The 2008 crisis suggests the significant role of banks and financial institutions in creating risky products, encouraging massive borrowing, and engaging in high-risk behavior (Greenwood et al. 2021). Payment data pattern could be used as indicator to nowcast and forecast economic activity (Aprigliano et al. 2019), so it is good idea to look at the direction of exploring transaction data as well. Looking at how hard it is to predict the economic crises since numerous reasons could possibly cause them, we look at fundamental changes in the shift of the transaction network. This research proposes to look to alternative measurements of the pattern of banking transactions, where we hope to find micro-network motifs that distinguish them as a predictor leading to financial crises.
3. Network Model
A network is defined as a set of interconnected points connected by lines. In scientific language, points are referred to as nodes, while lines are referred to as edges. The network edge might serve many of real-world interactions, such as directed or undirected and weighted or unweighted. Edge direction represents the connection flow from the source node to the target node, while edge weight represents the interaction importance level. The network model is robust in representing the entities’ interconnections and the structural feature of a complex system (Barabasi 2016). The network perspectives or topological features have been widely adopted in many fields such as biology, computer science, sociology, chemistry, and economics. This approach is employed to represent the complexity and to resolve the combinatorial problem. When we face the network model, there are several questions to answer: who the most influential node is, how dense the network is, how big the diameter is, and how many groups are in the network. Network models provide metrics to answer these measurements (Alamsyah et al. 2013).
It is possible to enhance the network model to accommodate the time-based dynamic exploration; this method is known as Dynamic Network Analysis (DNA) (Alamsyah et al. 2018). The DNA captures time-dependent network properties; thus, we could observe the changeover of network metrics during the observation time. This approach provides richer information compared to the single network view at any given time. The granularity information from each measured time could be used as a trend analysis of macro and micro structural changes.
4. Network Topological Properties
The goal of studying networks is to understand better system behavior through their topological configuration. The topological network properties measure the node relations within a network to reveal the network structure. Some of the network topologies used in this paper are explained in Table 1 (Barabasi 2016).
Table 1. Network topological properties measurement.
| Network Topology | Explanation |
|---|---|
| Number of Nodes | Measure the number of entities or actors within the network. |
| Number of Edges | Measure the number of connections among nodes within the network. This measurement distinguishes network topology since a network with the same number of nodes does not necessarily have the same characteristics. |
| Average Distance | The average of the shortest path length between any nodes in the network. Another similar measurement is the Network Diameter, which measures the longest of the shortest distances between any nodes. |
| Density | The ratio between the existing connections (edges) compared to the total potential relation among nodes within the network |
5. Network Motifs
The nodes within a complex network are interconnected in various patterns. Network motifs are one of the most potent ways to explore microscopic structures in a complex network. Motifs are defined as small-connected sub-graph within a directed network (Milo et al. 2002). There are several motifs’ categories based on the number of nodes involved. The two-nodes sub-graph is named dyadic motif, while the three-nodes sub-graph is named triadic motif. The triadic motif contains richer microscopic structure types than the dyadic one (Vladimir and Selena 2016). It consists of 13 subgraph motif combinations which are shown in Figure 1.
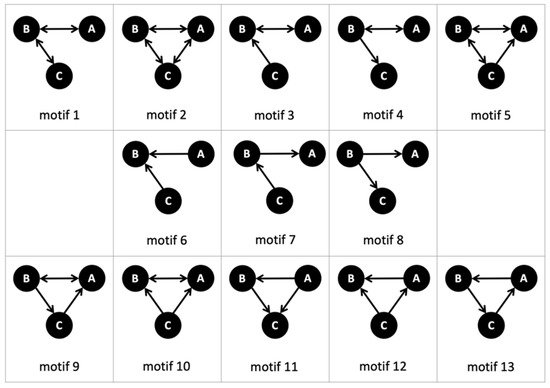
Figure 1. Subgraph triadic motif combinations.
Three round shapes represent three nodes in each of the sub-graph. Two or three arrows connect the three nodes in 13 combinations. Each of the sub-graphs owns different meanings. For example, in motif 2, the connections between nodes are reciprocal, while in motif 13, all connections are not reciprocal; it is cyclic connections. There is no general meaning for these motif patterns, instead defined based on the application domain. We explore the triadic motif 13 sub-graph appearance within the transaction network to discover the financial crisis predictor.
6. Transaction Network
The transaction network is built upon credits and debits transaction activities. A bank’s transaction flow is modeled into a directed and weighted network. We model the edge direction to indicate the transaction flow, while the edge weight indicates the transaction amount (Becher et al. 2008). The real-world networks behavior reveals that most banks have low connectivity and only a few are highly connected to most other banks (Alamsyah et al. 2019). Based on these facts, all banks do not contribute equally to a financial system. Transaction networks are susceptible to both endogenous and exogenous disruptions. Since having high interconnectivity, the entire system faces the collapse risk from a single bank failure through the defaults cascade (Reserver Bank of Australia 2019). Traditionally, apart from using the extensive granularity of network science such as network motifs, the identification of bank importance uses the core–periphery structure to identify the extent of banks (In’t Veld et al. 2020). The core–periphery structure aligns with the common finding in the network science discipline that most natural networks have power-law of node degree distributions (Newman 2011).
This entry is adapted from the peer-reviewed paper 10.3390/economies10030056
This entry is offline, you can click here to edit this entry!