Clinically significant atherosclerosis of the coronary arteries, known as coronary artery disease (CAD), is an endemic condition that is associated with significant morbidity and mortality. The introduction of artificial intelligence (AI) and machine learning over the last two decades has unlocked new dimensions in the field of cardiovascular medicine. From automatic interpretations of heart rhythm disorders via smartwatches, to assisting in complex decision-making, AI has quickly expanded its realms in medicine and has demonstrated itself as a promising tool in helping clinicians guide treatment decisions. Understanding complex genetic interactions and developing clinical risk prediction models, advanced cardiac imaging, and improving mortality outcomes are just a few areas where AI has been applied in the domain of coronary artery disease.
1. Integration of Genetics and AI in Cardiovascular Diseases
Over the last two decades, the emergence of technologies able to measure biological processes at a large scale have resulted in an enormous influx of data. For instance, the completion of the Human Genome Project has paved the way to design single-nucleotide polymorphism (SNP) and mRNA microarrays, which can broadly test for millions of genetic variants in a simple point-of-care test. This has paved the way for the emergence of modern data-driven sciences such as genomics and other “omics” [1]. Genome-wide association studies (GWASs) operate by simultaneous comparison of millions of SNPs between diseased individuals and disease-free controls to detect a statistically significant association between an SNP locus and a particular condition [1]. Machine learning (ML) and particularly deep learning (DL) algorithms are inherently designed to extract patterns and associations from large-scale data, including clinical and genomic data. Given the complexity and multifaceted nature of cardiovascular diseases in general, and CAD in particular, an approach that integrates all these factors into a risk-stratification model would be expected to better predict incident events than existent models [2].
Multiple studies have emphasized the role of ML in identifying genetic variants and expression patterns associated with CAD from mRNA arrays using differential expression analysis and protein–protein interaction networks [3][4]. For example, Zhang et al. used ML to perform differential expression analysis on mRNA profiles from CAD patients and healthy controls to identify a set of differentially expressed genes between the two groups, then built a network representation of functional protein–protein interaction. The top 20 genes in the network were identified using a maximal clique centrality (MCC) algorithm. Finally, to test the performance, a logistic regression model was built using the top five predictor genes to classify individuals into the presence or absence of CAD. The model achieved an AUC of 0.9295 and 0.8674 in the training and internal validation sets respectively [5].
Dogan et al. built an ensemble model of eight random-forest (RF) classifiers to predict the risk of symptomatic CAD using genetic and epigenetic variables along with clinical risk factors. The model was trained on a cohort derived from the Framingham heart study (n = 1545) and utilized variables derived from genome-wide array chips to extract epigenetic (DNA methylation loci) and genetic (SNP) profiles. The initial number of available variables were 876,014 SNP and DNA methylation (CpG) loci, which required multiple reduction steps, ending up with 4 CpG and 2 SNP predictors fed into the model along with age and gender. The model predicted symptomatic CAD with an accuracy, sensitivity, and specificity of 0.78, 0.75, and 0.80, respectively, in the internal validation cohort (n = 142).
Finally, the coronary artery calcium (CAC) score, calculated using the Agatston method on noncontrast ECG-gated cardiac computed tomography, is an established strong predictor of major adverse cardiovascular events in asymptomatic individuals. Genomic studies have previously focused on identifying genetic loci linked to CAC [6][7]. Oguz et al. suggested the use of ML algorithms to predict advanced CAC from SNP arrays and clinical variables. They identified a set of SNPs that ranked the highest in predictive importance and correlated with advanced CAC scores, defined as the 89th–99th percentile CAC scores in the derivation and replication cohorts, and trained different RF models to predict advanced CAC scores using clinical and genetic variables.
2. Risk Prediction Models and Imaging Modalities for Estimating Pretest Probability of CAD
Traditionally, stratifying patients presenting with stable chest pain using pretest probability (PTP) estimates of CAD has been commonly used to help with decision-making regarding downstream testing and the choice of an appropriate diagnostic modality. Historically, the Diamond–Forrester model—developed using age, sex, and chest pain characteristics—was used as a clinician’s risk stratification tool in predicting the PTP of CAD
[8]. However, numerous studies showed its limitation in overestimating PTP by approximately threefold, especially in women
[9]. This led to the development of the updated Diamond–Forrester model (UDF) and the CAD consortium score
[10][11][12]. These scores, incorporating demographic and clinical risk factors, have been proven to be better at predicting the risk of CAD. Therefore, improving the ability to predict CAD using more accurate risk-assessment modeling is imperative, given the potential to reduce downstream testing and associated costs. Using clinical and demographic features, ML models have been employed to estimate the PTP of CAD
[13][14][15]. In a recent multicenter cross-sectional study, a deep neural network algorithm based on the facial profile of individuals was able to achieve a higher performance than traditional risk scores in predicting PTP of CAD (AUC for the ML model 0.730 vs. 0.623 for Diamond –Forrester and 0.652 for the CAD consortium,
p < 0.001)
[16]. Though the study is limited by the lack of external validity and low specificity (54%), such approaches can potentially lead to a paradigm change in CAD management by facilitating earlier detection and initiation of primary prevention using readily available parameters, such as an individual’s facial profile.
When available, a CAC score has been shown to add to the PTP of CAD, with a CAC score of zero identifying low-risk patients who might not need additional testing [17][18]. ML models, combining clinical and imaging parameters, have been shown to have higher predictive power than traditional risk scores when predicting the PTP of obstructive CAD [19][20].
Various ML algorithms based on stress imaging, particularly single-photon emission computed tomography (SPECT), have been devised to facilitate the prediction of CAD. These models combined the clinical and demographic characteristics with the quantitative variables, as evaluated via SPECT to better predict CAD compared with the visual interpretation or quantitative variables alone [21][22][23][24][25][26].
Cardiac phase-space analysis is a novel noninvasive diagnostic platform that combines advanced disciplines of mathematics and physics with ML
[27]. Thoracic orthogonal voltage gradient (OVG) signals from a patient are evaluated by cardiac phase-space analysis to quantify physiological and mathematical features associated with CAD. The analysis is performed at the point of care without the need for a change in physiologic status or radiation. Initial multicenter results suggest that resting cardiac phase-space analysis may have comparable diagnostic utility to functional tests currently used to assess CAD
[28].
Finally, the assessment of regional wall motion abnormalities (RWMAs) on echocardiography has been associated with the presence of obstructive CAD, and as such can be useful in helping clinicians with downstream decision-making
[29].
3. Artificial Intelligence in Management of CAD in the Emergency Department
Chest pain is a common emergency department presentation, and distinguishing cardiac from noncardiac pain causes is crucial for optimal management. Modalities such as electrocardiography (ECG) serve as a quick way to recognize patterns associated with unstable CAD, and in particular acute coronary syndromes (ACSs). Deep neural networks have shown a consistent performance in image recognition, and models have hence been devised to identify patterns related to CAD and myocardial infarction (MI)
[30][31][32]. By reducing interobserver variability and providing accurate results efficiently, this approach holds the promise of improving workflow across healthcare systems, while helping patients in areas of limited medical infrastructure and specialized care.
The 2021 American College of Cardiology/American Heart Association (ACC/AHA) chest pain guidelines advocate for the use of coronary CT angiography (CCTA) in intermediate-risk patients presenting with acute chest pain who either have no known history or a history of nonobstructive CAD (defined as coronary artery disease with less than 50% diameter stenosis)
[18]. Given the ability of CCTA to accurately define coronary anatomy and extent/distribution of atherosclerotic plaque, it has been consistently shown to be a useful noninvasive imaging modality for patient selection, particularly for those who might require further invasive evaluation. However, interpretation of CCTA scans requires expertise and is time-intensive. Therefore, automatic interpretation of CCTA, which can lead to a significant reduction in the processing times, is highly desirable. ML algorithms have recently been developed, achieving a 70–75% reduction in reading time compared to that required for human interpretation (2.3 min for AI vs. 7.6–9.6 min for human readers). Though the model described performed slightly lower than highly experienced readers in interpreting CCTA (AUC 0.93 vs. 0.90 for human vs. AI,
p < 0.05), when combined with low-experience human readers, it augmented the reader’s ability to correctly reclassify obstructive CAD (per-vessel net reclassification index (NRI) 0.07,
p < 0.001)
[33]. In addition, ML has been applied for various segmentation and classification tasks on cardiac CT imaging, from automatic segmentation of calcified and noncalcified plaque to automated calculation of the Agatston CAC score, and finally quantification of cardiac structures on CT imaging
[34][35][36][37][38][39][40][41]. Therefore, the application of ML could provide reliable results in real time, while bridging the dearth of experts in low-resource settings.
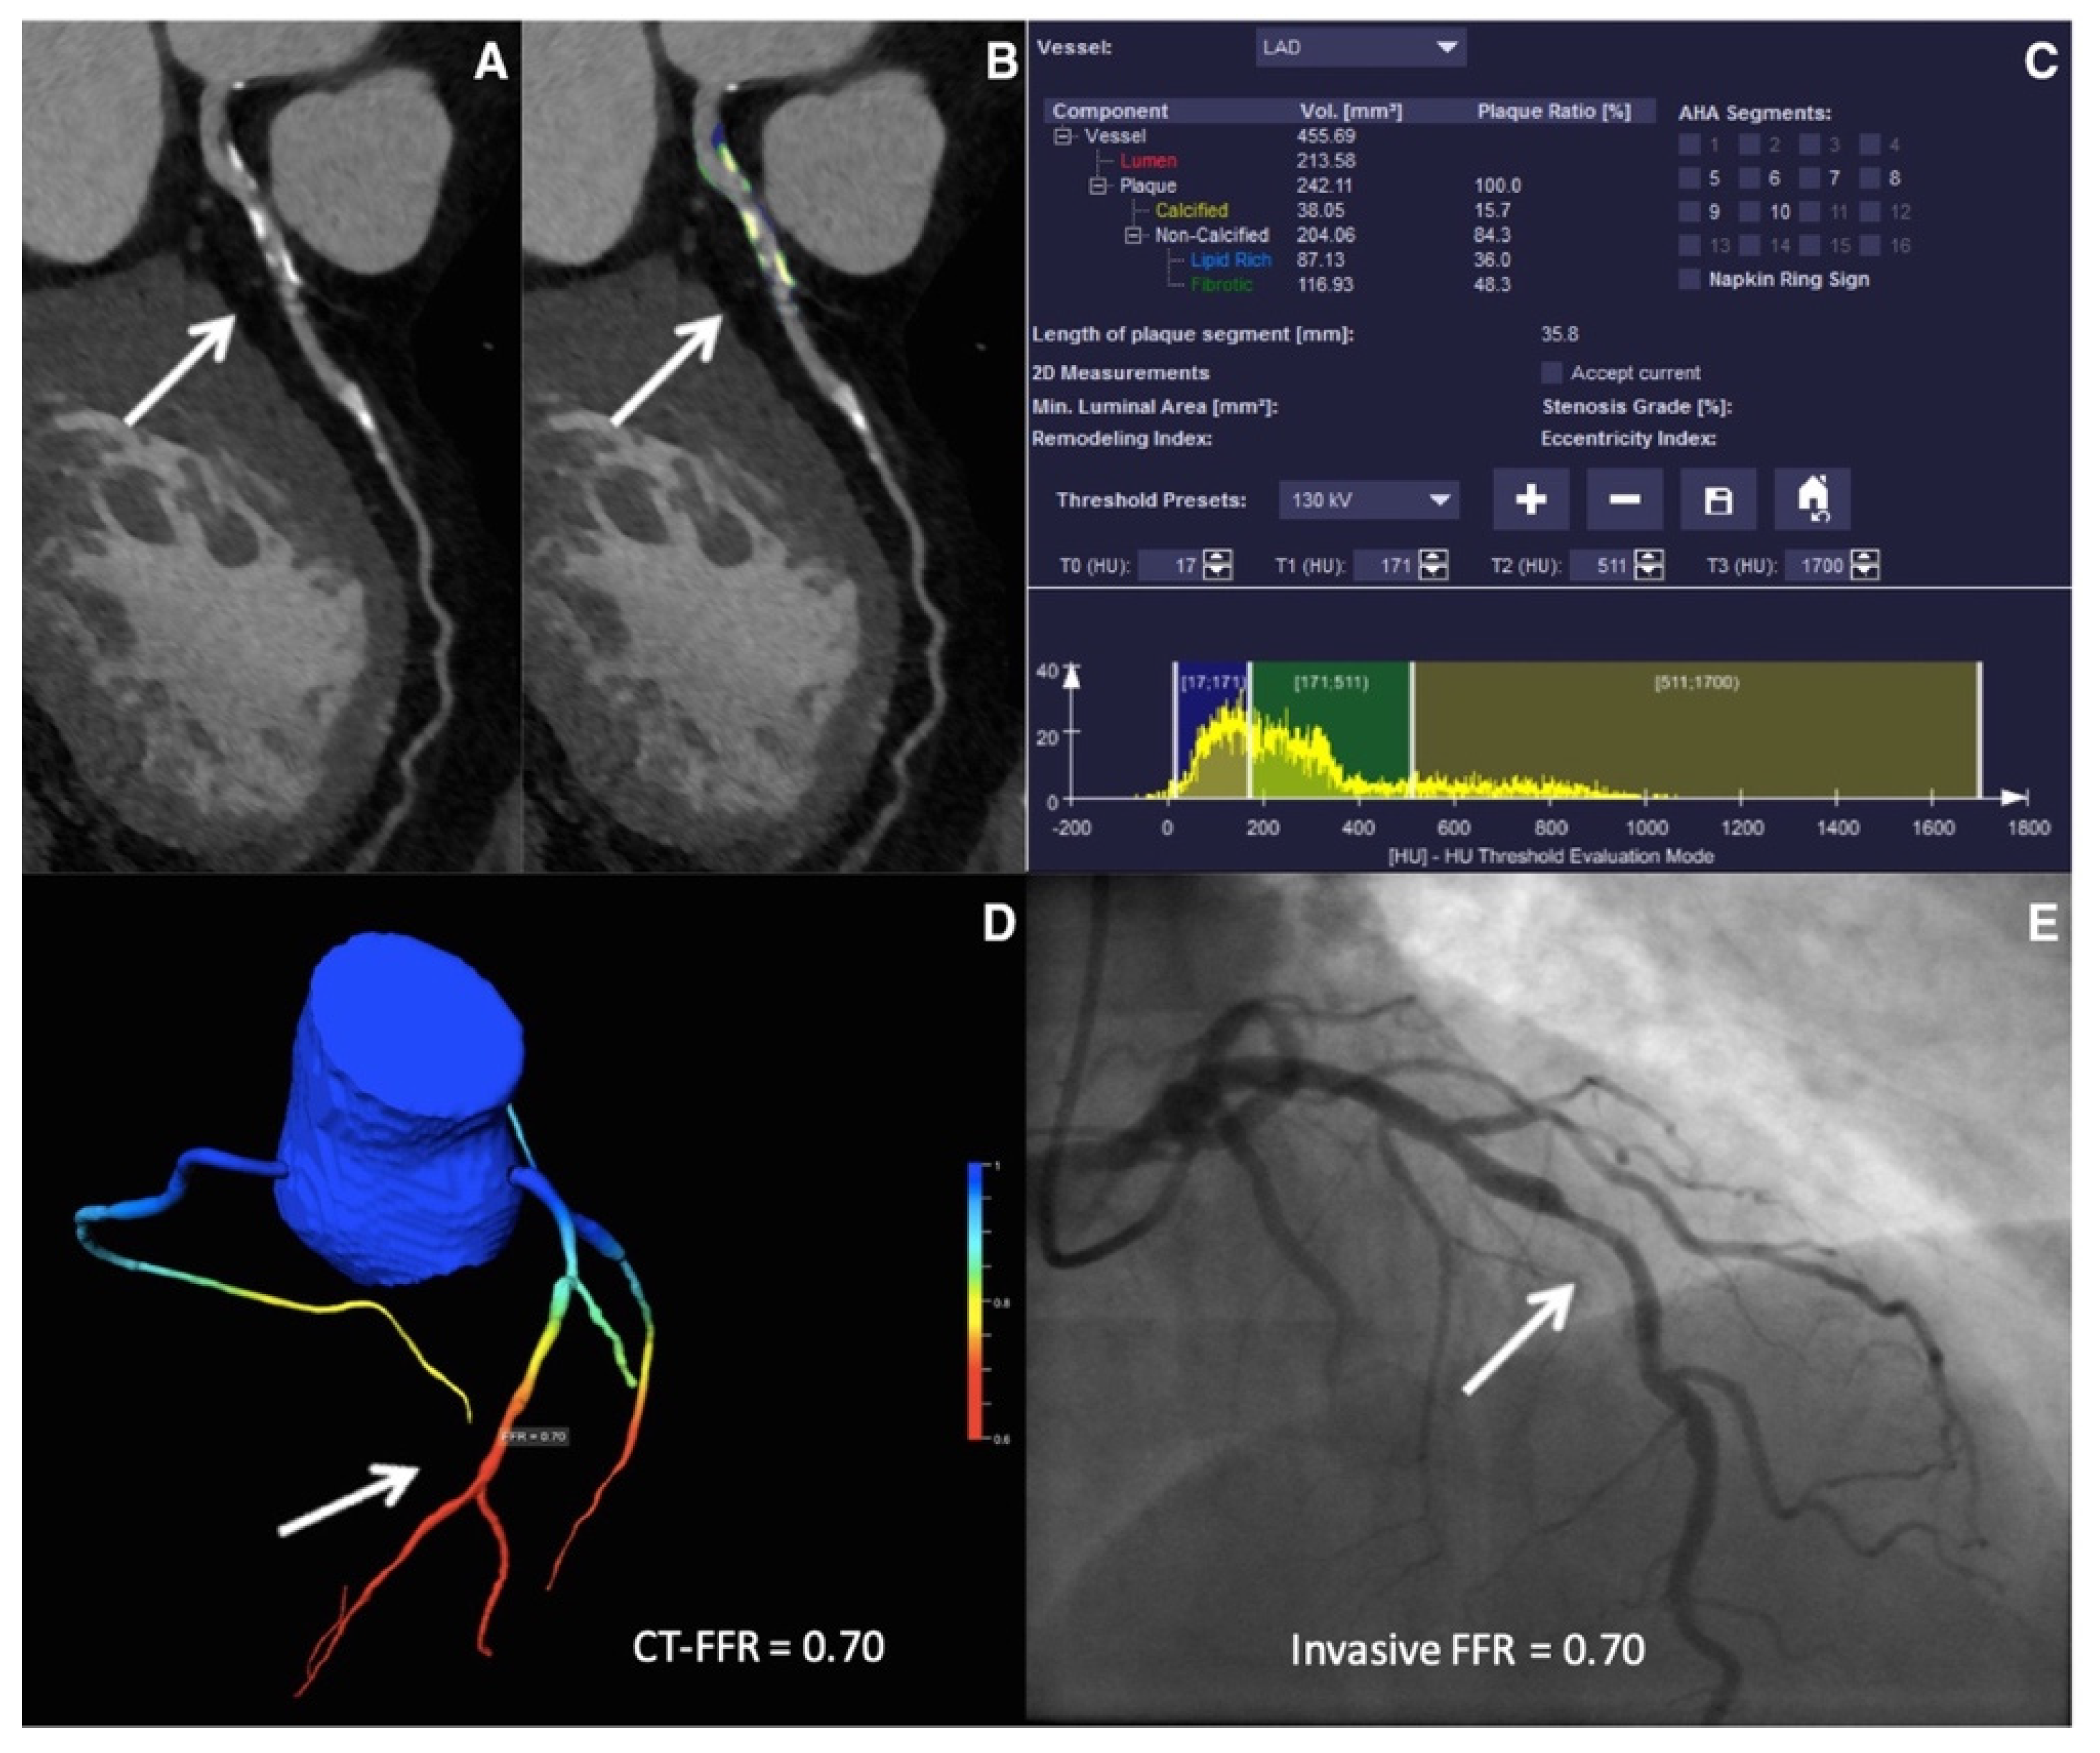
Figure 2. ML-based fractional flow reserve from cardiac CT (CT-FFR
ML). Machine-learning-based coronary plaque analysis quantifies atherosclerotic plaque into calcified and noncalcified components (
A,
B). This is further integrated with other quantitative parameters (
C) and transformed into 3-D images of the vessels to give CT-FFR
ML (
D), which has been shown to have a good correlation with invasive fractional flow reserve (FFR—
E). Adapted with permission from Von Knebel Doeberitz et al.
[33], Elsevier.
Stress testing, which provides an estimate of myocardial perfusion and viability, has been recommended as an alternative to CCTA in intermediate-risk chest pain patients
[18]. Myocardial perfusion imaging, particularly SPECT, has been employed to recognize patients who might need an invasive evaluation, with a diagnostic sensitivity of 75–88% and specificity of 60–79%
[42][43][44][45][46][47]. SPECT can be evaluated qualitatively in terms of size, severity, location, and reversibility of perfusion defect, and quantitatively, in terms of total perfusion deficit (TPD), summed stress score (SSS), summed rest score (SRS), as well as stress and rest volumes
[48]. Automatically generated polar maps (representing radiotracer distribution in a two-dimensional plane) after three-dimensional segmentation of the left ventricle (LV) have been used as raw data for quantitative analysis. After the LV polar map is divided into 17 segments, each of the segments is graded on a scale of 0–4 based on the severity of ischemia. The scores are then summated to generate SSS and SRS
[49]. Polar maps also provide information about the overall extent and magnitude of ischemia, in terms of TPD
[49][50]. These objective variables extracted from the quantitative analysis offer an increased degree of reproducibility and can be incorporated into risk scores to predict mortality
[50][51]. The diagnostic accuracy of qualitative and quantitative approaches is comparable, as has been shown in numerous studies
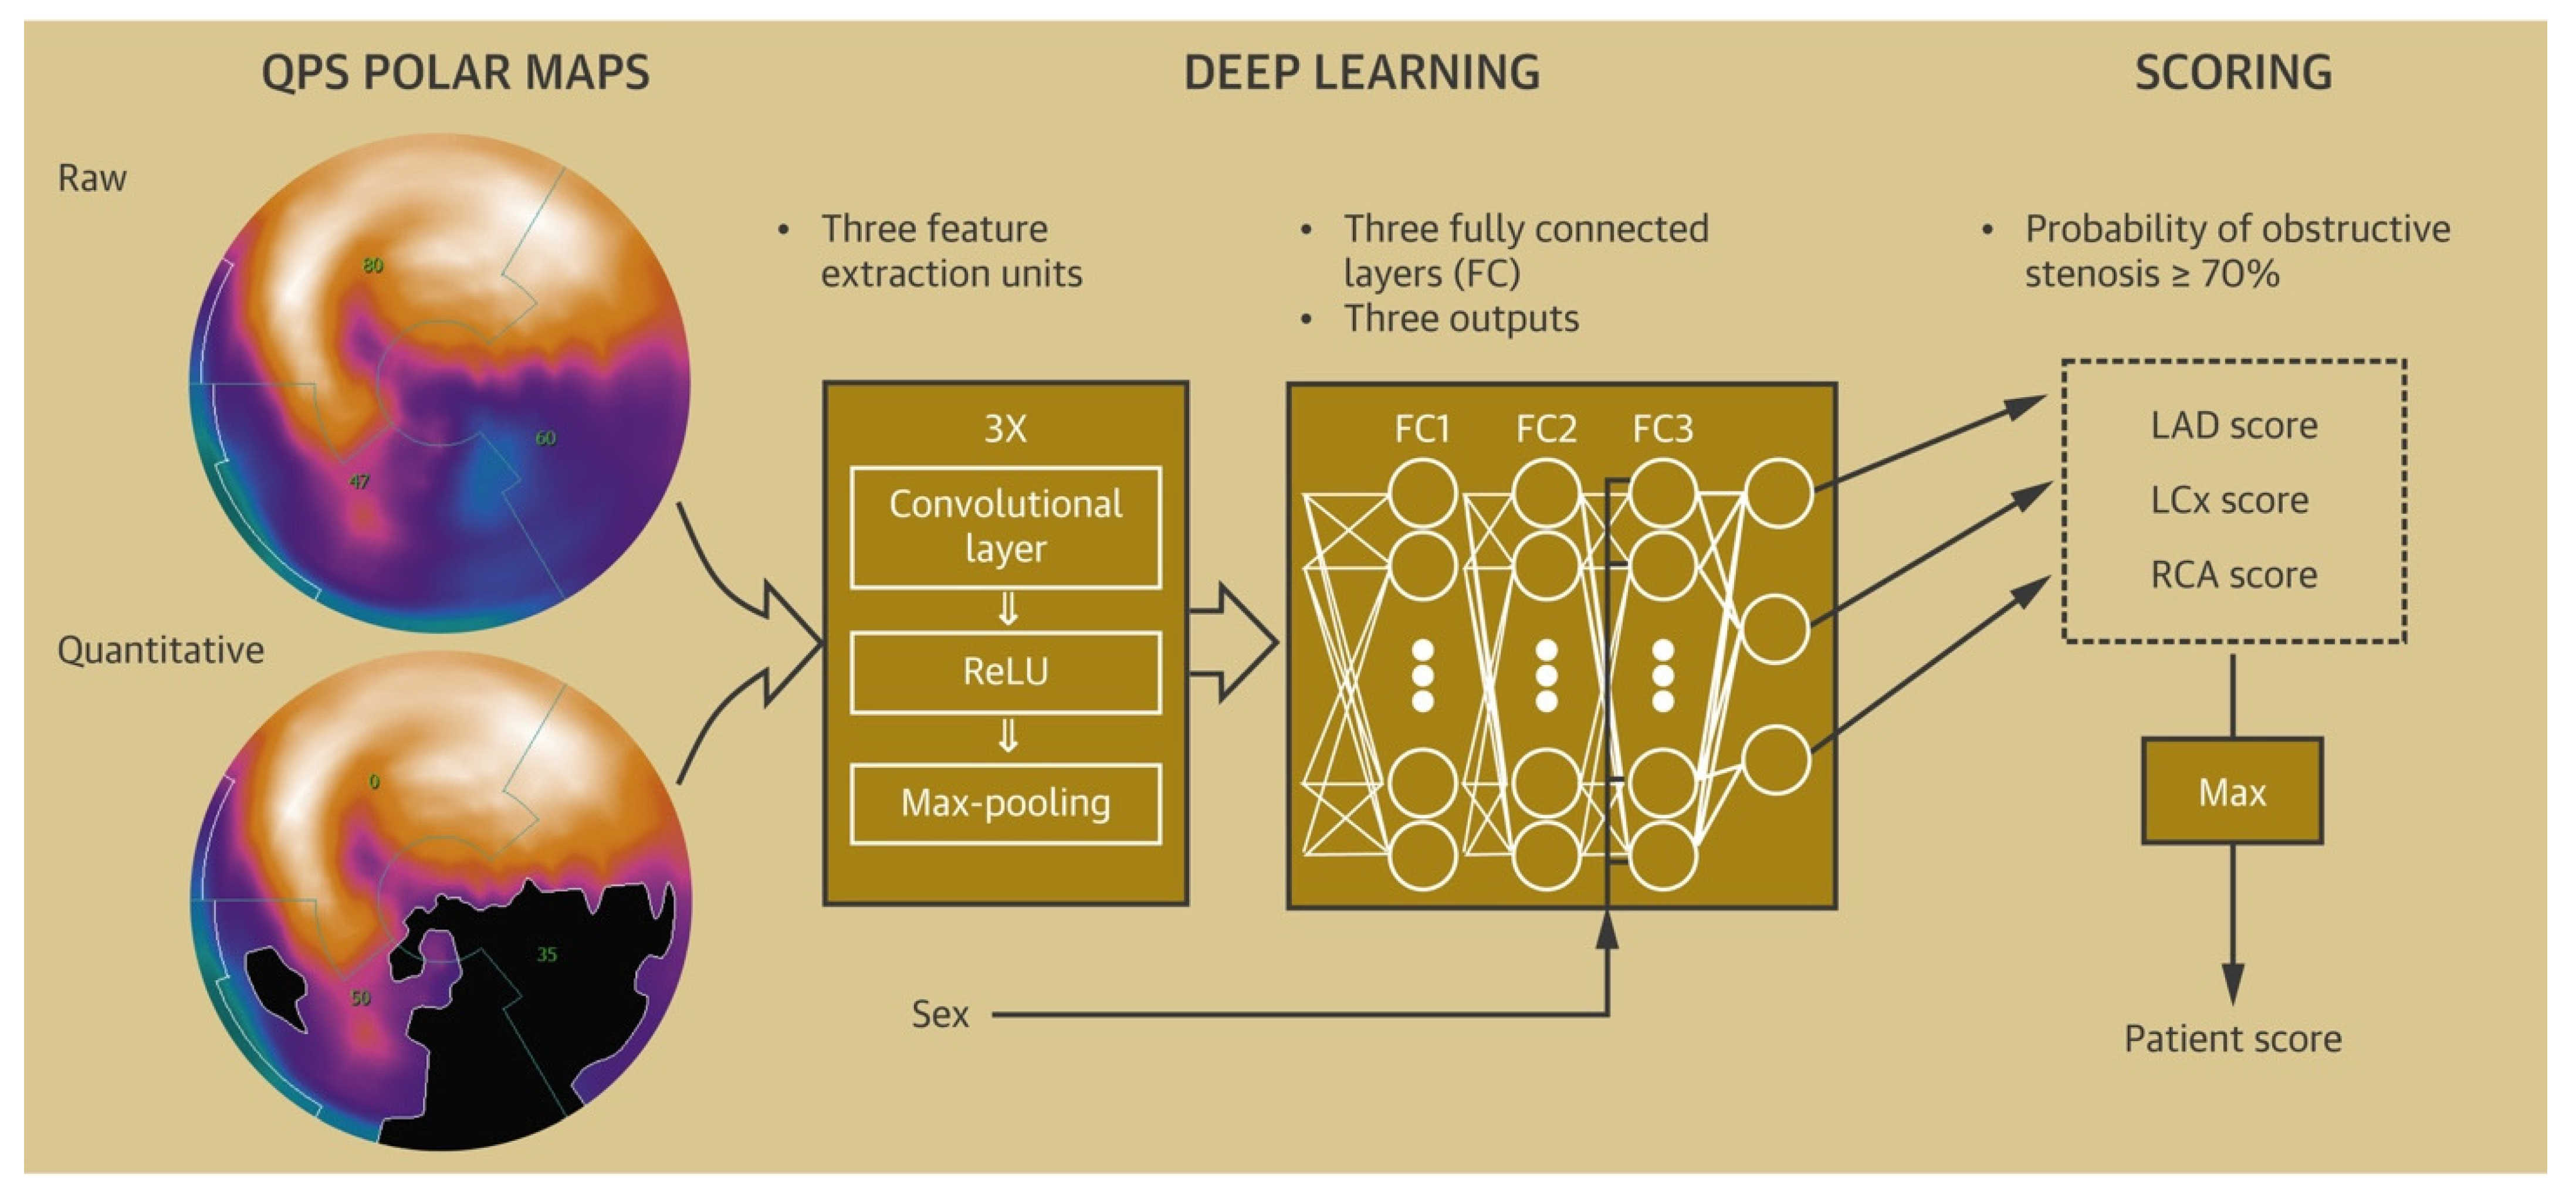
[52]. A deep convolutional neural network-based model derived from polar maps (
Figure 3) had a superior performance compared to TPD in predicting obstructive coronary artery disease (the AUC for ML were 0.80 and 0.76 vs. 0.78 and 0.73 for TPD on a per-patient and per-vessel basis respectively,
p < 0.01). In addition to diagnosis, models to predict early revascularization (<90 days from SPECT) have been developed and have demonstrated better performance than individual SPECT variables on a per-patient and a per-vessel level
[53][54].
This entry is adapted from the peer-reviewed paper 10.3390/healthcare10020232