Your browser does not fully support modern features. Please upgrade for a smoother experience.
Please note this is an old version of this entry, which may differ significantly from the current revision.
Subjects:
Biology
Convolutional neural network (CNN), is mainly composed of two parts: a feature extractor CNN is used to automatically extract features from sequences and predictor XGBoost is applied to predict features extracted after convolution.
- Crispr/Cas9
- sgRNA
- on-target
- deep learning
- XGBoost
1. Introduction
The Crispr/Cas9 system is derived from the process by which phages infect bacteria. Crispr (clustered regularly interspaced short palindromic repeat) represents the sequence of short replies that are regularly spaced in clusters, with approximately the same length and specificity [1]. Crispr is a common immune system in bacteria used to fight viruses or exogenous DNA. The Crispr/Cas9 system directs the corresponding single guide RNA (sgRNA) recognition, positioning, fighting and cutting of target fragments of viral DNA by integrating invasive DNA fragments into the interval DNA. The recognition process is target recognition by the principle of complementary base pairing at a double-stranded target position of DNA with protospacer adjacent motif (PAM motif) [2,3].
Although Crispr/Cas9 relies on the principle of complementary base pairing for specific recognition, the Cas9 nucleases are tolerant to base matching between sgRNA and target DNA sequences. With the exception of cutting the target DNA duplex normally, sgRNA may also partially match with non-target DNA sequences with higher target homology, activating Cas9 to cut non-target sequences and producing off-target effects even though no mismatch exists at this time [4,5,6]. The off-target effects will seriously affect the practical application of Crispr. Effective evaluation of off-target and accurate prediction of on-target knockout efficacy of sgRNA has become the focus of Crispr/Cas9 system research.
Many models [7,8,9,10,11,12,13,14,15,16,17] have been developed to predict sgRNA on-target knockout efficacy with their own characteristics. From the beginning of the application of machine learning models in this field, sgRNA Designer [7] constructed a model for predicting sgRNA on-target cleavage efficacy with the help of machine learning algorithms such as SVM and random forest, characterized by biological sequence information such as sgRNA dinucleotide and GC content. Then, deep learning algorithms were gradually applied. DeepCrispr [8] introduced sgRNA sequence information and epigenetic information as characteristics for “one-hot” coding and used a CNN to build a framework for model prediction. In addition, they automated the whole feature identification procedure purely based on the available training data and the learning model and generated the feature saliency map for sgRNA on-target site prediction based on the existing training data to identify the preference for purine mismatches. DeepCpf1 [9] was characterized by sgRNA sequence and chromatin accessibility and built a prediction model based on a CNN. With “Transformer” showing good results in the field of natural language processing (NLP), the model based on an attention mechanism has been noticed. AttnToCrispr_CNN [10] encoded each position into a vector in a positional embedding layer as part of the characteristics and integrated features learned from advanced transformer-based deep neural network and CNN to build a prediction model. CnnCrispr [11] combined biLSTM and a CNN into a final predictive model. CNN-SVR [12] combined two hybrid architectures, CNN and SVR, for sgRNA on-target prediction. The success of the CNN-SVR model [12] inspired us to extend the application of a hybrid model for CRISPR/Cas9 sgRNA efficacy prediction. In areas such as image classification, a CNN is an efficient neural network learning model, whose convolution kernel plays an important role in feature extraction. A CNN allows [18] computational models that consist of multiple processing layers to learn representations of features with multiple levels of abstraction. The layers of features are learned from data through a generic learning process instead of human engineers. CNNs [19] are multi-layer architectures where the successive layers are designed to progressively learn higher-level features. Although a CNN is considered as one of the most powerful and effective feature extraction mechanisms, the traditional classifier layer of a CNN cannot fully capture the information of the extracted features. Single classifier cannot perform well when faced with complex data features, in this case, ensemble learning combines multiple classifiers together and often achieves good results. Chen [20] proposed an advanced gradient enhancement algorithm, extreme gradient boosted tree (XGBoost), which achieved good results in the Kaggle data competition. XGBoost has been widely used in image classification [21,22] with good performance. Ren et al. [23] proposed a CNN and XGBoost based image classification method. In this model, a CNN is used to obtain image features from the input and XGBoost as a recognizer to produce results to provide more accurate output.
Although there has been some progress and breakthroughs in the prediction of sgRNA on-target cleavage efficacy and many model improvements have been made in recent years, the accuracy and generalization ability of the model still need to be further improved.
2. Overview of CNN-XG Model Architecture
For the prediction of on-target cleavage efficiency, we built CNN-XG (Figure 1). The framework is divided into two parts. The first part is a CNN as the front end of the model for learning and extracting sgRNA genetic information and epigenetic information. The second part is XG-Boost as the back end of the model, which is used to predict the on-target cleavage efficiency of sgRNA. The overall process of the CNN-XG framework is shown in Figure 1a–d. First, the sgRNA sequence and epigenetic sequence are converted into two 4 × 23 binary matrices via one-hot encoding, and then, the encoded sgRNA and epigenetic sequence are fed into the CNN and RF for feature extraction, and XG-Boost is trained based on the extracted characteristics. Ultimately, the well-trained XG-Boost model assigns a prediction score for testing sgRNA.
3. Comparison with CNN Model and XGBoost Model
To verify the feasibility of our approach, we compared our CNN-XG with the CNN model and the XGBoost model separately on each of the four cell line datasets. The current strategy of training is to use a 10-fold cross-validation approach.
For the CNN, we built a new framework with more complex structures to achieve the best performance of the single CNN. Two parameters, the activation function of the predictor and batch size during training, were optimized by using a grid search approach. For XGBoost, we merged the one-hot encoding vector of each base as the feature vector. Similar to sequence coding (see the “2.3. Sequence Encoding” Section), each base in the sequence can be encoded as one of the four one-hot vectors (1,0,0,0), (0,1,0,0), (0,0,1,0) and (0,0,0,1), and then, we concatenate each one-hot vector in order, so that we can get a 1 × 92 feature vector. Table 1 summarizes the results of 10 rounds of cross-validation tests of the final CNN model, XGBoost model and CNN-XG in both classification and regression modes. CNN-XG gets the best performance in both AUROC values and spearman coefficients. These results indicate that CNN-XG is more predictive than CNN or XGBoost working alone for sgRNA on-target activity, further confirming the feasibility and effectiveness of the combination of CNN and XGBoost, showing the superiority of the hybrid model.
Table 1. Comparison with CNN and XGBoost.
| Model | CNN-XG | CNN | XGBoost | CNN-XG | CNN | XGBoost |
|---|---|---|---|---|---|---|
| Spearman | AUROC | |||||
| HCT116 | 0.6548 | 0.6453 | 0.3112 | 0.9732 | 0.9208 | 0.6231 |
| HEK293T | 0.7352 | 0.7252 | 0.1557 | 0.9905 | 0.9716 | 0.5213 |
| HELA | 0.6397 | 0.6308 | 0.3273 | 0.9714 | 0.9163 | 0.6377 |
| HL60 | 0.5473 | 0.5470 | 0.3664 | 0.9706 | 0.9197 | 0.7110 |
The numbers in bold indicate the highest score for each indicator.
3.4. Generalization Ability Test on Independent Datasets
To better compare the generalization abilities of CNN-XG and other existing models for new data, we retested data from three cell lines, K562, A549, and NB4, collected from the CRISPR-Cas9 experiment [26,27]. In this test, we normalized the log2 fold change (log2fc) of sgRNAs as labels in regression mode for training and analysis. We tested the trained models in three cell lines data to compare their generalization ability, and the Pearson coefficient and p-value comparison results are shown in Table 6 and Figure 3f. We can see that CNN-XG also outperformed other models in new datasets. It appears that all the correlation coefficients are small in Table 7. After a further significance test, we found that there were significant correlations between the predicted results and the real values (p-value < 0.001) for the three methods on all test datasets. Furthermore, the p-value of CNN-XG is much smaller than that of the other two methods on the three test datasets. This result shows that CNN-XG has better generalization ability than other methods on independent datasets.
Table 7. Pearson correlations and p-values on generalization test datasets.
| Model | CNN-XG | CNN-SVR | DeepCrispr |
|---|---|---|---|
| A549 | 0.0293 1.405 × 10⁻¹⁵ |
0.0169 4.377 × 10⁻⁶ |
0.0152 3.737 × 10⁻⁵ |
| K562 | 0.0353 2.247 × 10⁻³⁰ |
0.0178 8.242 × 10⁻⁹ |
0.0295 1.002 × 10⁻²¹ |
| NB4 | 0.0455 2.671 × 10⁻³⁵ |
0.0250 1.020 × 10⁻¹¹ |
0.0326 6.512 × 10⁻¹⁹ |
The numbers in bold indicate the highest score for each indicator.
4. Comparison in SpCas9 Variant Data
SpCas9 variants have been developed to improve an enzyme’s specificity or to alter or broaden its protospacer adjacent motif (PAM) compatibility, but selecting the optimal variant for a given target sequence and application remains difficult. The differences between the variants and the PAM create heterogeneity of the data, and the previous model may not be applicable to the new variant data. Therefore, it is necessary for us to test the adaptability of CNN-XG on the new data. There are already many models that have been trained using SpCas9 variants data. Here, we use the same strategy that CRISPR-ONT adopts for on-target comparison. Each dataset was randomly divided into a training dataset and independent test dataset with the proportion of 85%:15%. The training process was performed under 10-fold cross-validation on each training dataset. With this testing scheme, we compared CNN-XG with CRISPR-ONT [34], DeepHF [28], C-RNNCrispr [35], DeepCas9[15] and DeepSpCas9 [29]. We retrieved sgRNA prediction efficiency scores of other algorithms from a CRSPR-ONT [34] study.
The comparison results are shown in Figure 4. We can see that the prediction performance of CNN-XG is similar to CRISPR-ONT, which is the previously published best performing method, with an average increase of 1.82% compared with the second best, DeepCas9. Experiments on various SpCas9 variants datasets demonstrate the effectiveness of our proposed CNN-XG for CRISPR/Cas9 sgRNA on-target activity prediction, which still performs well in the new data. Therefore, we conclude that CNN-XG is competitive against existing methods.
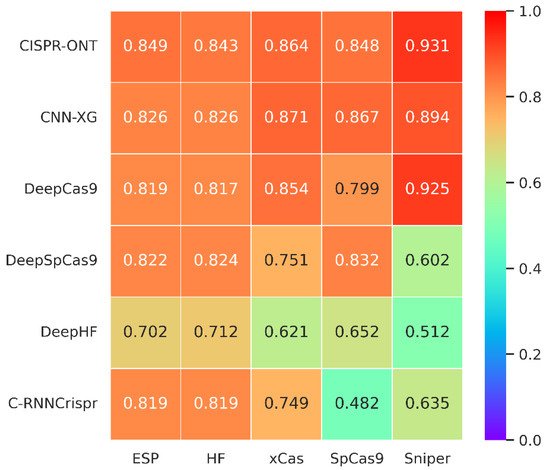
Figure 4. Heatmap of Spearman coefficients between CNN-XG and other recent algorithms on various SpCas9 variants datasets under 10-fold cross-validation. The prediction models are placed vertically, whereas the test sets are arranged horizontally. (The tested spearman coefficients of C-RNNCrispr, DeepCas9 and DeepSpCas9 were derived from CRISPR-ONT [34]).
We further compared the running time of a CNN integrating XGBoost-based XGBoost, a CNN integrating attention-based CRISPR-ONT, the CNN-RNN-based C-RNNCrispr and the pure RNN-based DeepHF. Table 8 reports the training time for each predictor on five datasets over 10-fold cross-validation. We observe that CNN-XG has a significant advantage in terms of runtime. More specifically, we trained CNN-XG using two NVIDIA Corporation GP102 GPUs, spending about 1 h for these datasets. Because of its internal structure, CNN-XG does not need a lot of computational resources. Combined with the results in Figure 4, CNN-XG can achieve good performance with little time and resources for sgRNA efficiency prediction.
Table 8. Overall training time cost comparison of CNN-XG, CRISPR-ONT, C-RNNCrispr and DeepHF on five datasets under 10-fold cross-validation.
| Model | ESP | HF | xCas | SpCas9 | Sniper |
|---|---|---|---|---|---|
| CNN-XG | 694 | 601 | 470 | 456 | 725 |
| CRISPR-ONT | 4123 | 2700 | 2616 | 2170 | 2640 |
| C-RNNCrispr | 161,200 | 15,463 | 10,340 | 9266 | 10,410 |
| DeepHF | 37,860 | 36,287 | 24,289 | 19,320 | 24,018 |
The running time of C-RNNCrispr was derived from CRISPR-ONT [34].
This entry is adapted from the peer-reviewed paper 10.3390/biom12030409
This entry is offline, you can click here to edit this entry!