Overall equipment effectiveness (OEE) is a key performance indicator used to measure equipment productivity. The purpose of this study is to review and analyze the evolution of OEE, present modifications made over the original model and identify future development areas.
- Overall Equipment Effectiveness
- OEE
- KPI
- Literature review
- model-based
1. Introduction
Overall equipment effectiveness (OEE) is a KPI introduced by Nakajima (1988) [5]; this metric was developed as part of the total productive maintenance (TPM) to measure the equipment productivity in a manufacturing system. OEE is a productivity ratio between real manufacturing and what could be ideally manufactured [6]. This indicator is widely accepted as a tool by some companies, e.g., when implementing lean manufacturing [7] or maintenance programs [5] to monitor the actual performance of an equipment. OEE identifies six big losses comprising aspects of availability, performance and quality that reduce the equipment effectiveness. Dunn (2015) [8] defined those three aspects as follows: (i) availability—‘Is the machine running or not?’; (ii) performance—‘How fast is the machine running?’; and (iii) quality—‘How many products satisfied the requirements?’.
Availability measures downtime losses due to breakdowns or setup/adjustments; performance measures speed losses due to minor stoppages and reduced speed; and quality measures defect losses due to process defects or reduced yield [9]. Over time, OEE applications have been modified depending on industry needs; some authors have slightly modified the original formula, whereas others have proposed new formulas.
The insufficiency of OEE as an indicator has resulted in its modification [10]. Many industries have customized it to fit to their particular requirements [11]. Based on the OEE structure, models have been developed for domains such as sustainability [12], line manufacturing [13,14], assets [10], resources [15], transport [16,17] and ports [18].
2. The Focus of the Current Research Effort in the OEE Domain
The bibliometrix R-package was used to analyze the 186 articles from the two electronic databases. This packaged, which is written in the R language, provides a set of tools for quantitative studies in bibliometrics and scientometrics [24]. Using this program, the data extracted from WoS and Scopus were consolidated to perform a comprehensive bibliometrics analysis of the current research effort pertaining to OEE. Table 1 shows a general data summary from the 186 articles.
Table 1. General data summary.
|
Timespan |
1996–2020 |
|
Sources (journals) |
102 |
|
Documents |
186 |
|
Average citations per document |
16.57 |
|
Author keywords |
554 |
|
Keywords plus |
434 |
|
Authors |
450 |
|
Authors of single-author documents |
25 |
|
Authors of multi-author documents |
425 |
Despite a 24 years timespan, scientific productivity increased only in the later years. The results show that more than 50% of the publications regarding OEE were published in the last five years, indicating that interest in the OEE indicator has increased, i.e., by 9.1% in 2015, 9.1% in 2016, 10.8% in 2017, 14.0% in 2018 and 16.7% in 2019. Thus, far, an increase of 3.2% has been reported for 2020. Figure 2 presents (a) the number of articles per year since 1996 until 9 April 2020, revealing an increasing interest in the subject and (b) the top 10 journals with increasing publications over time.
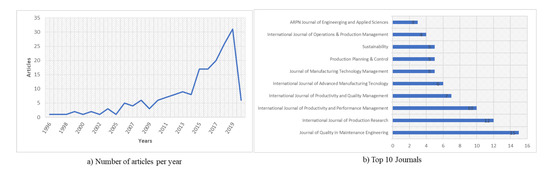
Figure 1. Basic data analysis of (a) number of articles per year and (b) Top 10 journals.
The total number of journals published regarding OEE was 102. Journals pertaining primarily to manufacturing or maintenance issues were not the only ones that focused on the OEE indicator. Evidence shows that an increasing number of journals are focusing on sustainability, business, logistics, mining, etc.
The current effort to spread the topic based on contributor and geographical location is shown in Figure 2. Europe is the continent with the most publications (45%) followed by Asia (26%), America (7%) and Africa (5%), as shown in Figure 2a. Figure 2b presents the top 10 countries in terms of single country publication (SCP) and multiple country publication (MCP). More than 80% of the publications were written by authors belonging to the same country; all the scientific productions in India were based entirely on SCPs, unlike the UK and Spain, who collaborative with other countries. Figure 2c indicate the top 10 most productive authors, including the number of articles (N articles) and total citations per year (TC per year). Greek author Panagiotis Tsarouhas was the first in the top 10, with 83.33% of his publications reporting cases in which OEE was applied to different production industries, e.g., croissant production lines [25], ice cream production lines [26] and production plants of Italian cheese [27] to identify potential opportunities for improving production systems. Braglia and Huang published four articles, whereas the other authors from the top 10 published three articles each. Some of them have developed new models based on OEE, whereas others have applied the indicator in different industries to measure equipment, process or resource effectiveness.
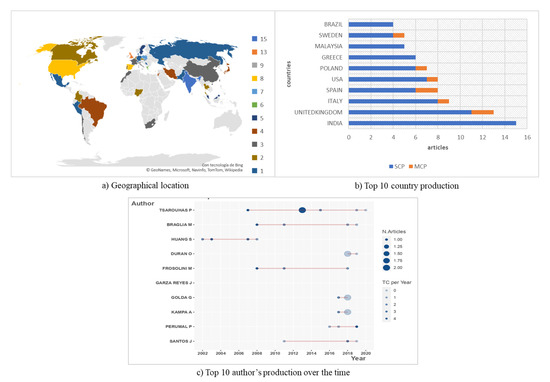
Figure 2. The effort in terms of (a) geographical location (b) top 10 country production and (c) authors contribution over the time.
Three inclusion criteria were used for the analysis in this study. (a) Criteria I1—include papers that are literature reviews and/or are related specifically to OEE and its application; (b) Criteria I2—studies that mention OEE-based models; (c) Criteria I3—papers that only use the OEE to verify an improvement or change in any process (Table 2). Approximately 20% of the articles contributed scientifically to the modification or new development of models based on the original OEE (Figure 3). Instead of for use in production, the new models were built to measure the effectiveness in areas such as transportation, sustainability, mining, electricity and resources (human and monetary).
Table 2. Overall equipment effectiveness (OEE) application contribution by area.
|
Application Area |
Inclusion Criteria |
1996–2000 |
2001–2005 |
2006–2010 |
2011–2015 |
2016–2020 |
|
Productivity in manufacturing processes |
I1 |
|
[28–30] |
[31,32] |
[33–39] |
[26,40–60] |
|
I3 |
|
|
[61] |
[62–75] |
[76–93] |
|
|
Productivity in maintenance |
I1 |
[94,95] |
|
|
[27,96–98] |
[25,99–110] |
|
I3 |
[111,112] |
[113] |
[114–121] |
[122–129] |
[130–141] |
|
|
Oriented to resources productivity |
I1 |
|
|
[142] |
[143] |
[144–149] |
|
I3 |
|
|
|
|
[150–152] |
|
|
Supply chain productivity |
I1 |
|
|
|
[153] |
|
|
I3 |
|
|
|
[154,155] |
[156] |
|
|
Other |
I1 |
[9] |
[157] |
[158,159] |
[160–163] |
[164–166] |
|
I3 |
|
[167] |
[168] |
[169] |
[170–172] |
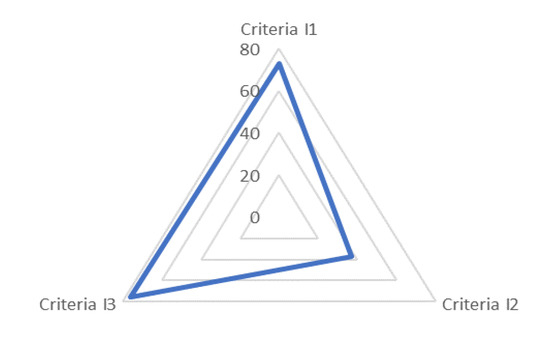
Figure 3. Distribution of inclusion criteria of analysis.
Two types of keywords are shown in Table 2: the author’s keywords and keywords plus. The former is provided by the original authors, whereas the latter is extracted from titles of cited references by Clarivate Analytics (WoS). Figure 4 shows the co-occurrence network of the author’s keywords; the number of nodes in the network was 40 and was related through association; the clustering algorithm used was Louvain. The network comprised four clusters. The first one comprised nine keywords related to the OEE formulation, availability, performance, quality, downtime, speed loss, etc. The second cluster comprised 12 keywords related to total productive maintenance, optimization, production, maintenance and autonomous maintenance. The third cluster comprised terms such as effectiveness, throughput and performance measurement. The last cluster comprised 13 keywords pertaining to current issues, such as Industry 4.0, simulation, lean manufacturing, six sigma, SMED and DMAIC.
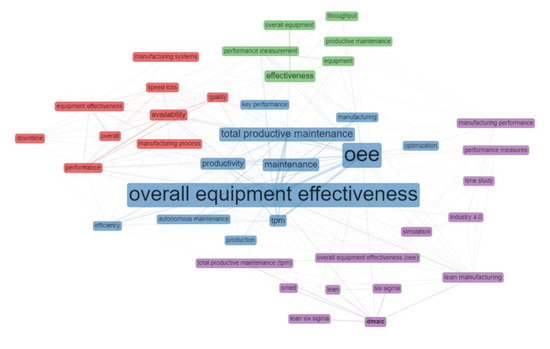
Figure 5. Co-occurrence network.
Initially, studies regarding OEE are associated with total productive maintenance; subsequently, they are associated with the industry, availability and manufacturing process. Currently, they are related with terms such as lean manufacturing, improvement, implementation, reliability, design and optimization. The most cited document obtained from the systematic review considers quality assessments, such as lean tools and six sigma, to improve productivity and financial savings, e.g., in the die-casting unit of a company [115].
3. The Developed Models based on OEE
Over time, industries have adapted OEE to their needs. Hence, several authors have developed slight modifications to Nakajima’s model whereas others have developed new indicators based on the originally formulated OEE.
A list of models based on OEE, listed by the author and model name, is shown in Table 3. A brief description of each model is provided as well.
Table 3. List of models based on OEE.
|
Author |
Year |
Model Name |
Brief Description |
|
[173] [174] |
2002 2007 |
Overall throughput effectiveness |
Calculates the productivity of a manufacturing system; measures the factory level performance; identifies the bottleneck and hidden capacity. |
|
[175] |
2005 |
Equipment effectiveness |
Measures the equipment-dependent states, such as productive state, scheduled downstate and unscheduled downstate. |
|
[13] |
2006 |
Overall line effectiveness |
Measures the productivity of a line manufacturing system. |
|
[176] |
2006 |
Total equipment efficiency |
To achieve total equipment efficiency, it must include the resource usage efficiency of a machine. This input factor (resource requirements) is known as the overall input efficiency. |
|
[10] |
2008 |
Overall asset effectiveness Overall production effectiveness |
Measures losses due to external and internal factors contributing to overall production/asset effectiveness. |
|
[177] |
2008 |
Modified OEE |
Includes new factor usability; it classifies unplanned downtime events into equipment-related downtime. |
|
[6] |
2008 |
Overall equipment effectiveness of a manufacturing line |
Measures the performances of an automated line in the system. |
|
[16] |
2010 |
OEE for shovel/oee for trucks |
OEE is calculated for mining equipment. |
|
[14] |
2010 |
Overall line effectiveness |
The performance of the production line in the manufacturing system is measured. |
|
[178] |
2010 |
Overall equipment effectiveness market-based |
Monitors production in the steel market; measures equipment effectiveness for a full process cycle. |
|
[179] |
2011 |
Integrated equipment effectiveness |
This integration is based on three elements: loading-based, capital-based and market-based elements. |
|
[180] |
2012 |
Overall equipment and quality cost loss |
Calculates the losses of equipment, specifically production and quality cost losses, in monetary units. |
|
[181] |
2013 |
Overall resource effectiveness |
Includes losses related to resources, e.g., people, machines, materials and methods. |
|
[182] |
2015 |
Machining equipment effectiveness |
Calculates the OEE of a high-mix-low-volume manufacturing environment. |
|
[15] |
2015 |
Overall resource effectiveness |
Provides information regarding the process performance based on factor material efficiencies, process cost and material cost. |
|
[12] |
2015 |
Overall environmental equipment effectiveness |
Identifies losses due to sustainability, based on the calculated environmental impact of the workstation. |
|
[183] |
2015 |
Fuzzy overall equipment effectiveness |
Identifies performance fluctuations through LR Fuzzy numbers. |
|
[184] |
2016 |
Stochastic shovel effectiveness |
Quantifies performance effectiveness of electric and hydraulic shovels. |
|
[185] |
2017 |
OEE of BELT equipment |
Bucket-based excavating, loading and transport (BELT) including all equipment comprising a bucket, e.g., draglines, shovels, load-haul-dumps and trucks. |
|
[186] |
2017 |
Strategic equipment effectiveness Operational equipment effectiveness |
A global measure of the effectiveness of an integrated electrical system. |
|
[187] |
2017 |
Overall machinery effectiveness |
Identifies and ranks decision-making-units in terms of efficiency. |
|
[18] |
2017 |
OEE of port terminal |
Identifies the most efficient terminal, addressing either manageable or unmanageable factors. |
|
[188] |
2017 |
Modified OEE |
Includes losses associated with human factors and usability (the frequency of setup and changeover process) |
|
[189] |
2018 |
Extended overall equipment effectiveness |
Evaluates the entire process considering human resources and equipment Performance. It is applied in medicals activities of operating rooms. |
|
[17] |
2018 |
OEE to transport management |
Improves efficiency in road transport by adapting OEE to transport management. |
|
[11] |
2018 |
Modified OEE |
Optimizes the effectiveness of urban freight transportation. |
|
[190] |
2018 |
Overall material usage effectiveness |
Measures material usage effectiveness and identifies material loss in the manufacturing process. |
|
[191] |
2018 |
Sustainable overall throughputability effectiveness |
Includes sustainability criteria and can be used in the system lifecycle. |
|
[7] |
2019 |
Overall task effectiveness |
Analyses and evaluates losses related to manual assembly tasks. |
|
[192] |
2019 |
Modified OEE |
Improves the effectiveness of scheduling jobs with earliness/tardiness. |
|
[193] |
2019 |
OEE–TCQ |
Improves the process approach in maintenance in terms of time, cost and quality. |
|
[194] |
2019 |
Overall effectiveness indicator |
Adapted for mining production to examine the effectiveness of the mining machine. |
|
[195] |
2019 |
Standalone OEE |
Identifies system bottleneck and excludes effects from upstream and downstream. |
|
[196] |
2019 |
Modified OEE |
Calculates the OEE in serial, parallel and combined machine systems in the production line. |
|
[197] |
2019 |
Modified OEE |
Includes a term that considers material utilization. |
|
[198] |
2019 |
Overall substation effectiveness |
Measures substation performances and indicates the overall maintenance performances. |
As presented above, the OEE was modified to solve gaps in various issues, such as sustainability, human factor, transport, manufacturing system, mining, cost, port and resources.
4. The Principal Contributions in OEE and Its Future Trends
Initially, OEE was used in production, in particular for TPM, which assists in identifying the overall equipment performance in a manufacturing process [199]. To accommodate industry needs, some researchers began to analyze the productivity of manufacturing line systems [6,13] or factories [174]. Currently, OEE is used with continuous improvement methodologies, such as lean manufacturing to increase productivity by eliminating waste [200]. It is also used as a KPI and data collection tool to measure the effectivity and process capability of new six sigma implementations [61]. Following the methodology of continuous improvement, Braglia et al. (2019) [7] developed a new metric based on OEE, known as overall task effectiveness. This new indicator supports lean and six sigma methodologies to identify, analyze and evaluate losses that occur during manual assembly activities.
Sustainability is an aspect that has been investigated by several companies in recent years [201], which shows that concerns regarding the environment have been growing. Hence, it has become increasingly important to include this variable as a criterion in business decision-making. Ghafoorpoor Yazdi et al. (2018) [150] created a design in a study based on OEE and its relationship with sustainability in Industry 4.0. Meanwhile, other authors incorporated the concept of sustainability in OEE, e.g., Domingo et al. (2015) [12] developed the overall environmental equipment effectiveness to identify and measure losses due to sustainability. Likewise, Durán et al. (2018) [191] designed the Sustainable Overall throughput effectiveness indicator to measure the operating performance and factory level sustainability.
The OEE has been adapted for the transport sector. To the best of our knowledge, it first occurred in the mining industry [16] and was used to identify possible losses in the availability, performance and quality of equipment such as shovels and trucks. In recent years, the efficiency framework in the port terminal [18] that considers manageable and unmanageable variables has been studied to create indicators based on OEE. Additionally, the OEE has been adapted to road transportation [17] based on distance, load capacity, route time, stops and services. Furthermore, it has been used to evaluate the effectiveness of urban freight transportation [11] as well as optimize availability, performance and quality metrics.
Accordingly, some authors have established interesting frameworks that can be developed in future studies. Some of them proposed future studies based on the frameworks that they have developed thus far, whereas others developed innovations in new areas. Abdelbar et al. (2019) [193] used a new OEE formula to identify and implement process improvements. Braglia et al. (2018) [190] extended the proposed methodology, including the analysis of material losses based on the finished product. Ghafoorpoor Yazdi et al. (2018) [150] proposed re-performing experiments for long time periods and as a case study in the manufacturing industry. Dadashnejad and Valmohammadi, (2019) [76] applied the same value stream mapping technique that is used to identify improvements in other factories.
By contrast, other authors proposed different areas in which OEE is applicable. In the study by García-Arca et al. (2018) [17] where OEE was adapted to transport management, they assume that the same methodology is applicable to the service sector and other logistics processes, such as goods reception or performing selection in a warehouse. Sharma et al. (2018) [137] and Supriyanto and Mokh (2018) [59] reported that their studies can be replicated in the service sector as well as in other industries, such as pharmaceutical, electrical/electronic, textile and transportation (rail and air travel).
This entry is adapted from the peer-reviewed paper 10.3390/app10186469