The operationalization of the Water-Energy Nexus in the water supply is gaining a lot of attention among water utilities, water regulators and stakeholders in the water sector. This is due to the growing body of evidence on the potential benefits of exploration of potential energy savings in the supply of water services, as the largest controllable operational input with short payback periods on investment. As population grows, high urbanization and the demand for water services increases especially in Africa, water utilities are faced with the challenges of meeting the current demand and expansion of services. However, there is paucity in the assessment of energy input for water supply and energy use is not considered as a key performance indicator for water utilities. Yet, accrued benefits from scrutinizing energy input in the water sector provides potential benefits of savings, revenue recovery and expansion of water services.
- Water-Energy Nexus
- Water supply
- Water utilities
- Energy efficiency
- key performance indicator
- Africa
Note:All the information in this draft can be edited by authors. And the entry will be online only after authors edit and submit it.
Definition:
Water-Energy Nexus is the inter-linkage and dependence of production and use of water and energy resources on each other and the associated trade-offs and synergies of considering this connectedness
1. Introduction
Water and energy resources are intricately connected in their production and consumption [1–3]. On a global scale, water and energy are placed as Goals Six (6) and Seven (7) in the 2015 launched United Nations Sustainable Development Goals (SDGs), with targets 6.1 and 7.1 emphasizing increased universal access to water and energy, respectively, while 6.4 and 7.3 focus on improving water efficiency and energy efficiency [4]. Consequently, global efforts to address the role of water and energy resources in a coordinated manner through research and policy for sustainable development have increased steadily with the application of the Water-Energy Nexus framework [5,6]. This close intrinsic interconnection between production, consumption, and management of water and energy resources commonly referred to as the Water-Energy Nexus was discussed in the Bonn 2011 Water-Energy-Food Nexus conference [7], as a framework to address the complex global water and energy needs, interactions, synergies, conflicts, and trade-offs, which were traditionally considered independently in their utilization, governance, and policy formulation [8,9]. Since then, the application of the Water-Energy Nexus concept in the drinking water sector has received increased attention from researchers, water utilities, development partners, and regulators in the last decade. This is to enhance the understanding of the role of energy in water supply and energy saving potentials through technical assessments [10,11] and synergistic water and energy policy formulation [5,12].
Water and energy resources are intricately connected in their production and consumption [1–3]. On a global scale, water and energy are placed as Goals Six (6) and Seven (7) in the 2015 launched United Nations Sustainable Development Goals (SDGs), with targets 6.1 and 7.1 emphasizing increased universal access to water and energy, respectively, while 6.4 and 7.3 focus on improving water efficiency and energy efficiency [4]. Consequently, global efforts to address the role of water and energy resources in a coordinated manner through research and policy for sustainable development have increased steadily with the application of the Water-Energy Nexus framework [5,6]. This close intrinsic interconnection between production, consumption, and management of water and energy resources commonly referred to as the Water-Energy Nexus was discussed in the Bonn 2011 Water-Energy-Food Nexus conference [7], as a framework to address the complex global water and energy needs, interactions, synergies, conflicts, and trade-offs, which were traditionally considered independently in their utilization, governance, and policy formulation [8,9]. Since then, the application of the Water-Energy Nexus concept in the drinking water sector has received increased attention from researchers, water utilities, development partners, and regulators in the last decade. This is to enhance the understanding of the role of energy in water supply and energy saving potentials through technical assessments [10,11] and synergistic water and energy policy formulation [5,12].
2. Drivers of Water Demand and Water Supply on Energy Use and their Relevance for Africa
Analyses of water scarcity, defined as the gap between the freshwater resource available and the demand under prevailing conditions, have revealed that about 54% of countries in Africa, especially in the Northern and Southern regions, are either water scarce or severely water stressed, with 20% of the 2016 population living under water scarcity conditions. It is projected that approximately 37% and 57% of the total population in the continent will live under severe water crisis by 2025 and 2050, respectively, as presented in Figure 1 [88]. This is largely driven by water insecurity largely driven by physical shortage, lack of infrastructural capacity, and economic vulnerabilities, which influences water supply and availability. As the population increases and demand for water services soars among African utilities, an understanding of the interdependence of water and energy and their interaction is crucial in the water supply sector. This will ensure the sustainability of water supply services, reduction of water and energy losses, as well as mitigation of greenhouse gas emissions and guiding water-energy policy formulations and future implications of investment in energy efficient systems [6,89]. Population growth, high rates of urbanization, and effects of climate change have been observed as the major drivers of water demand in Africa, where water utilities should incorporate water supply planning in their future [90,91]. The increase in urban population, especially in urban informal and peri-urban settlements, pose a major challenge in the operations of water utilities due to huge non-revenue water losses arising from illegal connections and increased pressure to the already ageing infrastructure. Several drivers of water supply and demand influence the energy demand for the water treatment processes and their influence on energy use for water supply have been explored.
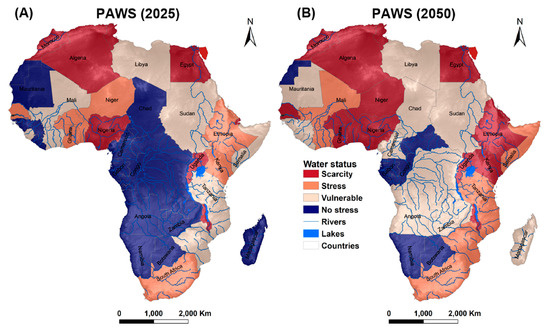
Figure 1. (A,B) Projected available water status showing total available renewable freshwater per capita in African countries in the year 2025 (A) and 2050 (B) [88].
2.1. Demand-Side Drivers
2.1.1. Population Growth and Accelerated Urbanization
The United Nations Department of Economic and Social Affairs (UNDESA) projects that the total population in Africa will be approximately 2 billion by 2050. Furthermore, about 50% of the population in low-income countries and 59% in lower middle-income countries will be city-dwellers in 2050 compared to only 30% and 41%, respectively, in 2018 [92]. This is a 20% increase in about three decades from the current population estimates. In addition, the rate of urbanization in low-income and lower middle-income countries is expected to be two times that of the global rate (0.6%) between 2030 and 2050, the highest among the world’s income categories.
As reported in reference [90], eight out of 10 countries with the highest rates of urbanization in the world are in Africa. Furthermore, reference [91] noted that countries in sub-Saharan Africa that have achieved continued growth in gross domestic product (GDP) have the fastest rate of urbanization, among them Ethiopia, Nigeria, Mali, and Burkina Faso. The urban growth is expanding into the metropolitan areas, most of which do not have an existing water supply infrastructure. This results to low rates of piped water supply coverage, as water utilities are already struggling to meet current demand which outpaces the speed of service expansion. The challenge is further exacerbated by the rise in unplanned urban settlements of low-income households where most of the non-revenue water losses and hence energy losses occur through vandalism and poor management [93]. This has pushed water utilities to increase water production and exploit new raw water sources, such as groundwater and sea water desalination, which often increase the energy demand [24,25].
The 2018 performance assessment report, WASREB, Kenya, indicated that most water utilities in Kenya recorded an average 27% increase in energy costs, attributed to an increase in water production, a rise in national energy prices, and prolonged drought, which resulted in reduced surface water levels; hence, most utilities sought more energy-intensive groundwater options. Increased demand for water implies more energy to abstract and supply water but also require utilities in areas with limited water supplies to explore additional alternative sources, including groundwater and desalination, which are often highly energy intensive. On the other hand, the expanding metropolitan areas present water utilities opportunities to make informed planning of the infrastructure especially with respect to water harvesting and storage structures, renewable energy sources, and energy saving technologies to reduce over-reliance on the grid [91,94].
2.1.2. Per Capita Consumption
The daily per capita water consumption is influenced by socioeconomic status, meteorological conditions, household behavior, and characteristics and restriction of supply through conservation measure, tariffs, price, and metering technology [95,96]. On the supply side, water utilities influence the water demand through the enforcement of smart metering and pre-paid options for access to water services, which reduces non-billed water and enhances increased revenue collection. In the African utilities’ context, there is a huge variation in the daily per capita consumption between and within countries and even among utilities within the same country [64,97]. The average daily water production and consumption for the largest utilities in the country and for those with multiple large utilities, serving a population above 5,000,000, were selected as presented in Figure 2 for the years between 2013 and 2017, for which most data were available at IBNET except for Sudan (latest data available was for 2009), 2005 for Namibia and Madagascar, and 2010 for Mauritius [98]. Huge intra-country variations in production and consumption were observed among utilities in Nigeria and South Africa, attributed mainly to variations in income level. The expansion of the middle-class in most urban areas in Africa with the ability to pay for quality water services have led to increased demand for domestic water supply, and hence, a need for increased production [67]. Consequently, water utilities need to plan for such increase in demand, which is highly dependent on quality data on trends of residential per capita water use within the supply area essential for demand forecasting, pump scheduling, and optimization.
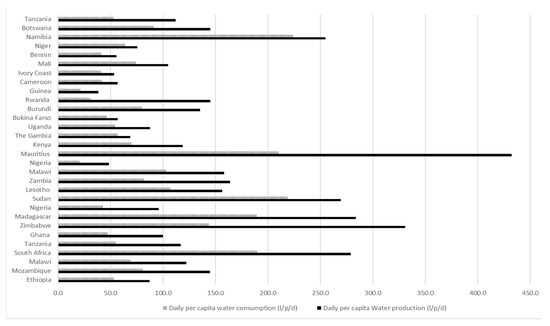
Figure 2. Daily per capita water production and consumption for selected countries in Africa. Data obtained from [98].
2.2. Supply-Side Drivers
The supply-side drivers are mostly external factors that influence the quantity and quality of raw water entering the boundaries of water treatment and distribution systems. Projections of water supply drivers are crucial in the long-term planning of water utilities regarding water sources and possible exploration of alternative sources, which would be energy-intensive. In addition, a clear understanding of the water supply drivers outlined below is crucial in the management of water losses along the water distribution network where the bulk of non-revenue water occurs. Operationalization of the Water-Energy Nexus thus presents opportunities to save water and energy, with energy management measures such as correct sizing of the pumps and motors reported to have as much as 30% energy savings within a 3–6 months payback periods [11].
2.2.1. Variation in Precipitation Patterns
Climate change and its influence on precipitation patterns in Africa is widely reported [99–102]. Of interest to water supply is the future projections of the spatio-temporal distribution of rainfall, which would influence the balance between water supply and demand, and consequently, the energy requirement to abstract, transfer, or lift the water. Several studies project prolonged drought and reduced groundwater recharge rates of about 30–70% in the northern and southern regions, compared to the increased precipitation and groundwater recharge in the eastern, western, and central part of Africa under the high-emission and low-emission climate change scenarios [100,101]. In addition, increased flooding events are projected along the Niger delta and the Blue Nile by an over 10% increase in high flows under the global climate low-emission scenarios of 2 °C [101]. It is further noted that the effects of climate change are likely to be more severe, especially in Sub-Saharan Africa due to low adaptive capacities [101,102]. Water utilities in areas facing more frequent severe droughts have to adjust their production to cope with the growing demand by seeking alternative water sources such as sea water desalination and mine-water reclamation, often with huge energy intensities [25]. Furthermore, longer pumping hours, and hence higher energy demand, may be required to meet the increased water demand during drought periods. Therefore, more investment is required to increase water harvesting and storage capacity to meet the growing demand.
2.2.2. Water Losses within the Systems
Water loss within the water supply network is categorized as either physical losses through leakages in the storage and pipe network or real losses that occur through incorrect customer meter billing, vandalism, or any unauthorized consumption [103]. These losses pose one of the greatest challenges of water supply sustainability, both in hindering expansion of supply to the unserved areas, thus weakening the utilities operational efficiency. As reported in [64,66], large utilities, serving more than 1 million persons, tend to report higher non-revenue losses, since in most cases their infrastructure is quite old, with frequent bursts and leakages where energy is lost too. Based on the data submitted to IBNET, non-revenue water losses in participating utilities in Africa were reported as a percentage of billed water and as volume lost per kilometer of connection. The percentage non-revenue water ranged on average from 54% in Gabon and to about 20% in Burkina Faso, with the continent’s lowest non-revenue water losses as in Figure 3. However, values as high as 72% have been reported in Nigeria. Additionally, non-revenue water loss reported as volume lost per km of connection per day in 2018/2019, ranged from 73 m3/km/day in Nigeria, 61 m3/km/day in Zambia, 4.7 in Burkina Faso, and 10 m3/km/day in Lesotho.
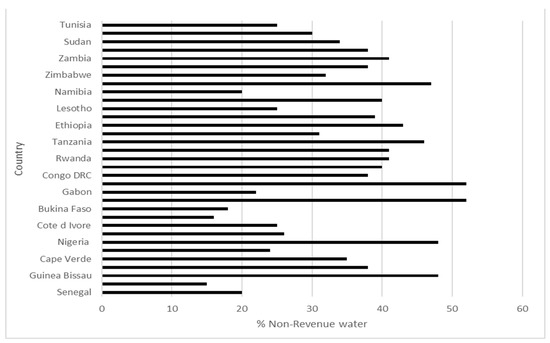
Figure 3. Levels of % non-revenue water (NRW) for selected countries in Sub-Saharan Africa. Data obtained from [98].
2.2.3. Nature and Type of Pumps and Motors
The nature of pumps and the associated pipe network largely determines the energy demand and energy and water losses within the system. In addition, these are the highest consumers of energy within the water supply networks, accounting for over 90% of the total water utilities energy consumption, but also present the utilities’ greatest energy-saving potential [11,83]. Pumping accounts for about 30% of the total energy consumption for groundwater extraction, and about 80% of the clean water transmission and distribution; hence, their operational efficiency is crucial in energy savings and reducing water losses through leakages [11]. The amount of energy consumed is highly dependent on the nature, age, and pump running hours and the maintenance schedules, but poor sizing and installation, as well as high variability in pressure and head losses, can greatly increase the energy consumption due to increased inefficiencies. In an unpublished study carried out by the authors in water utilities in Kenya, most utilities have not invested much in improving or optimizing their energy efficiency. Similarly, most utilities had no separate metering and billing of individual pumping station and none of the utilities under study had an energy management plan, although strategic plans to explore renewable energy sources were mentioned. Separation of energy consumption by energy-intensive consumers provide valuable disaggregated trends of energy use and efficiency crucial for the detection of inefficiencies responsible for energy losses and establishment of maintenance schedules.
2.2.4. Water Source and Water Quality
Different raw water sources require varying amount of energy to abstract, treat, transmit, and distribute clean water. As already outlined in [22], groundwater extraction accounts for about 31% of total direct energy compared to surface water. Furthermore, surface water supply systems have a higher indirect energy requirement due to higher amounts of chemicals required to treat the water. The type and quality of raw water entering a water treatment system influences inputs such as energy and treatment chemicals where in a typical conventional water treatment that employs coagulation/flocculation and uses filters, the energy intensity is largely influenced by the concentration of the total suspended solids and the nature of the filters [107]. Furthermore, land-use activities, population density in the catchment areas, and possible effects of climate change influences the quality of water from the catchment areas. The concentration of suspended matter, total organic carbon, and water conductivity, which are highly influenced by seasonality, have been identified as water quality parameters that contribute to a high energy intensity in the water treatment system [17]
This entry is adapted from the peer-reviewed paper 10.3390/w12092560