Your browser does not fully support modern features. Please upgrade for a smoother experience.
Please note this is an old version of this entry, which may differ significantly from the current revision.
Subjects:
Physics, Atomic, Molecular & Chemical
|
Optics
Polarization-based optical measurement methods are very useful in the analysis of the molecular orientations of materials, and, thus, these methods are implemented in numerous material-science studies, including into the characterization of SAPA micro- and nanostructures.
- peptides and amino acids
- optical polarization
- Raman spectroscopy
- waveguide
- imaging
- birefringence
1. Polarized Raman Spectroscopy
Raman spectroscopy [43] is a non-destructive, label-free light-scattering technique that is used to probe light–matter interactions. Specifically, Raman spectroscopy (that relies on inelastic light scattering), is used to analyze the vibrational and rotational molecular modes of a material by monitoring perturbations in the molecular polarizability caused by incident (laser) light [43]. When a polarized laser light is used, information about the molecular orientation can be obtained, and the technique is known as Polarized Raman Spectroscopy [44]. Polarized Raman spectra allow for the extraction of information on the molecular conformation of materials, since the Raman scattering intensity depends on the molecular polarizability tensor [45]. In the following paragraphs, examples of the implementation of polarized Raman spectroscopy for the study of the molecular conformations of SAPA micro- and nanostructures are given.
Notingher et al. derived the molecular orientation in the dipeptide L-diphenylalanine (FF) self-assembled nanotubes by applying polarized Raman spectroscopy [46]. As is evident from their findings (presented in Figure 2a), the 1002 cm−1 (phenyl group) and the 1686 cm−1 (C=O) band exhibited stronger intensities in ZZ rather than in XX configurations (the Z-axis was selected as the direction along the FF nanotubes), while the Raman band at 1249 cm−1 (C-N) exhibited maximum intensity in the crossed configuration, XX. As such, the authors concluded that the C=O side chains have parallel alignment with the nanotube axis, and that the C-N backbone vibrations are aligned perpendicular to the nanotube axis.
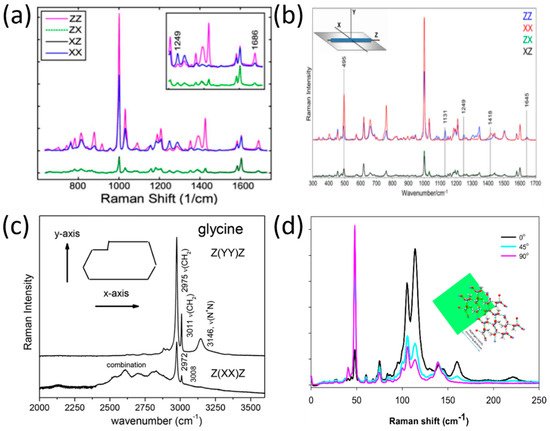
Figure 2. Polarized Raman spectra in peptides and amino acids. (a) Raman spectra of L-diphenylalanine di-peptide nanotube, reproduced with permission from B. Lekprasert, V. Sedman, C. J. Roberts, S. J. B. Tedler, I. Notingher, Opt. Lett. 35, 4193–4195 (2010) © The Optical Society [46]. (b) Raman spectra of di-D-phenylalanine nanotubes [47], reproduced with permission from Igor K. Lednev, Rajesh R. Naik, Milana C. Vasudev, et al., J. of Raman Spect., published by John Wiley and Sons, 2016. (c) Polarized Raman spectra of α-form glycine for two scattering geometries [48], reproduced with permission from Paulo T.C. Freire, Felipe M. Barboza, José A. Lima, Francisco E.A. Melo and Josué Mendes Filho, IntechOpen, 2017. (d) Polarized Raman spectra of the L-alanine single crystal from the (101) plane in three-beam polarization directions: zero (black), 45 (cyan), and 90 (pink) degrees. The inset shows hydrogen bonds’ simulation relative to the (101) plane [49], reproduced with permission from Nemtsov, I.; Aviv, H.; Mastai, Y.; Tischler, Y.R., Crystals, published by MDPI, 2019.
In a later study by Lednev et al., [47], the researchers used polarized Raman spectroscopy at a larger spectral range (300–1800 cm−1) to determine the orientation of di-D-phenylalanine (D-FF) molecules within a nanotube. As evident from Figure 2b, there are differences in several band intensities (1418 cm−1, 1131 cm−1, 495 cm−1) in the XX and ZZ polarizations. The application of polarized Raman spectroscopy allowed the authors of this study to determine the cylindrical symmetry of the nanotube, the orientation of the NH3+ rocking mode, and the orientation of the COO− group in relation to the nanotube axis.
However, not only was the molecular orientation of peptide structures deduced by polarized Raman spectroscopy, but also the amino acid structures. For example, polarized Raman spectra of the amino acid (α-form) glycine [48] were recorded by Filho et al. for two scattering geometries, as seen in Figure 2c. The implementation of polarized Raman spectroscopy allowed stretching modes that are specific to the glycine polymorphic form to be revealed; these cannot be differentiated without using a polarization technique.
In another study [49], Tischler et al. used low-frequency polarized Raman spectroscopy in order to reveal the molecular orientation of a single organic microcrystal made of the amino acid L-alanine. The Raman spectra at the polarization directions 0°, 45°, and 90° are shown in Figure 2d, relative to the (101) plane. The conclusion from the Raman spectra presented in Figure 2d is that the polarization direction has a major effect on the distribution of photons in both spectral regions of the hydrogen bond stretching modes (parallel beam direction) and shear modes (perpendicular beam direction). These findings allowed the authors to construct a simulation of the hydrogen bond’s network within the single microcrystal.
2. Polarized Imaging and Birefringence Monitoring
Another optical polarization-based measurement method that is used for studying peptides’ and amino acids’ micro- and nanostructures is polarized optical microscopy (POM) [50,51]. Depending on the setup and components, one can obtain quantitative information with respect to the SAPA architectures (such as the 16 elements of a Mueller matrix [52], retardation, refractive index, thickness, and birefringence [50]) and also polarization imaging information.
Simple POM is based on the common brightfield microscope with additional components [50,52]. The additional components usually include a (rotatable) PSG (used to polarize the incident light), strain-free microscope objectives (used to reduce unwanted birefringence of the objective’s lens), and an analyzer that is rotated at 90° with respect to the polarizer (a polarizer is an optical element that generates a specific type of polarized light (linear, circular, or elliptical) [38]. The analyzer (also known as a PSA or polarization state detector—PSD) is just another polarizer placed after the specimen.
A further component that can be added to a POM setup is a compensator (also known as a retarder). A retarder is an optical device that creates a phase shift between two orthogonal components of polarized light. If the retarder is a quarter-wave plate, circular polarization is produced by the linear polarization.
The PSA component can be replaced by a polarization camera that is composed of a complementary metal-oxide semiconductor (CMOS) or a charge-coupled device (CCD) sensor and a grid of polarizer arrays arranged at the 0°, 45°, −45°, and 90° transmission axes. A major advantage of using a polarization camera as a PSA is that it allows the easy and rapid extraction of the intensity, azimuth of linear polarization (AoLP), and degree of linear polarization (DoLP). From these triplet parameters, the 12 linear elements of the Mueller matrix that characterize the specimen can be deduced [53]. In the following paragraphs, some examples of the use of POM and a polarization camera to study amino acids and peptides are given.
In the study of amino acids, a polarization camera was deployed by Ellis et al. [54] in order to determine the L- and D- enantiomeric abundances of the Serine (Ser, S) and phenylalanine (Phe, F) amino acids. This was performed by computing their optical rotation (which is the rotation angle of a plane-polarized light after passing through a molecule) as a function of concentration. The polarization camera yielded the AoLP, and, from it, the optical rotation was calculated [54]. Note that the AoLP is related to the Stokes vector by

Ellis et al. found a lower bound on the amino acid concentration, above which their optical rotation can be detected [54]. Such method to detect small amounts of amino acids is of great importance, for example, in extra-terrestrial biosignature research [54].
Another amino acid that was studied using POM is Histidine (His, H). Histidine (His, H) is a polar hydrophilic α-amino acid that contains an imidazole side chain and is capable of self-assembly into two polymorph crystal structures—monoclinic (P21) and orthorhombic (P2121P1) [55]. The interaction of linear polarized light with self-assembled Histidine microplates (with an orthorhombic crystal structure) was studied by Handelman et al. using POM that included a polarization camera [56]. Using this setup, the triplet parameters (intensity, DoLP, and AoLP) at the output (camera) plane were extracted as a function of PSG rotation angle. Note that the DoLP is related to the Stokes vector by

Figure 3a shows the DoLP, AoLP, and intensity images of several His-microplates at different sizes, thicknesses, and orientations at five PSG angles (−87°, −45°, 0°, 45°, 87°). The different colors of the His-microplates that are seen in the DoLP and AoLP images result from the different thicknesses and orientations of the His-microplates. Further, in that study [56], the birefringence of the His-microplates was extracted by elimination of the corresponding thickness and orientation values of the His-microplates and by considering their optical symmetry (biaxial) and crystal system (orthorhombic).
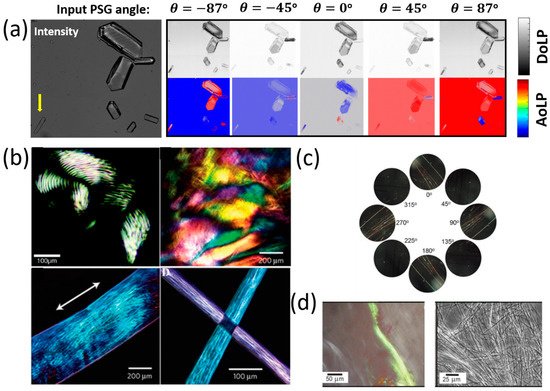
Figure 3. Polarized imaging microscopy of peptides and amino acids. (a) Intensity, DoLP, and AoLP images of seven different Histidine microstructures as a function of input PSG angle [56], reproduced with permission from A. Handelman, et al., Adv. Func. Mat, published by John Wiley & Sons, 2020. (b) Polarized light microscopy images of peptide amphiphile (PA) gels: (top-row, left) PA gel, formed by short anisotropic domains; (top-row, right) PA gel film, formed by noodle-like gels; (bottom-row, left) one noodle-like PA gel string shows aligned monodomain (bottom-row, right); light extinction at cross-points of two PA gel strings shows uniform alignment in each string [34], reproduced with permission from Rashad Mammadov, Ayse B. Tekinay, Aykutlu Dana, Mustafa O. Gule., Micron, published by Elsevier, 2012. (c) Cross-polarized microscopy images of diphenylalanine (FF) microstructures assembly at different angles after one cryogenic treatment [58], reproduced with permission from Junbai Li, Pengli Zhu, Wei Cui, et al., Angewandte Chemie International Edition, published by John Wiley & Sons, 2017. (d) Birefringence observed by polarized optical microscopy upon staining fibrillar superstructure of peptide amphiphile with Congo red [59], reproduced with permission from I. W. Hamley, Chem. Commun., published by RSC, 2015.
Besides amino acids, self-assembled peptide microstructures were also investigated by POM methods [34] (Figure 3b). For example, Stupp et al. [57] developed a method (based on thermal treatment) for the fabrication of long arrays of aligned peptide nanofibers bundles. In order to evaluate their method, Stupp et al. used POM in order to image the birefringence of these peptide amphiphile gel nanofibers. It was shown that the fabrication using thermal treating presented in [57] yields macroscopic birefringent domains of the order of tenths of millimeters.
POM was also used to image the birefringence of SAPA micro- and nanostructures. For example, Li et al. [58] developed a cryogenic-treatment-based technique to control the self-assembly of dipeptide diphenylalanine (FF) microstructures (Figure 3c). Using POM, Li et al. found that birefringence was strong and angle-dependent after the cryogenic treatment, which proved the feasibility of their method to form well-ordered, chiral crystalline dipeptide fibers from their organogel phase.
Some works use POM to image peptide-fibrils that were stained with organic dyes (such as Congo red) in order to detect amyloid formation by imaging the peptides’ birefringence. Such works are, for example, [59,60], where (in [59]) birefringence was detected in stained lipopeptides fibrils (Figure 3d), and (in [60]) birefringence was imaged in stained (N-fluorenylmethoxycarbonyl) Fmoc-RGD peptide hydrogels.
POM was also used to monitor the birefringence of peptides as a function of time and temperature. This monitoring allows for the examination of the effect of external conditions on the self-assembly process of the peptides’ micro- and nanostructures.
In addition to the temperature-dependent birefringence discussed above, time-dependent birefringence was measured by Yan et al. in other peptide nanostructures (such as Fmoc-FF) in order to track their formation process [62]. The transformation of Fmoc-FF triclinic aggregates to nanofibers and to monoclinic nanobelts was initiated by ultrasound irradiation and monitored by POM imaging.
POM was also used to monitor the transformations of disordered peptide structures into highly ordered crystalline structures. Zhang et al. introduced a method (based on the differential evaporation rates of peptide solution) of uniformly aligning naphthalene-FF (Nap-FF) peptide nanofibrils [63]. POM was used in this work to track the orientation transition of these nanofibers in real time.
The examples mentioned in this section show that POM has been used to monitor the self-assembly of peptide nanostructures, derive the birefringence of SAPA microstructures, track changes in the secondary structures of peptides, and verify the feasibility of various peptide structures’ fabrication processes.
4. Polarization and Fluorescence
Fluorescence is the emission of light as a result of molecular excitation by light absorption [64]. If the excited light is polarized, the absorption of the fluorophore is proportional to 
 is the angle between the electric field vector of the excited light and the absorption transition moment vector. This means that when
  = 90°, i.e., the polarized electric field vector is oriented at 90° in relation to the orientation of the transition dipole moment of the molecules [65], then the probability of excitation will be minimal. When the polarized electric field vector is aligned (i.e., parallel) with the transition dipole moment of the molecules, then the probability of excitation will be maximal. As such, polarization-based fluorescence measurement tools can be used to study the molecular organization of fluorophores [64] and the effect of the chemical environment on the fluorophore.
Common polarization-based fluorescence measurement methods include Fluorescence Polarization Microscopy (FPM), Muller Fluorescence Spectroscopy (MFS), and Circularly Polarized Luminescence (CPL) Spectroscopy. These instruments are widely used in life-science applications [65], for example, for the study of protein structures [66,67] and disease diagnostics [68]. FPM and MFS measurements can also be used in cases where fluorescent dyes (such as Thioflavine-T and Congo Red) are incorporated with non-fluorescent molecules [69]. In the following paragraphs, some recent examples of the use of these instruments for the characterization of SAPA micro- and nanostructures are provided.
Haldar et al. used MFS to probe the anisotropic molecular organization and orientation of Boc-Xaa-Met-OMe (Xaa = Val/Leu) peptide nanotubes painted by the organic dye 2,3,6,7-tetrabromonaphthalene diimide (TB-NDI) [70]. The full 4 × 4 fluorescence spectroscopic Mueller matrix (Figure 5a) was derived, and, by performing inverse analysis, Haldar et al. were able to quantify the fluorescence linear diattenuation, the linear polarizance, and the average fluorescent dipolar orientation angles for the ground and excited molecular states [70]. Eventually, these parameters were used to determine the molecular angular distribution function and the molecular orientational order.
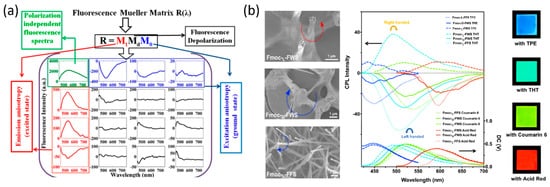
Figure 5. (a) 4 × 4 fluorescence spectroscopic Mueller matrix of painted peptides nanotube [70], reproduced with permission from Krishnendu Maji, Sudipta Saha, Rajib Dey, et al., J. Phys. Chem. C, published by ACS, 2017. (b) Co-assembly of the Fmoc-tripeptides with the various achiral fluorescent molecules and their CPL spectra [71], reproduced with permission from Qing Li, Jiaxing Zhang, Yuefei Wang, et al., Nano Letters, published by ACS, 2021.
He et al. developed a method of generating CPL with inverted handedness from a Fmoc-tripeptides film [71]. He et al. used a CPL Spectrometer in order to show that, by changing the middle amino acid (Phe and Trp) of Fmoc-tripeptides, and with the addition of achiral fluorescent dyes, CPL emission was observed after the peptides self-assembled into long-range-ordered hierarchical helical arrays (Figure 5b). The generation of CPL from peptide microstructures extends the diversity of optical materials that are able to generate CPL, a feature that is used for bioimaging [72], optical devices [73], and chirality transfer and energy transfer studies [74].
The examples mentioned in this section show that polarization-based fluorescence measurement tools have been used to derive the anisotropic molecular organization of peptides and to test peptides nanostructures CPL capability.
This entry is adapted from the peer-reviewed paper 10.3390/molecules27061802
This entry is offline, you can click here to edit this entry!