Your browser does not fully support modern features. Please upgrade for a smoother experience.
Please note this is an old version of this entry, which may differ significantly from the current revision.
Subjects:
Medical Informatics
The development of reliable predictive models for individual cancer cell lines to identify an optimal cancer drug is a crucial step to accelerate personalized medicine, but vast differences in cancer cell lines and drug characteristics make it quite challenging to develop predictive models that result in high predictive power and explain the similarity of cell lines or drugs.
- drug sensitivity
- optimal mass transport
- network-based clustering
1. Introduction
Recent significant advances in investigating drug sensitivity have been driven by advances in high-throughput technologies that can generate large amounts of biological data at low cost. Pioneers of such datasets include the NCI-60 database [1], Genomics of Drug Sensitivity in Cancer (GDSC) project [2], and Cancer Cell Line Encyclopedia (CCLE) project [3]. Collectively, these databases have demonstrated that pharmacogenomic profiling of cancer cell lines from clinical tumor samples can help guide the development of new cancer therapies [4][5]. The NCI-60 project is one of the first established studies for in vitro drug screening, and has significantly improved the philosophy and research of human cancer drugs [1][6]. This panel has led to many important discoveries, including a general advance in understanding the underlying mechanisms of cancer in response to drugs [7][8]. However, the panel only consists of 60 cell lines, which limits its use for developing reliable predictive models. By contrast, the GDSC database (http://www.cancerRxgene.org, accessed on 9 December 2021), on which researchers focus in this entry, annotates a comprehensive landscape of drug responses of ∼1000 human cancer cell lines for 265 anti-cancer drugs. Importantly, the genomic and transcriptomic profiles of all cancer cell lines employed in GDSC were extensively characterized as a part of the COSMIC cell line project (CCLP, https://cancer.sanger.ac.uk, accessed on 9 December 2021). These resources have the potential to link anti-cancer drug sensitivity to detailed genomic information and facilitate the discovery of relevant molecular biomarkers when coupled with powerful analytical tools to cope with the high-dimensionality and complexity of these datasets.
A variety of approaches have been proposed for investigating drug sensitivity in cancer cell lines. One of the first models was developed by Staunton et al., which employed a weighted voting classification model for anti-cancer drug sensitivity based on NCI-60 gene-expression data [9]. Recent approaches can be grouped either as regression models to predict the concentration required for inhibition, or classification prediction models of drug responses as sensitive vs. resistant [10], or a mathematical modeling approach [11]. Machine learning tools deployed include support vector machines [12], random forests [13], neural networks [14], and logistic ridge regression [15]. For example, Riddick et al. built an ensemble regression model with random forest to predict in vitro drug responses using gene-expression profiles [16].
2. Clustering of Cell Lines and Drugs
Hierarchical clustering of the cell lines resulted in six clusters with the highest average silhouette score. The numbers of cell lines in each cluster were 149, 113, 130, 174, 208, and 141, respectively, labeled clusters 1 through 6. Figure 1 illustrates the results of clustering for 17 major cancer types. As shown in Figure 1, cluster 1 perfectly grouped the liquid cancers of leukemia and lymphoma, including only one solid tumor cell-line. It is well known that liquid tumors respond very differently to anti-cancer drugs compared to solid neoplasms [17]. Interestingly, some clusters, such as cluster 5, consisted of heterogeneous cancer types, perhaps indicating a closer relationship in drug responses. On the other hand, hierarchical clustering of the drugs resulted in 5 clusters. The numbers of drugs in each cluster were 10, 23, 86, 26, and 55, respectively, labeled clusters 1 through 5.
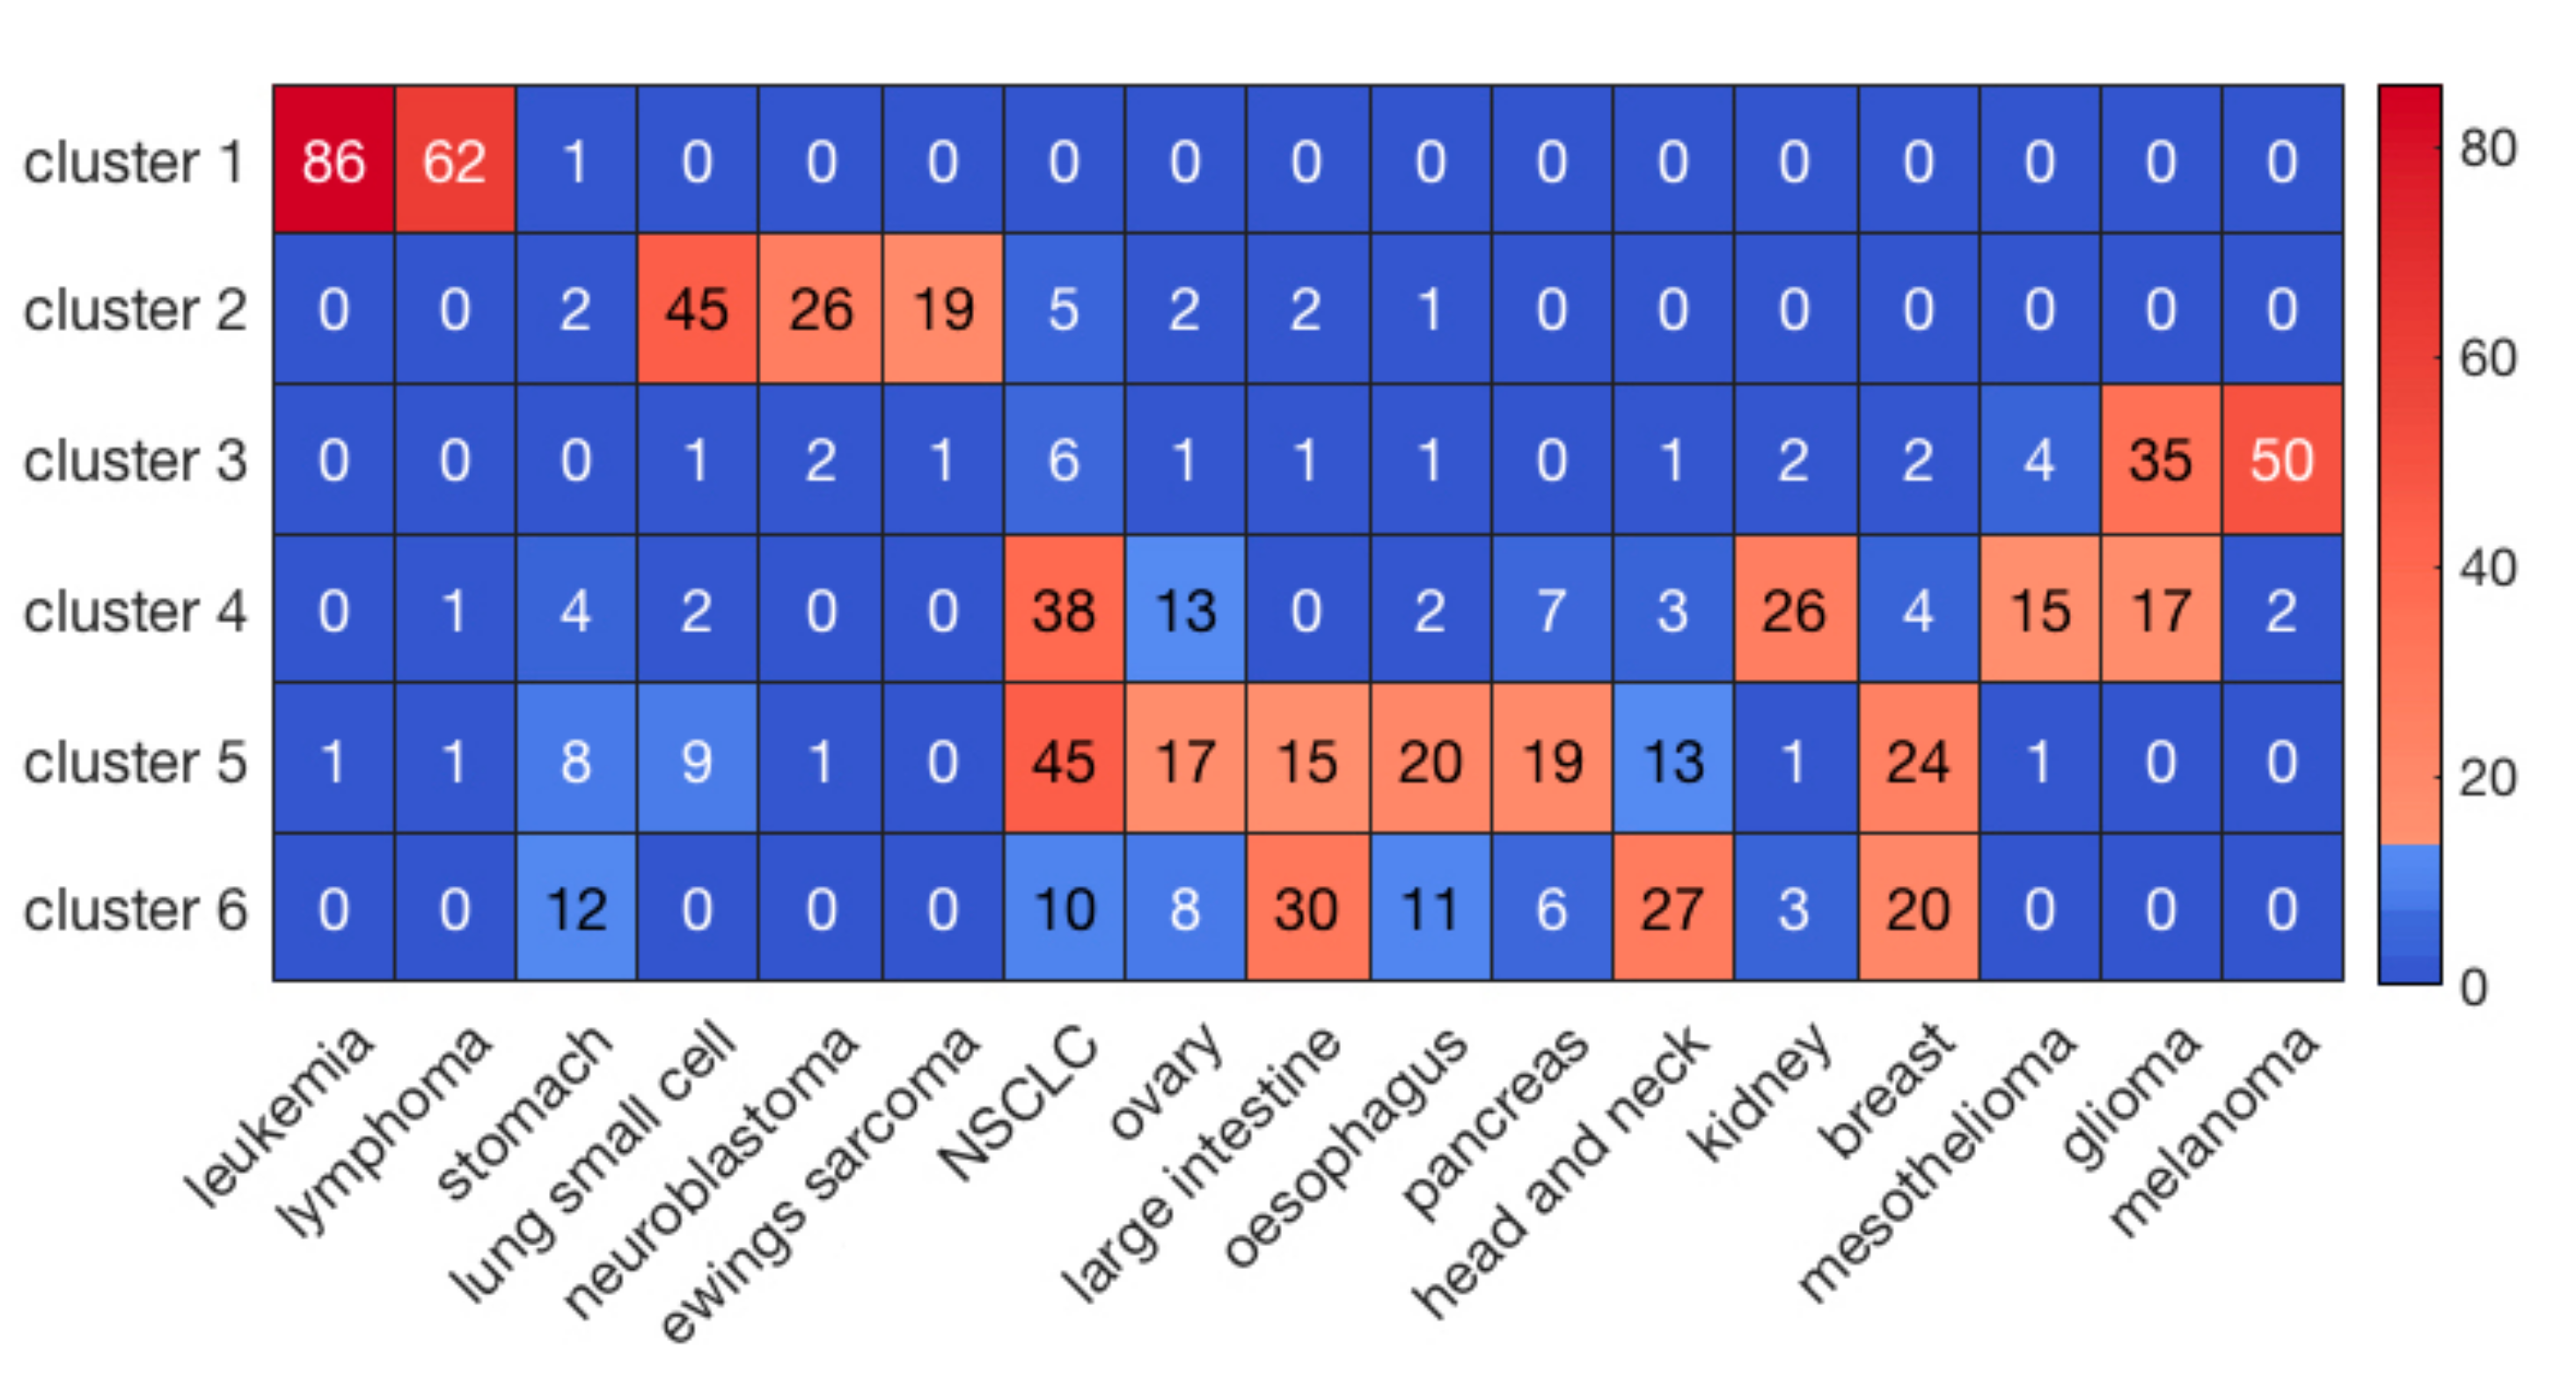
Figure 1. The clustering results of cell lines for the major 17 cancer types. The sidebar indicates the number of cell lines in each element.
3. Prediction of Drug Responses in Paired Cell-Line Drug Clusters
For each of the 30 paired clusters (six clusters for cell lines and five clusters for drugs), random forest regression models were trained and validated, using 635 genes and 165 cheminformatic features. A three-fold cross-validation approach was employed, such that in each cross validation, 2/3 of the data were used for training, and 1/3 of the data were used for validation of the model. After performing the three-fold cross validation in each paired cluster, correlation (R) and coefficient of determination (R2) values were computed for the predicted and observed log(IC50) values. Figure 2 illustrates the distribution of R and R2 of the predicted and observed log(IC50) values in the 30 paired clusters of cell lines and drugs.
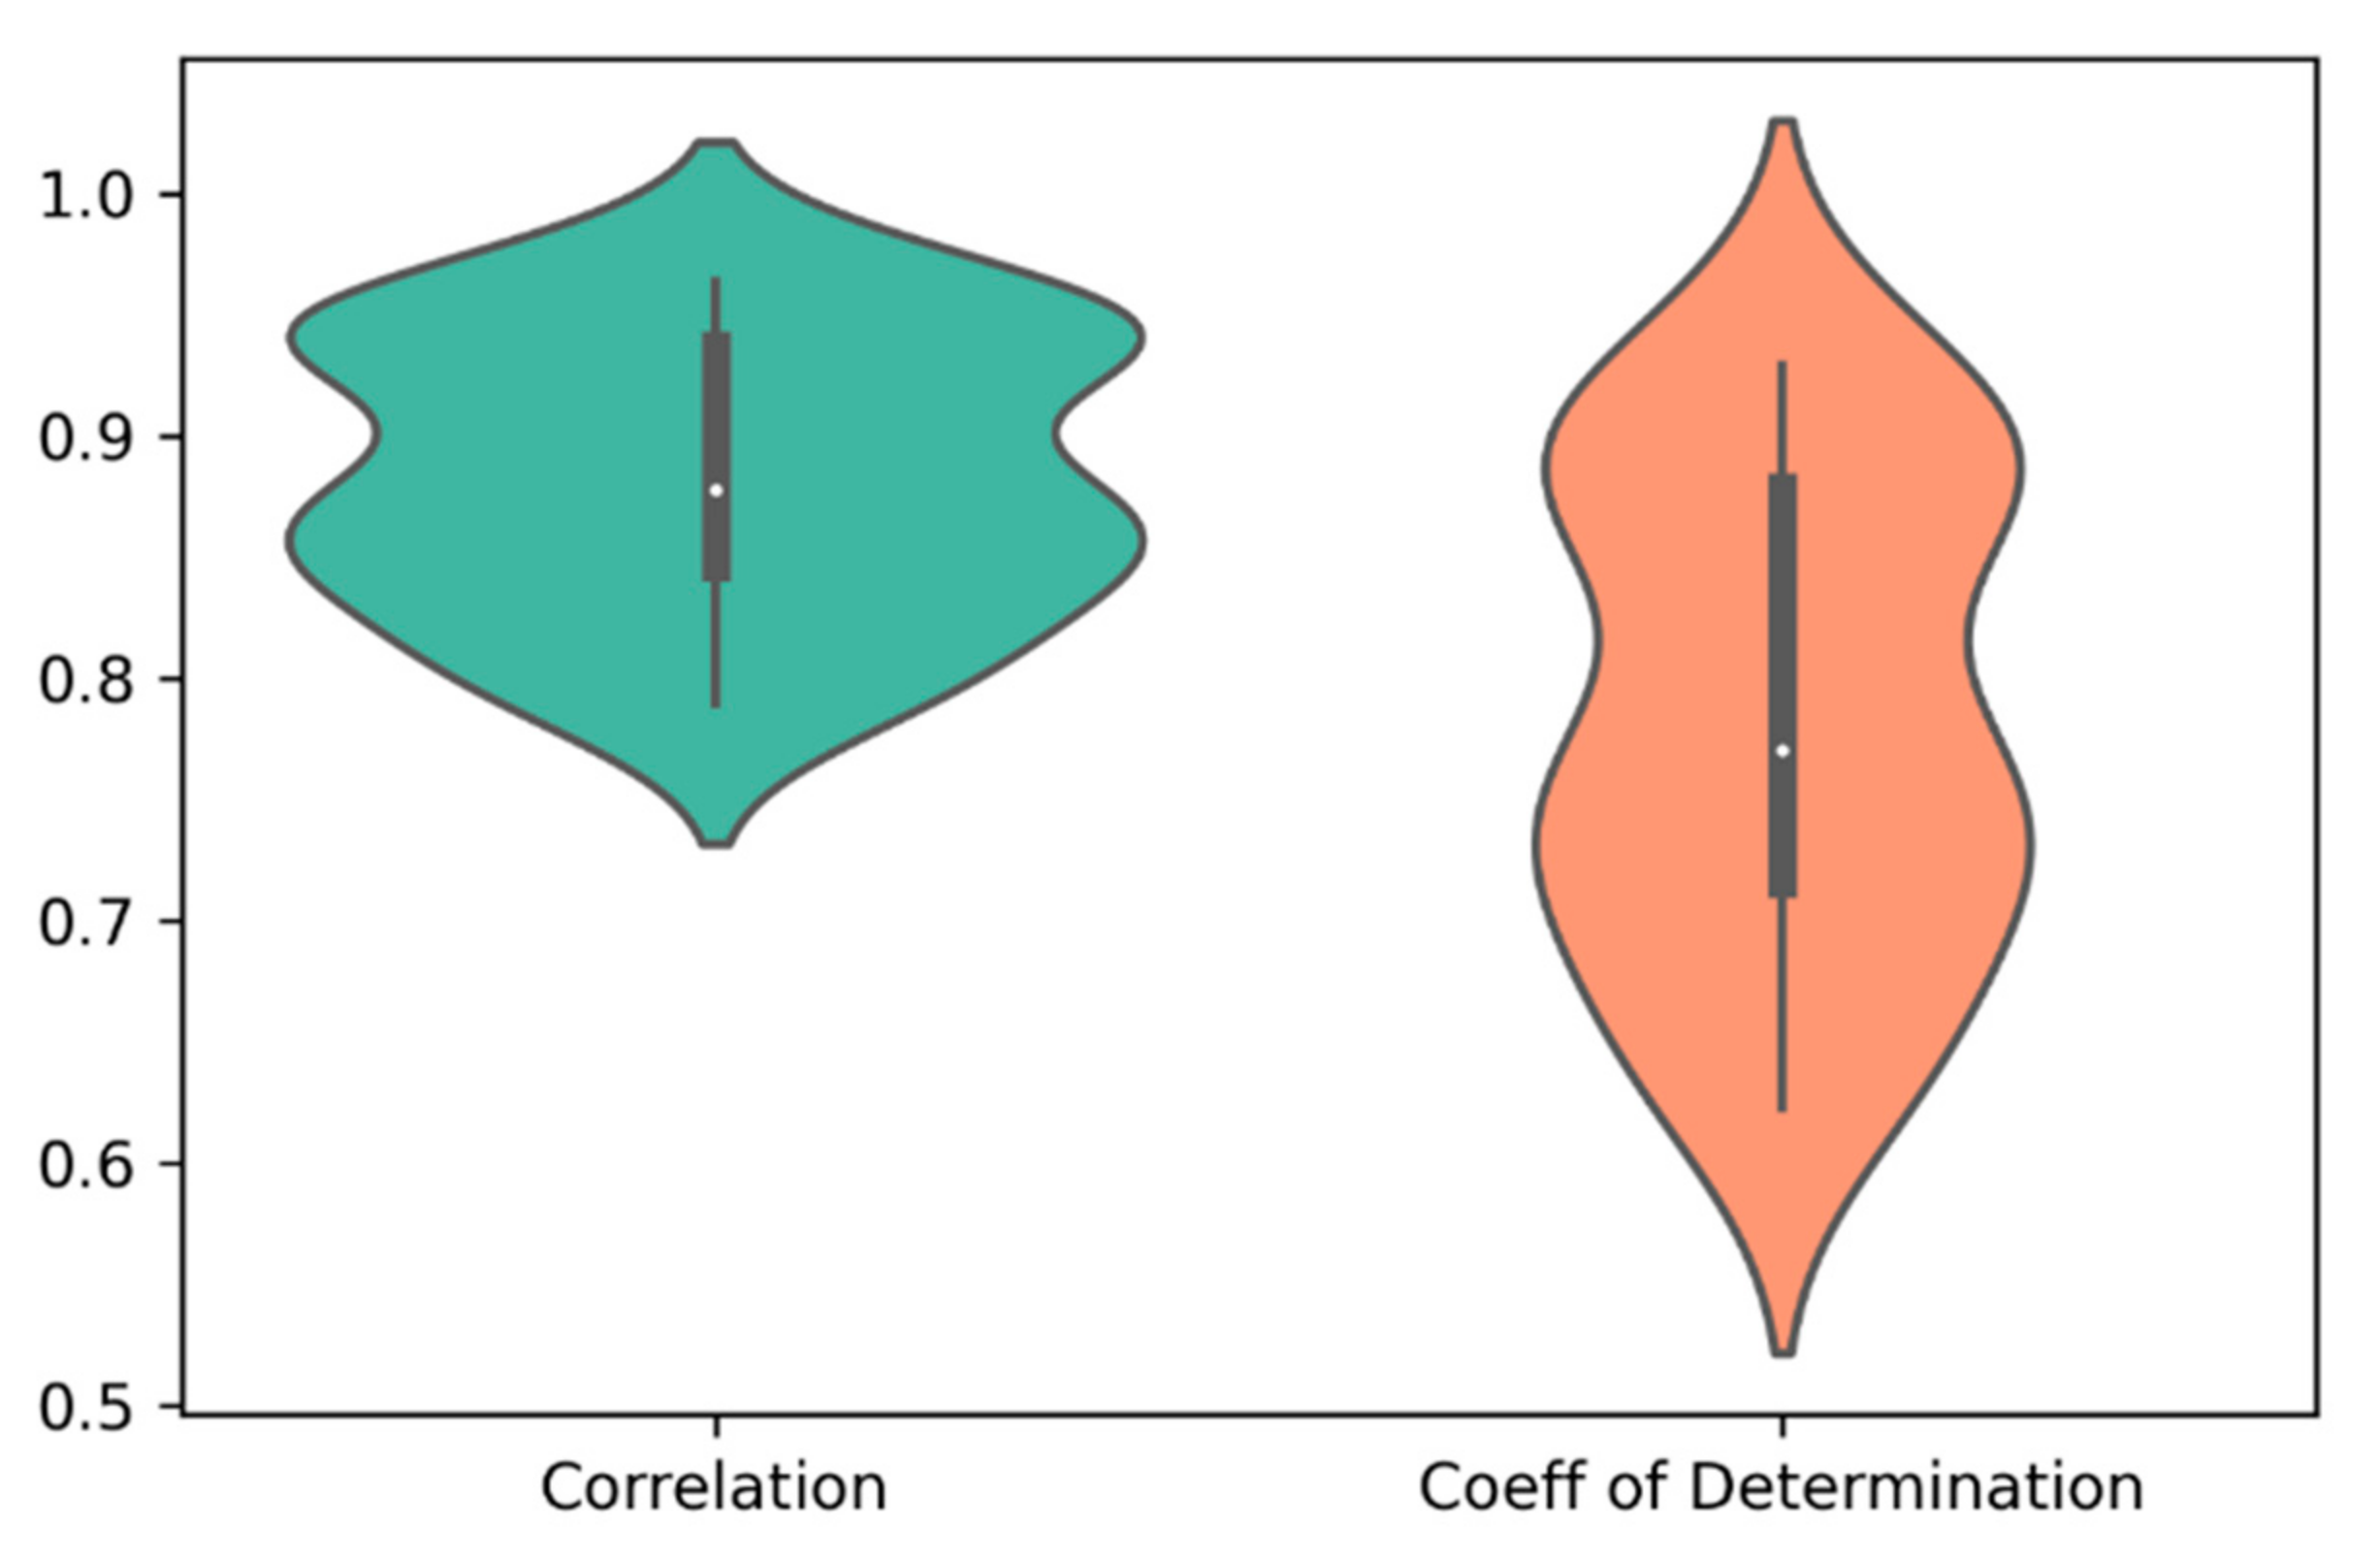
Figure 2. The distribution of correlation (R) and coefficient of determination (R2) of the predicted and observed log(IC50) values in the 30 paired clusters of cell lines and drugs. The average values of R and R2 were 0.88 and 0.78, respectively.
To evaluate the performance of prediction for the whole dataset, researchers concatenated the predicted and observed log(IC50) values for all the 30 clusters and then calculated R and R2 (Table 1). For comparison, they also performed a three-fold cross validation scheme via random forest on the whole dataset without prior clustering. As shown in Table 1, the method using prior clustering of cell lines and drugs resulted in prediction accuracies of R = 0.89 and R2 = 0.79, outperforming the modeling results (R = 0.77 and R2 = 0.60) obtained via random forest on the whole dataset (183,000 cell-line drug pairs) using a three-fold cross validation scheme. Further, R and R2 in the best and worst paired clusters with respect to prediction accuracies were (R = 0.96 and R2 = 0.93) and (R = 0.79 and R2 = 0.62), respectively (Figure 3). The cell-line cluster 3 and drug cluster 1 pair, shown in Figure 4A, achieved the best accuracy. This cluster mainly consisted of glioma and melanoma (Figure 1). In addition, the cell-line drug complex network (CDCN) model coupled with the Wasserstein distance outperformed the model using Pearson correlation.
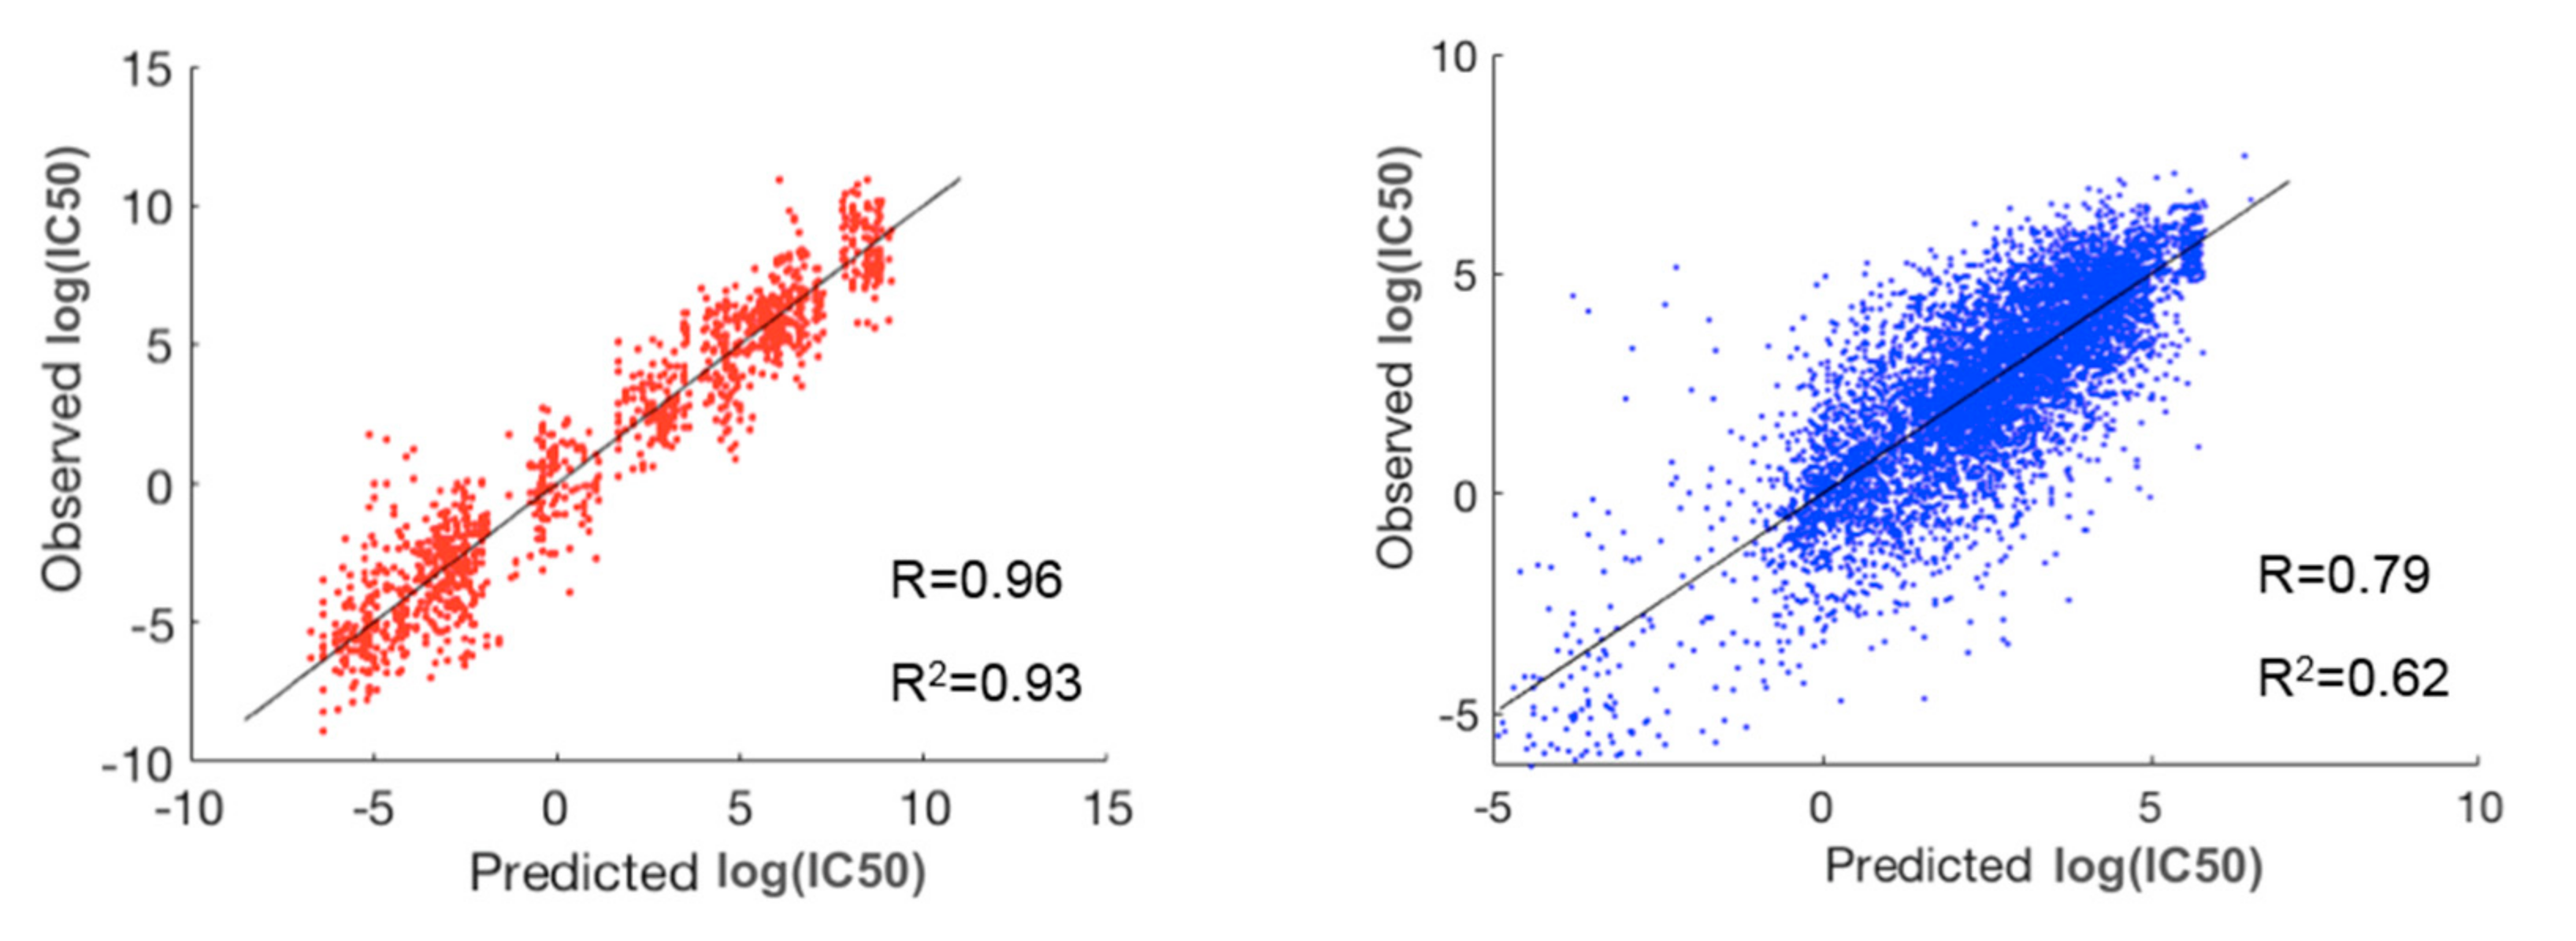
Figure 3. The best (red) and worst (blue) clusters among the 30 paired clusters with respect to prediction accuracy. The best prediction lies in the pair of cell-line cluster 3 (mainly glioma and melanoma) and drug cluster 1. The worst prediction lies in the pair of cell-line cluster 6 (mainly consisting of breast, head and neck, large intestine, and stomach cancers) and drug cluster 5.
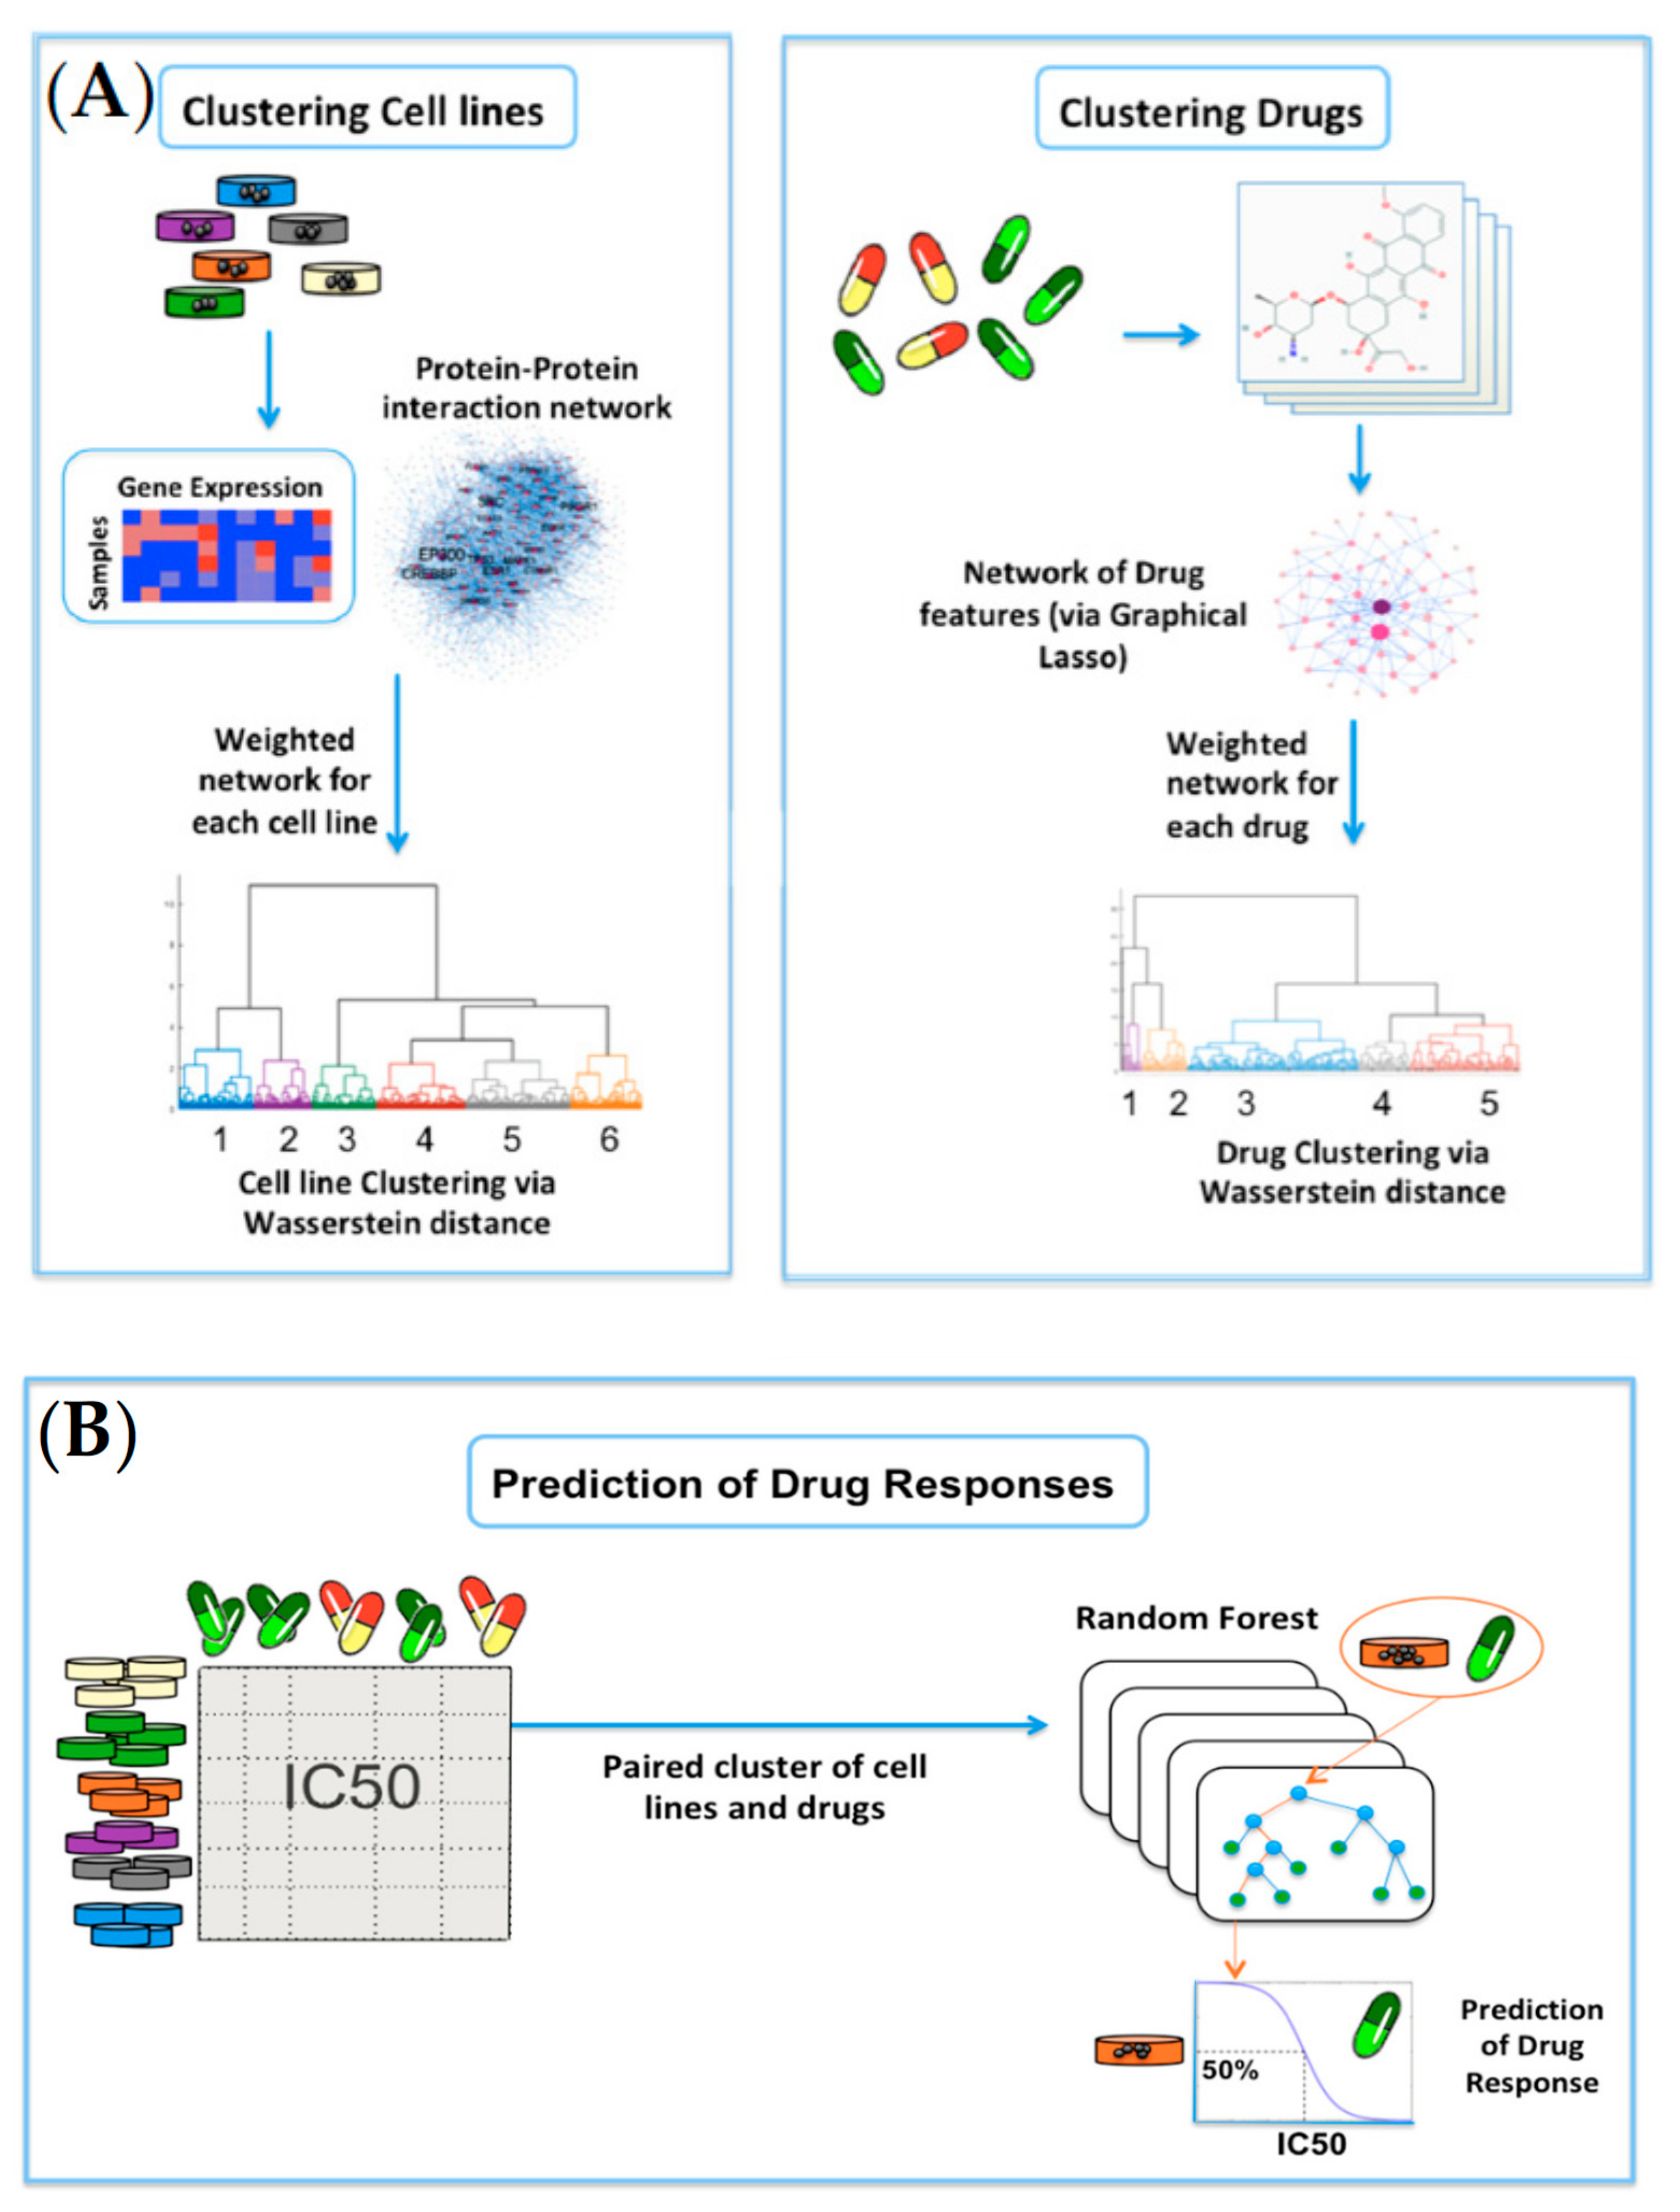
Figure 4. Overview of the network-based clustering and modeling of drug responses: (A) For clustering of cell lines, the gene-expression profiles for 915 cell lines were analyzed on the HPRD network. Invariant measures for individual nodes were then computed, and the Wasserstein distance (EMD) was computed between each pair of cell lines on the network. Lastly, hierarchical clustering was performed on the resultant Wasserstein distance matrix. For clustering of drugs, researchers obtained the cheminformatic features of 200 drugs, and built a data-driven network of cheminformatic features using the graphical LASSO. Similar to cell lines, hierarchical clustering was performed on the resultant Wasserstein distance matrix; (B) A random forest model was built on each paired cluster of cell lines and drugs to predict drug responses in log(IC50) values.
Table 1. Performance comparison of four different models. CDCN: Cell-line drug complex network; WD: Wasserstein distance.
| Models | R | R2 |
|---|---|---|
| a. Random forest using prior WD-based clustering | 0.89 | 0.79 |
| b. CDCN model with WD | 0.86 | 0.59 |
| c. Random forest on the whole data | 0.77 | 0.60 |
| d. CDCN model with Pearson correlation | 0.74 | 0.53 |
After applying the modeling pipeline, researchers investigated the prediction accuracy for individual cell lines and drugs. Figure 5A,B illustrate prediction performance for the cell lines and drugs with the highest prediction accuracy. As shown in Figure 5A, three of the top four cell lines were from head and neck (including thyroid) cancer. Interestingly, three out of the top four drugs target the PI3K/mTOR signaling pathway, and the remaining one targets the related ERK/MAPK signaling pathway [18].
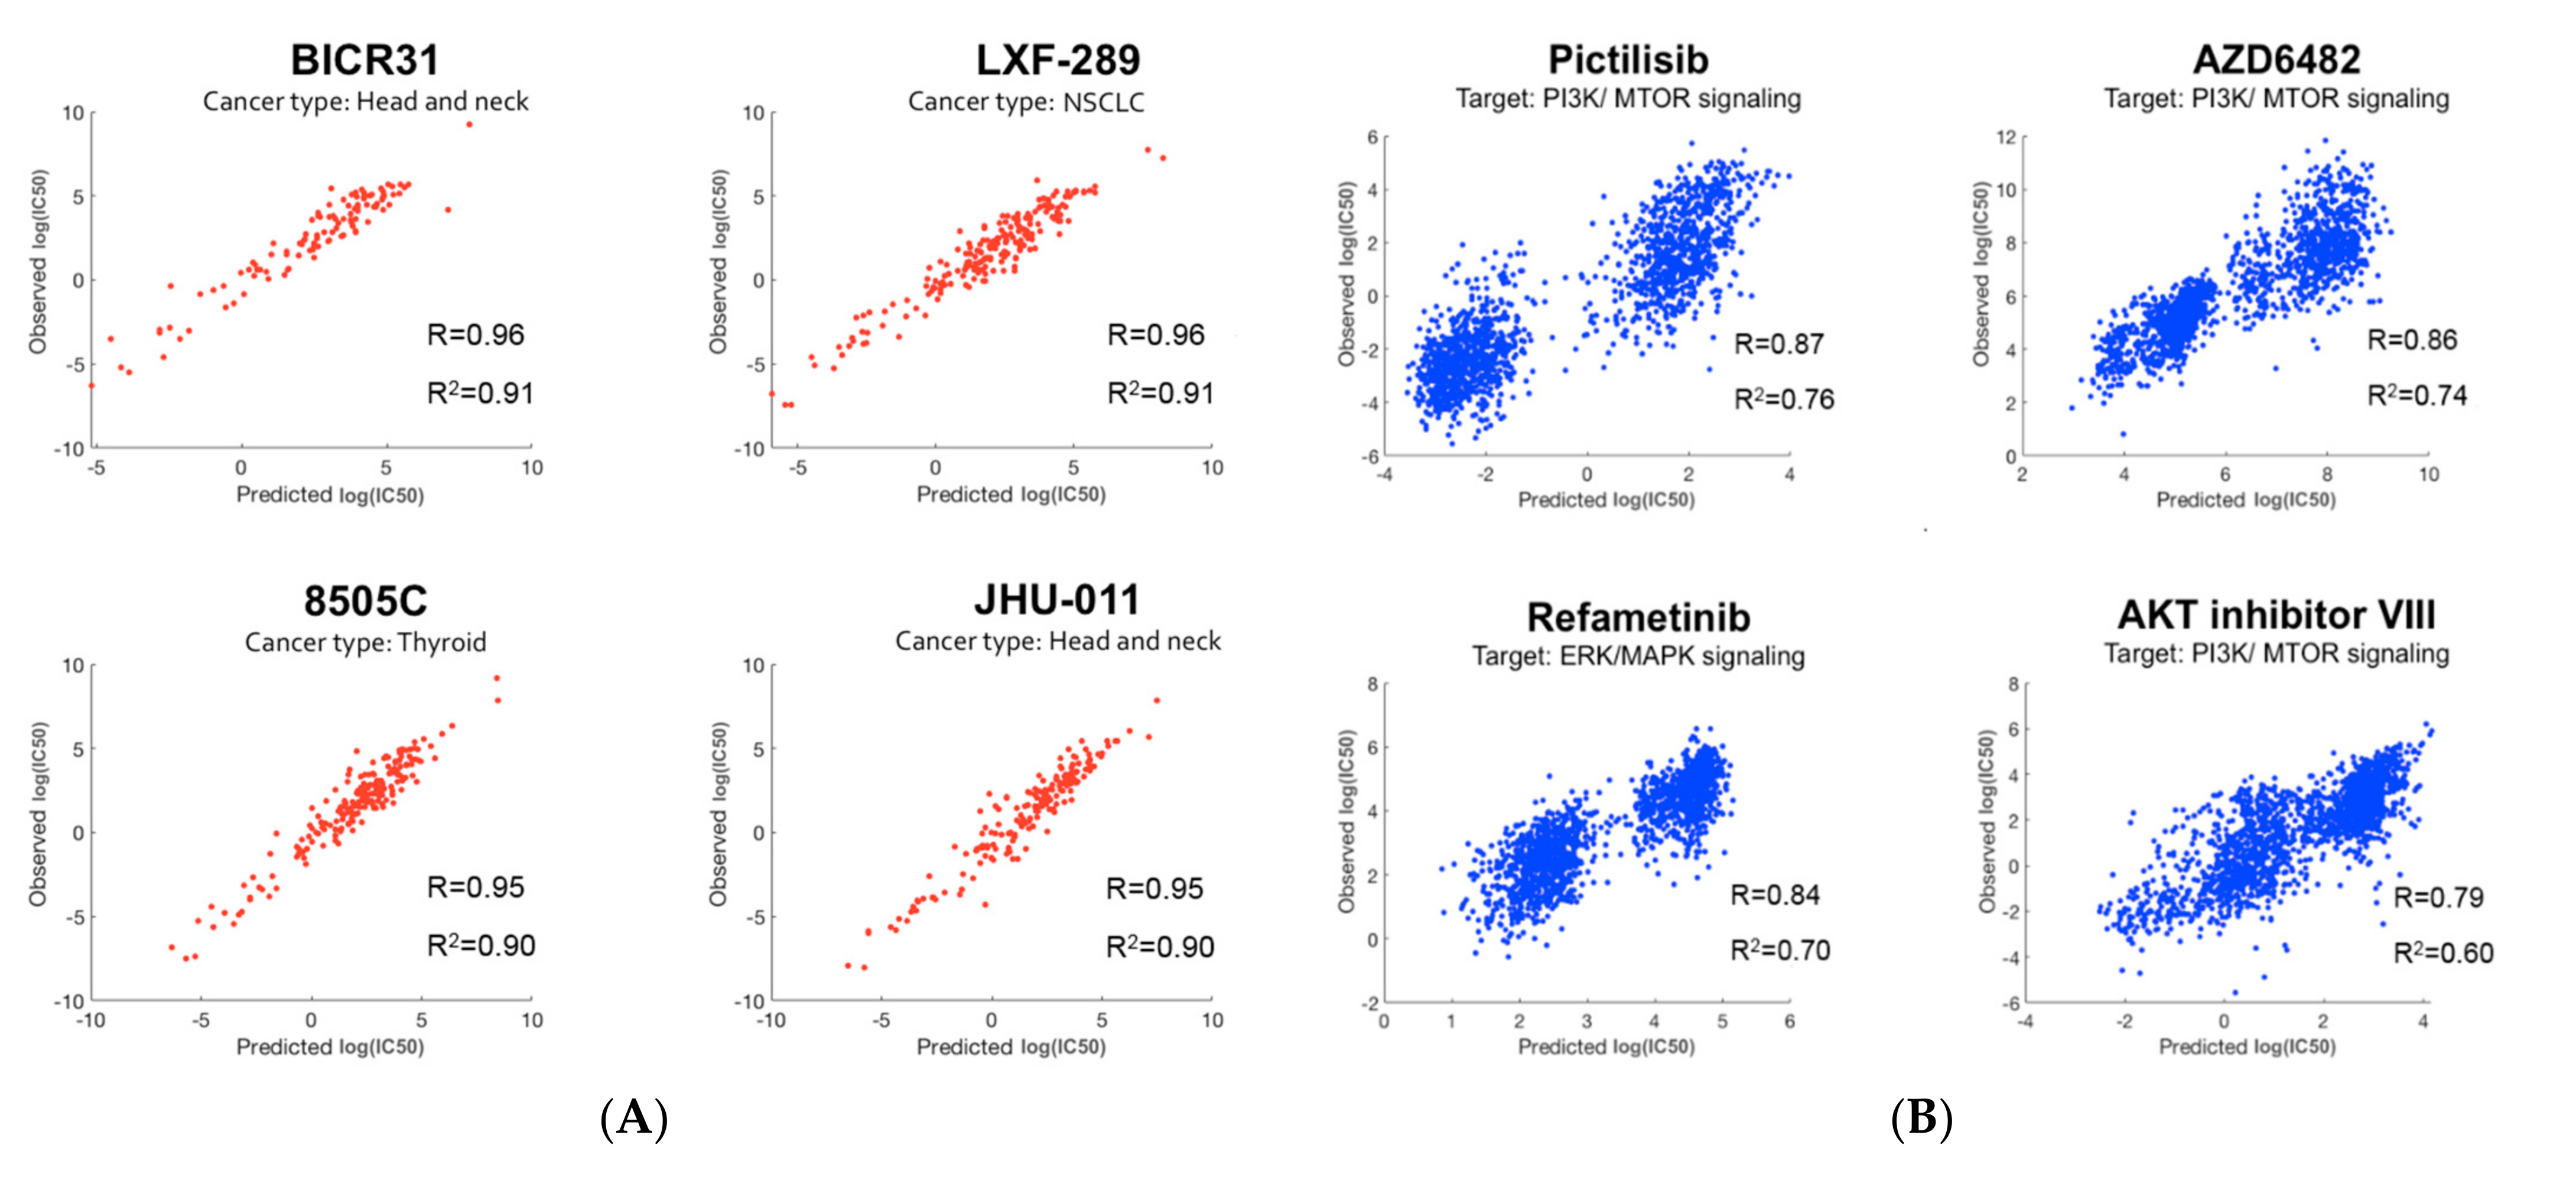
Figure 5. Prediction performance: (A) The top four cell lines with the best prediction performance. Cell-line names along with their cancer types are shown. Three out of the top four cell lines belong to head and neck (including thyroid) cancer; (B) The top four drugs with the best prediction performance. Drug names along with their targeted pathways are shown. Three out of the top four drugs target the PI3K/mTOR signaling pathway.
4. Biological Analysis
To identify significant genes, researchers employed a two-step approach: (1) the importance score for each gene was derived based on its contribution to the random forest accuracy [19] and (2) using a t-test, differentially expressed genes were further identified. For example, researchers investigated a paired cluster: cell-line cluster 4 and drug cluster 1, which is one of the highest performing cluster pairs. Initially, the top 200 genes were selected based on the importance score in random forest modeling, and 70 out of the 200 genes met a Bonferroni corrected p-value < 0.05. For these 70 genes, gene ontology enrichment analysis was performed using MetaCore software to discover significant biological correlates. Table 2 shows the top five biological processes, yielding the related processes of apoptosis and programmed cell death as the top two biological processes, with extremely low false discovery rate (FDR) values of 2.55 × 10⁻²⁰. The hypergeometric distribution was used to compute unadjusted p-values. For further insight, a protein–protein interaction (PPI) network with direct connections among the set of 70 gene products was constructed as shown in Figure 6.
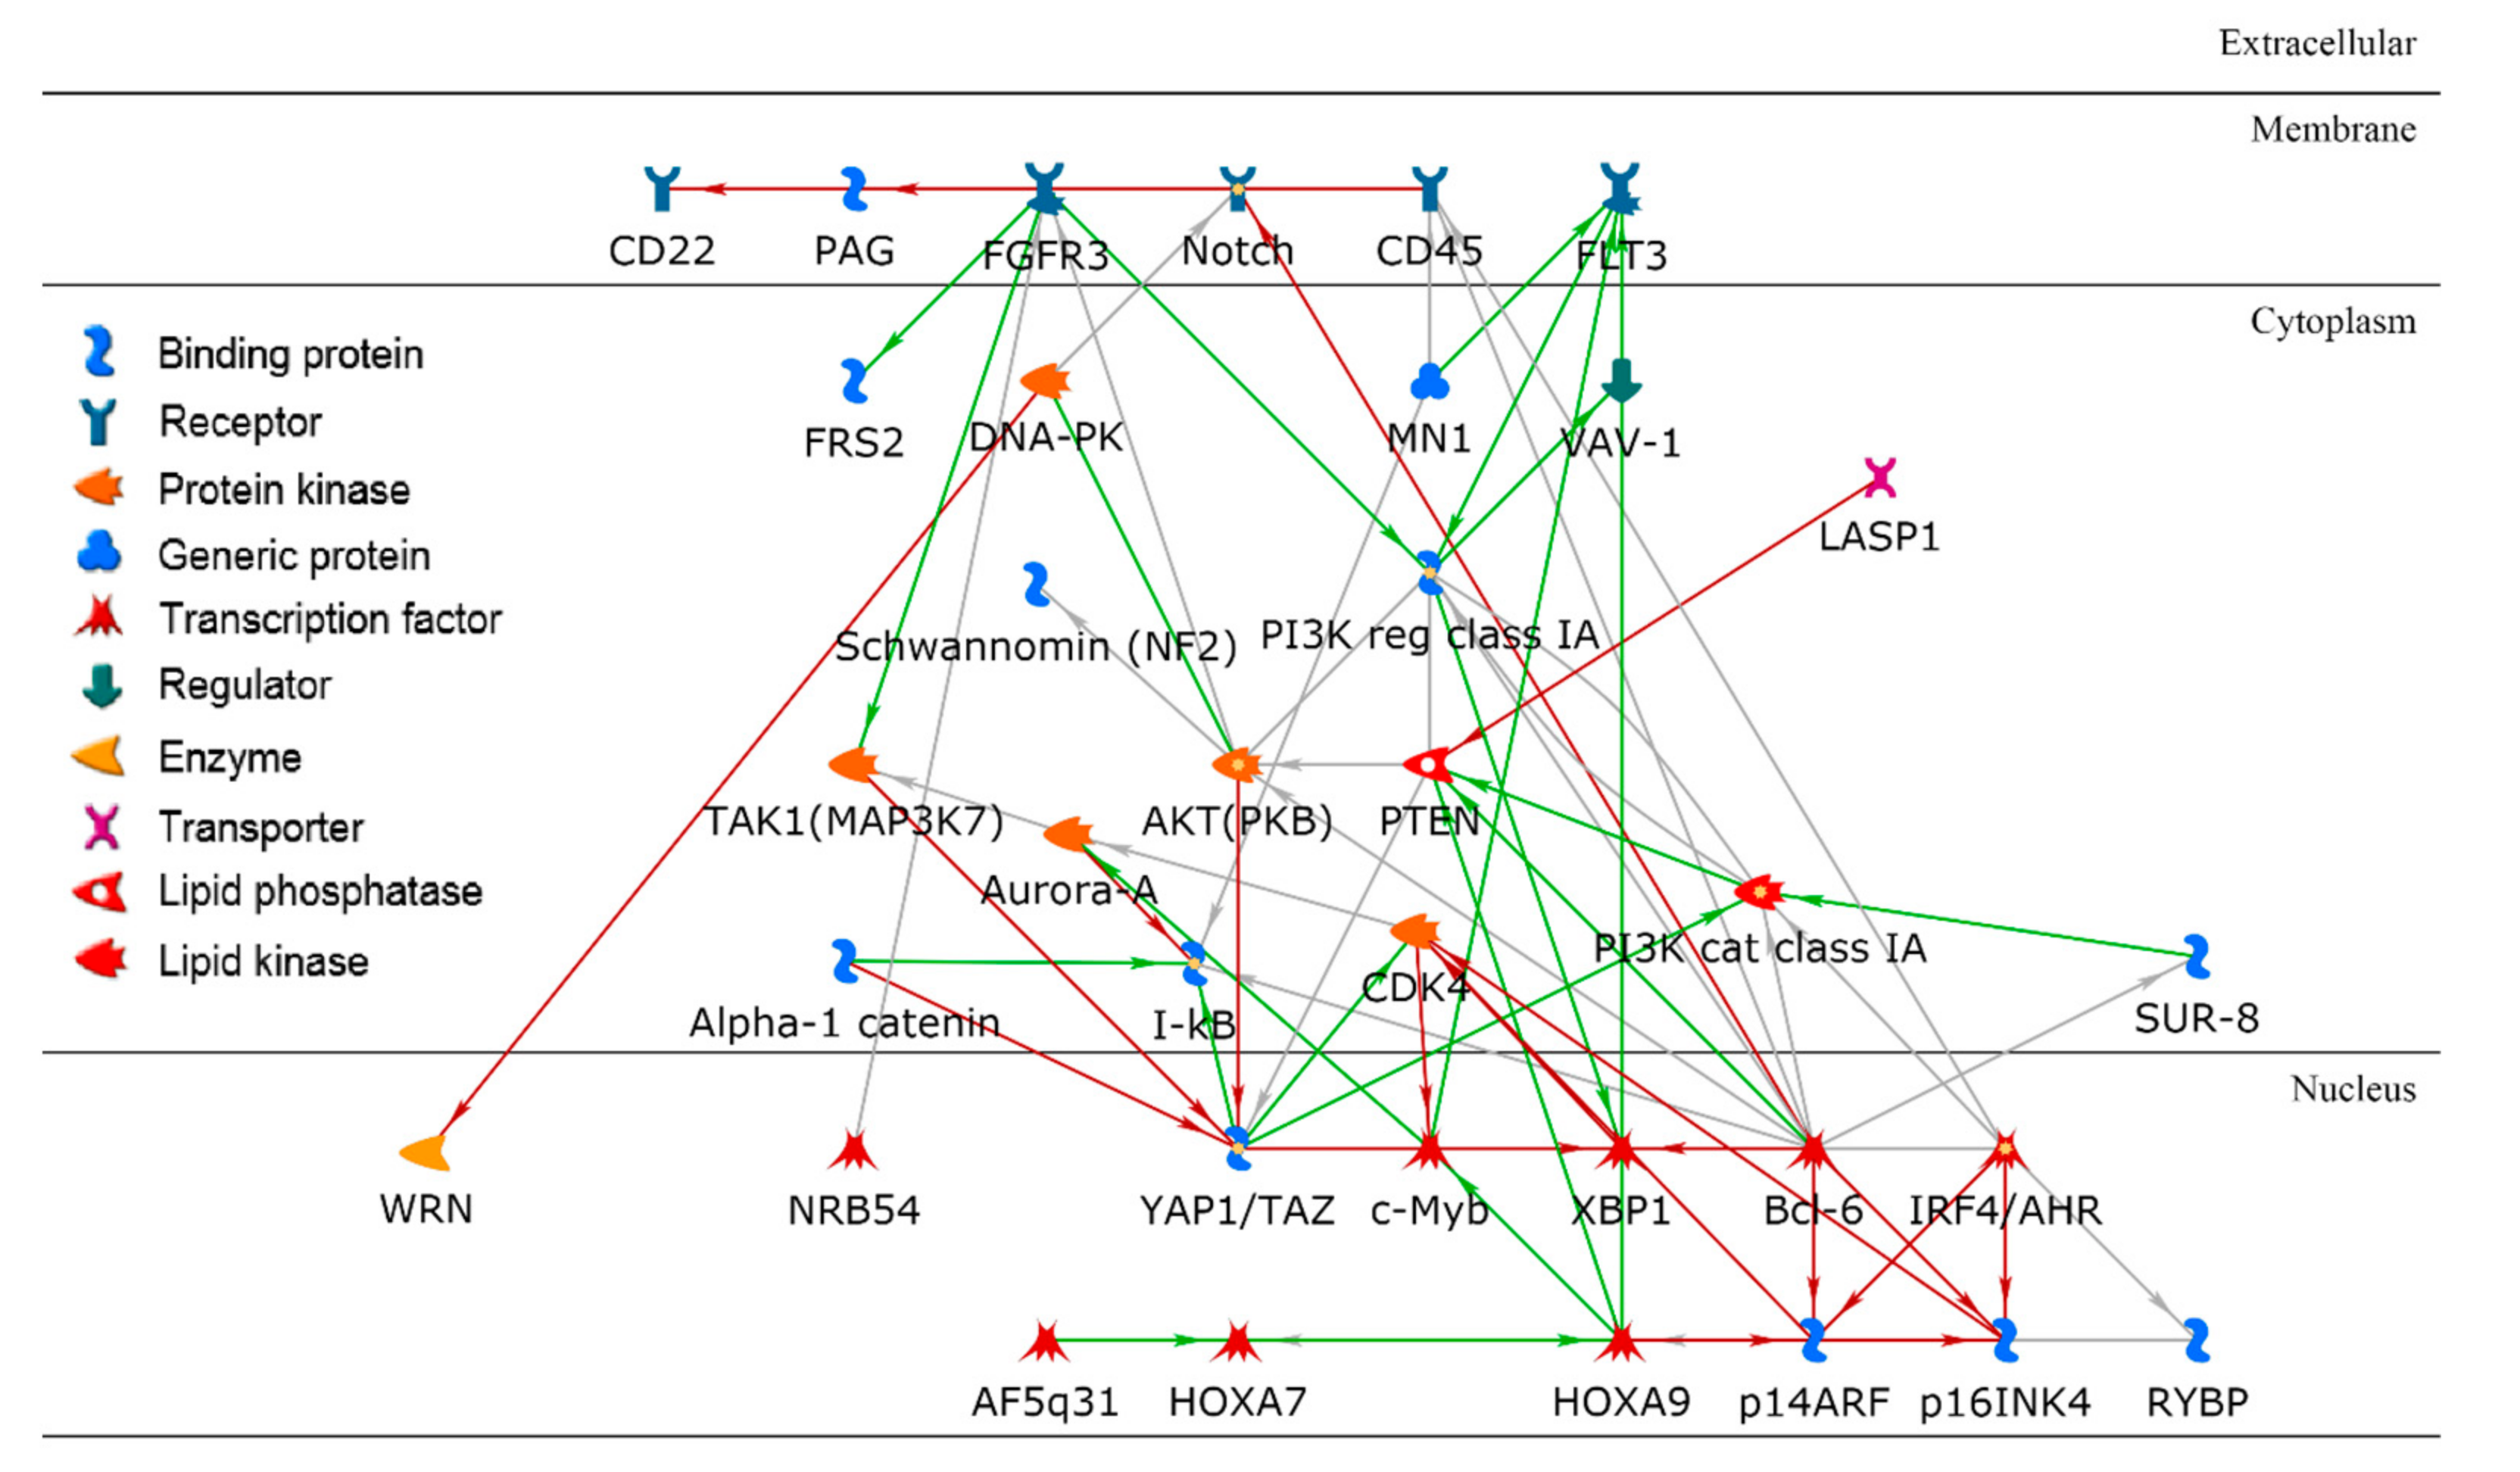
Figure 6. A protein–protein interaction network using a set of key gene products in a paired cluster of cell lines and drugs. Bcl-6 is a hub in the network with the highest node degree.
Table 2. The top five biological processes obtained from gene ontology enrichment analysis using 70 significant genes.
| Ranking | Biological Processes | FDR | Number of Input Genes |
|---|---|---|---|
| 1 | Regulation of apoptotic process | 2.55 × 10⁻²⁰ | 40 |
| 2 | Regulation of programmed cell death | 2.55 × 10⁻²⁰ | 40 |
| 3 | Regulation of cell death | 4.94 × 10⁻²⁰ | 41 |
| 4 | System development | 1.93 × 10⁻¹⁸ | 56 |
| 5 | Positive regulation of nitrogen compound metabolic process | 5.35 × 10⁻¹⁸ | 48 |
This entry is adapted from the peer-reviewed paper 10.3390/ijms23031074
References
- Shoemaker, R.H. The NCI60 human tumour cell line anticancer drug screen. Nat. Rev. Cancer 2006, 6, 813–823.
- Iorio, F.; Knijnenburg, T.A.; Vis, D.J.; Bignell, G.R.; Menden, M.P.; Schubert, M.; Aben, N.; Gonçalves, E.; Barthorpe, S.; Lightfoot, H.; et al. A Landscape of Pharmacogenomic Interactions in Cancer. Cell 2016, 166, 740–754.
- Barretina, J.; Caponigro, G.; Stransky, N.; Venkatesan, K.; Margolin, A.A.; Kim, S.; Wilson, C.J.; Lehár, J.; Kryukov, G.V.; Sonkin, D.; et al. The Cancer Cell Line Encyclopedia enables predictive modelling of anticancer drug sensitivity. Nature 2012, 483, 603–607.
- Yang, W.; Soares, J.; Greninger, P.; Edelman, E.J.; Lightfoot, H.; Forbes, S.; Bindal, N.; Beare, D.; Smith, J.A.; Thompson, I.R.; et al. Genomics of Drug Sensitivity in Cancer (GDSC): A resource for therapeutic biomarker discovery in cancer cells. Nucleic Acids Res. 2013, 41, D955–D961.
- Garnett, M.J.; Edelman, E.J.; Heidorn, S.J.; Greenman, C.D.; Dastur, A.; Lau, K.W.; Greninger, P.; Thompson, I.R.; Luo, X.; Soares, J.; et al. Systematic identification of genomic markers of drug sensitivity in cancer cells. Nature 2012, 483, 570–575.
- Chabner, B.A. NCI-60 Cell Line Screening: A Radical Departure in its Time. J. Natl. Cancer Inst. 2016, 108.
- Boyd, M.R.; Paull, K.D. Some practical considerations and applications of the national cancer institute in vitro anticancer drug discovery screen. Drug Dev. Res. 1995, 34, 91–109.
- Weinstein, J.N. Integromic analysis of the NCI-60 cancer cell lines. Breast Dis. 2004, 19, 11–22.
- Staunton, J.E.; Slonim, D.K.; Coller, H.A.; Tamayo, P.; Angelo, M.J.; Park, J.; Scherf, U.; Lee, J.K.; Reinhold, W.O.; Weinstein, J.N.; et al. Chemosensitivity prediction by transcriptional profiling. Proc. Natl. Acad. Sci. USA 2001, 98, 10787–10792.
- Azuaje, F. Computational models for predicting drug responses in cancer research. Brief. Bioinform. 2017, 18, 820–829.
- Yates, J.W.T.; Mistry, H. Clone Wars: Quantitatively Understanding Cancer Drug Resistance. JCO Clin. Cancer Inform. 2020, 4, 938–946.
- Dong, Z.; Zhang, N.; Li, C.; Wang, H.; Fang, Y.; Wang, J.; Zheng, X. Anticancer drug sensitivity prediction in cell lines from baseline gene expression through recursive feature selection. BMC Cancer 2015, 15, 489.
- Daemen, A.; Griffith, O.L.; Heiser, L.M.; Wang, N.J.; Enache, O.M.; Sanborn, Z.; Pepin, F.; Durinck, S.; Korkola, J.E.; Griffith, M.; et al. Modeling precision treatment of breast cancer. Genome Biol. 2013, 14, R110.
- Menden, M.P.; Iorio, F.; Garnett, M.; McDermott, U.; Benes, C.H.; Ballester, P.J.; Saez-Rodriguez, J. Machine learning prediction of cancer cell sensitivity to drugs based on genomic and chemical properties. PLoS ONE 2013, 8, e61318.
- Geeleher, P.; Cox, N.J.; Huang, R.S. Clinical drug response can be predicted using baseline gene expression levels and in vitro drug sensitivity in cell lines. Genome Biol. 2014, 15, R47.
- Riddick, G.; Song, H.; Ahn, S.; Walling, J.; Borges-Rivera, D.; Zhang, W.; Fine, H.A. Predicting in vitro drug sensitivity using Random Forests. Bioinformatics 2011, 27, 220–224.
- Pouryahya, M.; Oh, J.H.; Mathews, J.C.; Deasy, J.O.; Tannenbaum, A.R. Characterizing Cancer Drug Response and Biological Correlates: A Geometric Network Approach. Sci. Rep. 2018, 8, 6402.
- Asati, V.; Mahapatra, D.K.; Bharti, S.K. PI3K/Akt/mTOR and Ras/Raf/MEK/ERK signaling pathways inhibitors as anticancer agents: Structural and pharmacological perspectives. Eur. J. Med. Chem. 2016, 109, 314–341.
- Breiman, L. Random forests. Mach. Learn. 2001, 45, 5–32.
This entry is offline, you can click here to edit this entry!
