Your browser does not fully support modern features. Please upgrade for a smoother experience.
Please note this is an old version of this entry, which may differ significantly from the current revision.
Subjects:
Biotechnology & Applied Microbiology
Sensory science provides objective information about the consumer understanding of a product, the acceptance or rejection of stimuli, and the description of the emotions evoked. It is possible to answer how consumers perceive a product through discriminative and descriptive techniques.
- Temporal
- Hedonic
- Discriminative
- Sensory
1. Sensory Descriptive Tests
Qualitative and quantitative descriptive tests are demanding tests in which highly trained panelists are needed to provide the reproducibility of the results. They assume an essential role in the homogenization of “sensory” communication and description of the product through the development of a sensory lexicon. Lexicons develop attributes that qualitatively describe a product and provide quantitative information about the attribute’s intensity [1].
Quantitative descriptive analysis (QDA) is a technique that has been widely used in many studies for quantifying and optimizing sensory attributes [2][3]. Firstly, a sensory panel must be trained to identify and quantify a product’s sensory attributes through appropriate intensity scales so that statistical analysis can be performed [4]. In a previous study [5], Ramirez and co-workers determined the sensory profile of seven watermelon varieties and recruited experienced panelists for descriptive analysis; the first training session consisted of developing a list of attributes, followed by panelists discussing and defining descriptors. After the panelists acquainted themselves with chemical reference standards, they adjusted their attribute perceptions according to those in watermelon samples. Descriptive analysis revealed that the prevalent attributes in watermelons were wateriness, refreshing, crispness, sweetness, mealiness, freshness, ripe, and melon. This technique was also applied to determine the profile of wines [6]. Recent studies have combined QDA with other methodologies and innovative tools such as big data mining [7].
As a variation of QDA, free choice profiling (FCP) is differentiated by the omission of the training phase, which turns make technique into rapid and less time-consuming than QDA; for this to happen, the panel must be familiar with the product category. Assessors choose attributes, and they are free to use as many terms as they want if they systematically use them to characterize the product. Assessors must decide attributes and meanings before categorization. After products are presented one by one to the assessor, the perceived intensity of the attribute is evaluated through a scale. Since expertise is missing in FCP, a significant challenge is a lack of accuracy. The individual profile data are analyzed by a multidimensional technique called Generalized Procrustes analysis [8][9], a methodology is used to characterize and distinguish products with different properties [10].
Flash profiling (FP) has its roots in FCP; it consists of an evaluation based on assessors’ attributes [9], and it can be implemented with an untrained panel. FP was the first method that emphasized rapidity, and it allows for the understanding of the sensory positioning of products. Although FP does not put out terms, assessors should prioritize descriptive terms rather than hedonic terms in general [8]. Furthermore, this method leads assessors to look for differences between samples [11], and it has proven to be a suitable discriminative sensory method for beverages such as coffee [12] and wine [9].
Liu and co-workers [9] proposed a modified version of FP that became an efficient screening of sensory properties in the case of wine. This alternative involved the napping methodology with subsequent attributes as the word-creation step and a restricted number of terms in the product ranking. This modified version seemed to be more effective for discrimination [9]. New FP approaches are being developed for different kinds of beverage and food products [13][14].
There have been some investigations into the combination of projective mapping (PM) and ultra-flash profiling. These methods in symbiosis significantly contribute to identifying similarities and differences between samples [15][16][17].
PM is a fast-sensory technique that asks a panel to rank products based on their similarities and differences in a two-dimensional plan, creating a graphical representation. This technique enables the description of products through their similarities and differences, as well as the clustering samples [1][18]. It can be performed with different kinds of panelists (experienced panelists, trained panelists, naïve consumers, or individuals who are employed in the wine industry), allowing for comparisons of results to study consumers’ perception [17][19][20][21]. However, when time, resources, or samples are limited, an experienced panelist may be the best option [20]. Other researchers have proven that PM can be successfully implemented in a wide variety of beverages categories, e.g., herbal tea infusions [22], chocolate-flavored milk [23], wines [16][24], and soy-free protein drinks [25]. PM was also proved to be an effective technique to explore food-beverage pairings [26], and recent studies have shown that PM is being used as part of new approaches, namely the affective approach [27], intensity approach [16], hedonic frame [28], and upgrades such as polarized projective mapping [24]. The affective approach substantiates product categorization based on consumers’ choices or preferences [27]. The intensity approach investigated by Wilson and co-workers [16] assesses the relation of different levels of intensity of two thiols (3-mercaptohexan-1-ol (3 MH) and 3-mercaptohexyl acetate (3 MHA)) in various matrices. Kim and co-workers [28] compared a hedonic frame of projective mapping that asked consumers to group samples based on similar reasons for liking or disliking those products, with a sensory frame of projective mapping that asked consumers to group based on sensory resemblances. After mapping the results, they used ultra-flash profiling in both sensory projective mapping and hedonic projective mapping, where assessors could freely describe the sensory attributes of the groups they had categorized. Polarized projective mapping has been used as a solution in studies with larger sample sets or multiple complex categories such as wine. This solution incorporates the terminology “poles” from polarized sensory positioning [29]. Polarized projective mapping uses the location of poles previously established on the panelist’s map; panelists are asked to create a bi-dimensional map, as in projective mapping, but “free-moving” samples are proposed for the panelists to set out around the poles that represent solid references [24].
The check-all-that-apply (CATA) methodology is based on the principles of pre-selected sentences or statements where assessors, even without any previous training, can check the ones that apply to that product [30]. It is a fast and straightforward method that is easy to merge with affective measurements, such as hedonic tests [31]. Additionally, CATA can be used with an untrained panel, and there is evidence that CATA results in better accuracy of results with training [32]. However, CATA term-citation frequency is strongly linked to direct rates of perceived intensity, though this does not mean that intensity can be assessed by CATA questions [33]. CATA questions have already been applied to the sensory characterization of a wide range of products of different complexity [34]; regarding beverages, It can be highlighted its use for apple juice, iced tea [35], wine [36], and milk chocolate [37]. Recent studies have presented some approach variations such as check-if-apply as a solution to water quality judgment, where the focus was undesirable attributes. One of the CATA method requirements is that the product has many desirable and undesirable terms. As such, this novel approach suggests a list of descriptors and asks consumers to choose the few of them that apply [38]. Rate-all-that-apply (RATA) is another alternative to the CATA method where consumers not only check but also rate the intensity of all attributes they find in the assessed product [39]. Furthermore, emerging approaches assume a more dynamic direction, e.g., temporal check-all-that-apply (TCATA) [40].
Open-ended questions are helpful to understand consumers’ perceptions. Initially, they were used for comprehending consumers’ reasons for liking a product. Nowadays, they comprise a valuable tool to understand consumers’ perceptions and which attributes lead to the preference of the product. This method gives an assessor complete freedom of expression, but it is a time-consuming method. Redundancy, ambiguity, and the extension of terms are some of the challenges of open-ended questions [41]. Deneulin and Bavaud [42] presented a textual data treatment from open-ended questions about minerality perception in wine without a tasting phase. In this research, they considered quantitative aspects without considering semantic or linguistic aspects.
In the preferred attribute elicitation (PAE) method, assessors determine several descriptive terms for products; after agreeing on these attributes, they rank their liking intensity of those attributes [43]. This novel sensory method can be used with an untrained panel in just a single session. Defining the most relevant attributes for consumers allows industries to design new food products that meet consumers’ preferences [44]. Discrete choice experiments (DCEs) and best-worst scaling (BWS) are two typical elicitation methods. In DCEs, participants select between two or more possibilities. BWS can work via three different approaches: object cases, profile cases, and multi-profile cases. In profile cases, respondents choose the best and worst alternatives from a list of dimension levels or items [45]. A recent investigation by Campigotto and co-workers [46] proposed CLEO, a preference elicitation algorithm that allows for the suggestion of complex configurable objects represented by discrete and continuous attributes and the constraints defined over them. Some studies have suggested the use of PAE and CATA [47] and PAE and TCATA combined [43].
Polarized sensory positioning (PSP) is based on a reference (pole), and samples are compared with those poles. There are no attributes that allow for a faster sensory characterization and more straightforward data analysis in this method. PSP can be classified into two types with different kinds of evaluation: polarized sensory positioning based on the degree of different scales and triadic polarized sensory positioning. In the former, the scale ranges from “exactly the same” to “totally different”. In the last one, assessors are asked to have poles in consideration and display which sample is more similar and which one is more different [48].
Introduced by Lawless and co-workers [49], sorting (also known as a free sorting task or free multiple sorting) is used to investigate perceptual models of odor perception. This method is an excellent option for untrained assessors [50]; however, an expert sensory panel is crucial for accurate sensory characterization [7][51][52]. It can also be reproduced with healthy older adults [53] due to its quick and straightforward applicability, which is why it has become such a popular method. In just one session, products can be randomly and simultaneously presented in different sequences. Tasters are invited to sensory evaluate and sort products into groups with perceived similitudes. Then, they give minor descriptors to characterize each of those groups [1].
2. Sensory Discriminative Tests
Discriminative tests determine whether samples are similar or there is some difference between samples and, if so, which one is different. According to the complexity of the product, the type of discriminative test is chosen, and it is implemented based on several parameters such as the replacement of an ingredient in the product, the installation of new equipment, or deviations from usual protocol during production [54].
One of the most popular discriminative tests is the triangle test. Firstly, the triangle test was used for the quality assessment of whiskeys and beers, and then its use spread to other beverage and food products [55]. In Debela and co-workers’ investigation [56], 94.4% of a sensory panel was capable of distinguishing between Coffea Arabica honey and Vernonia amygdalina honey. In this test, three samples are displayed to assessors at the same time. Two of these assessed samples are the same, and one of them is different. Samples are presented at random, making combinations such as AAB, ABA, BAA, BBA, BAB, and ABB [55]. After coding random samples with three digits, assessors identify the odd one out, assessing samples from left to right. Statistically, assessors are likely to get it right 1 out of 3 times or 33.3% [54]. A triangle test can be used to identify a difference between two products, market trends, and the impact of a change in ingredients, packaging, processing, handling, or storage conditions; it is also a helpful tool in the recruitment process of a tasting panel [55]. Accuracy and assessment time in triangle tests do not increase when considering monetary incentives; however, if assessors like the product, these aspects can be impacted [57].
Unlike the triangle test, the tetrad test focus on similarities between samples. Four samples, in which two are from one group and two are from a second group, are displayed to assessors [54]. The tetrad test can be very useful to understand how consumers perceive changes in the production process or even changes in some ingredients [58]. This test is reviewed as more powerful than the triangle test; despite the probability of correctly answering the same in both tests (1/3), the tetrad test has a higher statistical significance. Therefore, it can be seen as a more efficient and accurate test [54][58], as well as being considered a forced-choice test [58].
The duo–trio test was created as an alternative to the triangle test because it is easier to perform than the triangle test [59]. In this test, assessors are presented with three coded samples, in which one of which is the reference. Assessors may identify the most similar sample to the reference. This test can be used to evaluate how significant sensory differences are between samples [60].
Duo–trio tests are classified into two designs: constant-reference mode and balanced-reference mode. In the former, the reference is constant during the entire test. It is chosen when assessors are more familiar with one of the samples and when there is a limited quantity of a sample [59]. In the balanced reference mode, both samples are randomly presented as references. New versions with variations of the place where the reference may remain balanced are gaining prominence; the reference can be presented first or in the middle. Even dual reference duo–trio tests have been suggested in the literature, with the first and last places, the first and middle places [60], or comparisons between pairs of distances [61]. For a better comparison of multiple pairs, A-Not A with a reminder (A-Not AR) and 2-AFC with a reminder (2-AFCR) can also be used [62].
Similar to the duo–trio test but with two served reference samples is a dual-standard test. This test may assume several possible combinations, namely, reference A and reference B (pause), coded A and B samples; reference A and reference B (pause), coded B and A; or the positions of the references and services that are switched [63].
Following the structure of the duo–trio test but reversed is ABX. First, assessors are given two control samples and a treated sample, and then they are asked to match the “X” sample to one of the references [63].
The A-Not A test is another discriminative method that consists of presenting reference A and other samples to the assessor, who must then choose whether the other assessed samples are similar or not to the A sample [60].
As discriminative tests such as the triangle or duo–trio tests can lead assessors to sensory fatigue with strong flavors and complex products, paired comparison tests are a suitable solution because they are simpler and more intuitive. In a paired comparison, assessors are asked to compare two samples without considering the intensity of perception. Paired comparison tests can be classified as simple difference tests or directional paired comparison tests (or 2-alternative forced-choice (2-AFC) tests); usually, they are implemented with two samples, but they are also possible with multiple samples (multiple paired comparison test). Their application can be based on forced-choice (FC), which means that assessors must choose one of the two samples, or non-forced-choice, where assessors have the alternative “no difference,” which means both samples seem similar to them [64]. To increase forced-choice power and detect small and directional changes of stimuli, some paired versions of FC tests have been emerging [65]. One is known as an alternate forced-choice (AFC), which can be based on the triangle test becoming 3-AFC or a paired comparison test becoming 2-AFC [60].
One variation is the four-interval, two-alternative forced-choice (4I2AFC), which is a paired version of the 2-AFC where the two alternatives are AB and BA pairs, a stronger stimulus or signal is considered, and the weaker stimulus or noise is B. In 4I2AFC, assessors are asked to choose the pair (AB) with decreasing stimuli change [66].
3. Sensory Hedonic Tests
Hedonic methods are characterized by their ability to measure the subjective individual response of consumers’ preferences, acceptance, liking, or perception of a product’s benefits [1]. There have been some investigations into optimization methods such as just-about right (JAR) scaling and Ideal Profile Method (IPM) [67]. The bimodal JAR scales point out sensory terms that interfere the most with product acceptance. The “just–right” level of a sensory term is represented by a midpoint in the scale. The points at the ends are extremes, such as not smooth enough or too smooth [68]. This scale is frequently used in product development with an untrained panel or consumers, and it allows for the measurement of JAR attributes on enjoyment [69]. In IPM, the intensity and ideal intensity of attributes for each product is rated by assessors. This method is key in the early development of the sensory qualities of existing products [70]. In addition to hedonic measurements, a forthcoming scale is known as the degree of satisfaction-difference (DOSD) was created to validate consumers’ preferences. This scale considers the consumer’s context and internal evaluative criteria before product assessment [71].
Research on consumers’ understanding and emotional response towards beverages has been gaining interest [72][73][74][75]. Even new methods are emerging, such as relative preference mapping (RLM), which provides information about wine styles that are liked and innovative based on projective mapping to measure consumers’ preferences [76].
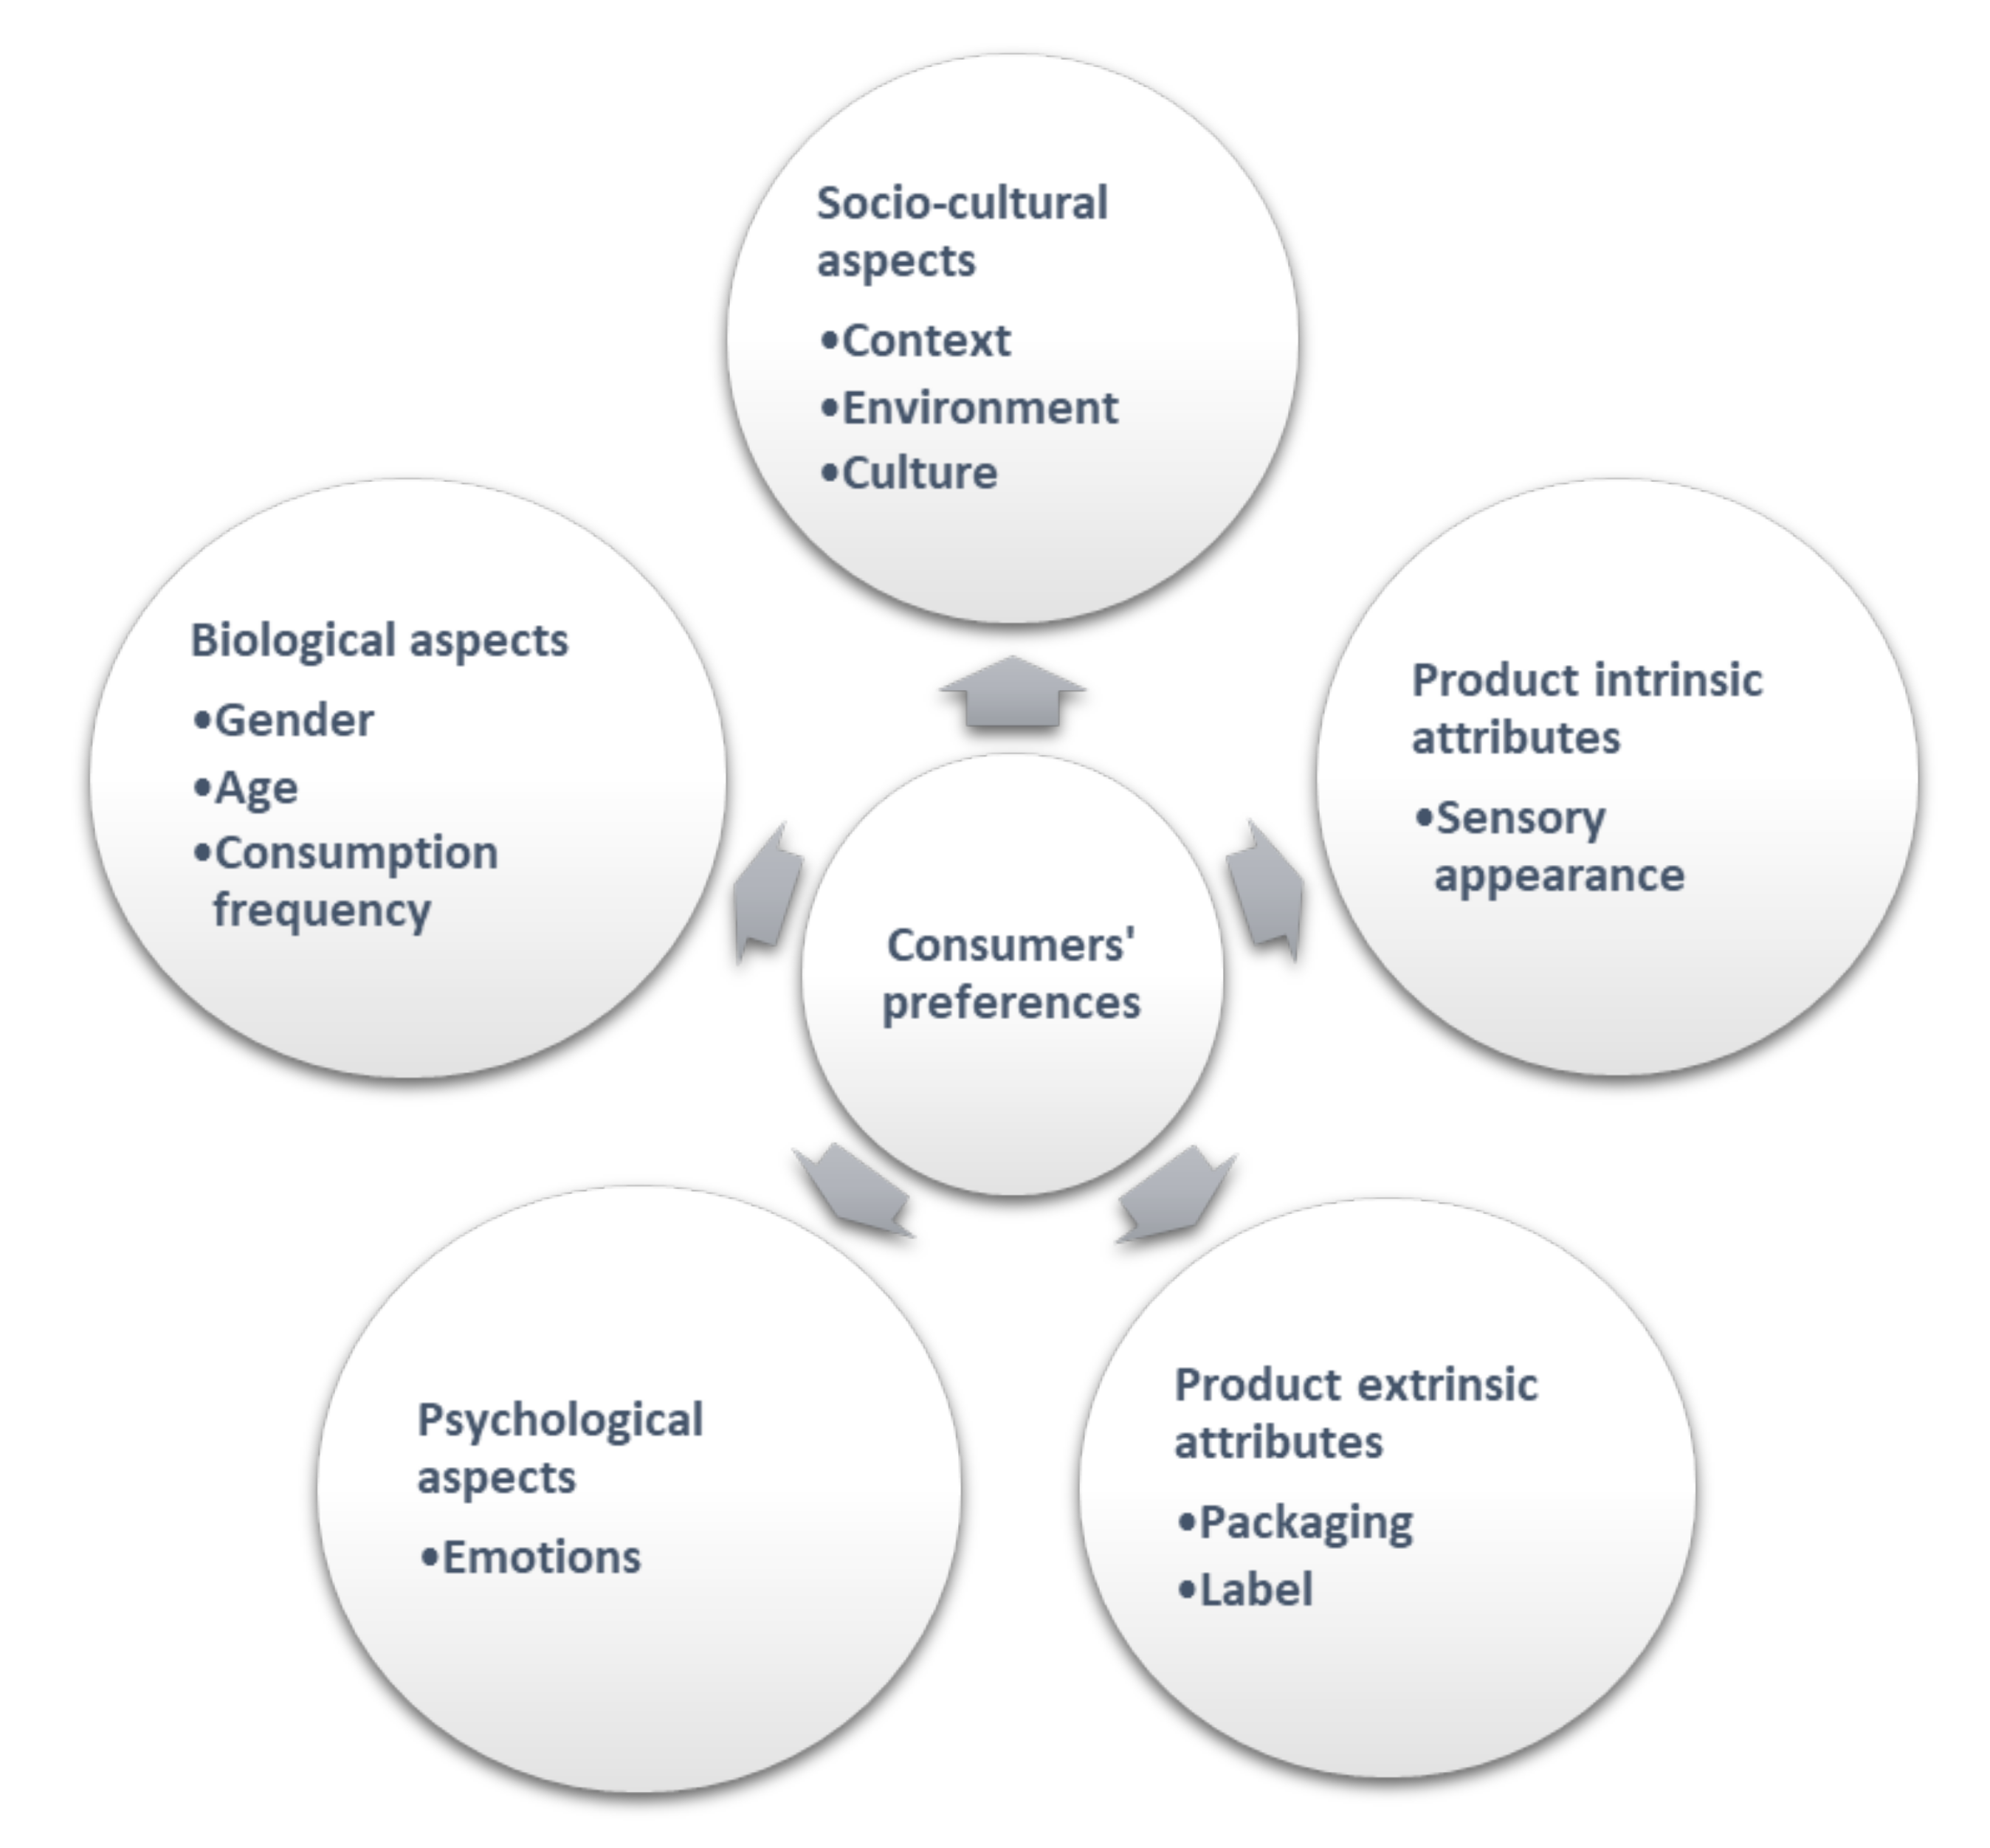
Many factors, including biological, psychological, and socio-cultural, may influence consumers’ preferences and choices (Figure 1) [73]. Gender, age, consumption frequency, education, and income are just a few examples of those many variables that affect consumers’ preferences and choices [77]. In addition, product-intrinsic attributes such as sensory appearance, product-extrinsic attributes such as label or packaging [78][79], and contextual and environmental influences may have clear effects on hedonic tasting [73].
Context and the consumer’s mood may also affect the evoked emotions, creating an association between elicited emotions and the willingness to pay more for the product [80]. Furthermore, cross-cultural studies have received particular attention [72], but there are no standardized differences between cultures’ responses [81].
Emotions influence product experience and product consumption, and for this reason, they are essential in consumer behavior [82]. Wine consumption is associated with pleasure by wine consumers, and their emotions impact wine consumption experiences [83]. Functional and emotional associations can motivate consumption [84]. Emotions elicited by consumption can also provide additional information about consumers’ personalities [85]. Recent research has used individuals’ factors to segment consumers to understand their preferences [76]. Segmentation based on psychographics and behavior was studied by Danne et al. [86], who investigated the impact of context on wine consumer segments’ enjoyment and emotions while consuming wines in different environments.
In sensory and consumer science, cross-cultural research has become stronger. The main linguistic differences across cultures are sensory terms, emotional terms, and the interpretation of scale anchors. American consumers use a more extensive range of nine points for hedonic scales than Asian consumers [81].
4. Temporal Tests
The way consumers perceive a product is strongly linked to their expectations, which can be based on their enjoyment or even their satiety. A temporal driver approach can be completely appropriated to trigger those expectations in consumers with diverse eating preferences and behaviors during the tasting process [87]. Over the last few years, temporal dynamics in the sensory assessment of beverages have been widely investigated [88][89][90][91][92][93][94] because the sensory analysis is a very complex and dynamic process that floats and evolves.
Time-intensity (TI) methods consider the intensity of stimuli over time, and they perform incredibly well in the analyses of sensations, namely the evolution of mouthfeel and flavor release [95]. TI can be classified as a dual attribute time-intensity (DATI) method if assessed with two stimuli or a multiple attribute time-intensity (MATI) method if assessed with multiple stimuli. The main goal of these methodologies is to define a pattern of the evolution of a specific sensory characteristic. Although time–intensity is perfect for contrasting products with different temporal characteristics [1], it requires extra training and more repetitions to achieve reliable results; thus, the TI Reliability Index was suggested to explore intra-individual variation in the same panel [89]. In cases of products with shorter consumption times such as chewing gum, the continuous time-intensity (CTI) method has performed well, constantly recording assessors’ perceptions. Furthermore, other intensity methods such as temporal dominance of sensations (TDS) evaluate various attributes during the assessment of a sample; CTI provides deeper and customized data regarding the perceived intensity of an attribute and its variations over time [95].
TDS is better than temporal dominance methods due to its ability to consecutively record several sensory attributes over time, identifying one specific attribute as “dominant” [11]. TDS is more effective regarding temporal differences than TI, though it does not mention why an attribute is dominant; it is also a less time-consuming technique. Scales in TI are not equal and do not allow for the comparison of attributes [96]. Nevertheless, there are other temporal dominance approaches. One of them is temporal liking (TL), which is used to collect scores and perceive variations of the acceptability of a product over time [91]. TL can be alternated with TDS [97], recognizing temporal drivers of liking by TDS [98] or performing temporal liking simultaneously with temporal dominance of sensations in several intakes [99]. temporal dominance of emotions (TDE), where sensory attributes are replaced by emotions, was recently proposed as an extension of TDS [100]. This technique is widely used to understand factors that lead consumers to buy a product, such as packaging color [101]. Recently, some researchers suggested new pathways to apply TDE, dynamically recording facial expressions for assessing food-elicited emotions over time [102][103] or applying video advertisements of a product [100]. There are periods during tasting where there is no dominant attribute, and that can create noise in data. In the hold-down procedure, assessors hold down the attribute button when it is perceived as dominant and release it when it is no longer dominant [104].
Another popular temporal method is temporal check-all-that-apply (TCATA). TCATA is a dynamic method for describing several sensory features of a product and its development over time. Based on the CATA method in TCATA, assessors are asked to check all attributes that apply to the product in evaluation in addition to recording the evolution of sensory changes in products [105]. One of the applications of this method is in the measurement of wine complexity [106]. Moreover, further investigation has been made based on a combination of two or more temporal methods. For example, to characterize wines from different varieties, TDS and TCATA have been used, and it was concluded that in combination with phenolic composition, these methods are helpful in the detection of the time of bitterness perception [107].
Although TDS and TCATA are frequently used for sensory evaluation during consumption, they present some struggles because both rely on a predefined and shortlist of attributes. To overcome that limitation, Mahieu and co-workers suggested free comment attack evolution finish (FC AEF), where assessors describe a product through free comment descriptions during periods, namely attack, evolution, and finish [108].
A new method called projective categorization was created to predict wine aging potential, giving assessors a visual tool to assess the projected development of a wine’s quality over time over different dynamics. In a study, three curves in an orthonormal coordinate system were given to the assessors; these curves corresponded to three aging potentials (high potential, medium potential, and low potential) for Champagne base wines. Assessors were asked to place the tasted wine on one of these three curves. Assessors based their choices on the temporal notion (with the abscissa axis) and the qualitative notion (with the ordinate axis) following the aging potential evaluation. This method allowed for the accurate distinction of wines with different aging aptitudes [109].
This entry is adapted from the peer-reviewed paper 10.3390/foods11030255
References
- Vilela, A.; Bacelar, E.; Pinto, T.; Anjos, R.; Correia, E.; Gonçalves, B.; Cosme, F. Beverage and Food Fragrance Biotechnology, Novel Applications, Sensory and Sensor Techniques: An Overview. Foods 2019, 8, 643.
- López-López, A.; Sánchez-Gómez, A.H.; Montaño, A.; Cortés-Delgado, A.; Garrido-Fernández, A. Data on Sensory Profile of Green Spanish-Style Table Olives Studied by Quantitative Descriptive Analysis. Data Brief 2018, 20, 1471–1488.
- Gulzar, N.; Sameen, A.; Aadil, R.M.; Sahar, A.; Rafiq, S.; Huma, N.; Nadeem, M.; Arshad, R.; Saleem, I.M. Descriptive Sensory Analysis of Pizza Cheese Made from Mozzarella and Semi-Ripened Cheddar Cheese under Microwave and Conventional Cooking. Foods 2020, 9, 214.
- Puri, R.; Khamrui, K.; Khetra, Y.; Malhotra, R. Quantitative Descriptive Analysis and Principal Component Analysis for Sensory Characterization of Indian Milk Product Cham-Cham. J. Food Sci. Technol. 2016, 53, 1238–1246.
- Ramirez, J.L.; Du, X.; Wallace, R.W. Investigating Sensory Properties of Seven Watermelon Varieties and Factors Impacting Refreshing Perception Using Quantitative Descriptive Analysis. Food Res. Int. 2020, 138, 109681.
- Villière, A.; Symoneaux, R.; Roche, A.; Eslami, A.; Perrot, N.; le Fur, Y.; Prost, C.; Courcoux, P.; Vigneau, E.; Thomas-Danguin, T.; et al. Comprehensive Sensory and Chemical Data on the Flavor of 16 Red Wines from Two Varieties: Sensory Descriptive Analysis, HS-SPME-GC-MS Volatile Compounds Quantitative Analysis, and Odor-Active Compounds Identification by HS-SPME-GC-MS-O. Data Brief 2019, 24, 103725.
- Guo, H.; Yang, F.; Gao, P.; Yu, D.; Xu, Y.; Jianga, Q.; Yu, P.; Xia, W. Comparison of Sensory Evaluation for Chinese Mitten Crab (Eriocheir Sinensis) by Big Data Mining and Trained Sensory Panel. Food Chem. 2021, 356, 129698.
- Punter, P.H. Free Choice Profiling. In Descriptive Analysis in Sensory Evaluation; Kemp, S.E., Hort, J., Hollowood, T., Eds.; John Wiley & Sons Ltd: Hoboken, NJ, US, 2018; pp. 493–511.
- Liu, J.; Bredie, W.L.P.; Sherman, E.; Harbertson, J.F.; Heymann, H. Comparison of Rapid Descriptive Sensory Methodologies: Free-Choice Profiling, Flash Profile, and Modified Flash Profile. Food Res. Int. 2018, 106, 892–900.
- Vit, P.; Pedro, S.R.M.; Vergara, C.; Deliza, R. Ecuadorian Honey Types Described by Kichwa Community in Rio Chico, Pastaza Province, Ecuador Using Free-Choice Profiling. Rev. Bras. Farmacogn. 2017, 27, 384–387.
- Lorido, L.; Estévez, M.; Ventanas, S. Fast and Dynamic Descriptive Techniques (Flash Profile, Time-Intensity and Temporal Dominance of Sensations) for Sensory Characterization of Dry-Cured Loins. Meat Sci. 2018, 145, 154–162.
- Kalschne, D.L.; Biasuz, T.; de Conti, A.J.; Viegas, M.C.; Corso, M.P.; de Toledo Benassi, M. Sensory Characterization and Acceptance of Coffee Brews of C. Arabica and C. Canephora Blended with Steamed Defective Coffee. Food Res. Int. 2019, 124, 234–238.
- Liu, J.; Grønbeck, M.S.; di Monaco, R.; Giacalone, D.; Bredie, W.L.P. Performance of Flash Profile and Napping with and without Training for Describing Small Sensory Differences in a Model Wine. Food Qual. Prefer. 2016, 48, 41–49.
- Miele, N.A.; Cabisidan, E.K.; Blaiotta, G.; Leone, S.; Masi, P.; di Monaco, R.; Cavella, S. Rheological and Sensory Performance of a Protein-Based Sweetener (MNEI), Sucrose, and Aspartame in Yogurt. J. Dairy Sci. 2017, 100, 9539–9550.
- Hayward, L.; Jantzi, H.; Smith, A.; McSweeney, M.B. How Do Consumers Describe Cool Climate Wines Using Projective Mapping and Ultra-Flash Profile? Food Qual. Prefer. 2020, 86, 104026.
- Wilson, C.; Brand, J.; Toit, W.; Buica, A. Matrix Effects Influencing the Perception of 3-Mercaptohexan-1-Ol (3MH) and 3-Mercaptohexyl Acetate (3MHA) in Different Chenin Blanc Wines by Projective Mapping (PM) with Ultra Flash Profiling (UFP) Intensity Ratings. Food Res. Int. 2019, 121, 633–640.
- Barton, A.; Hayward, L.; Richardson, C.D.; McSweeney, M.B. Use of Different Panellists (Experienced, Trained, Consumers and Experts) and the Projective Mapping Task to Evaluate White Wine. Food Qual. Prefer. 2020, 83, 103900.
- Risvik, E.; McEwan, J.A.; Colwill, J.S.; Rogers, R.; Lyon, D.H. Projective Mapping: A Tool for Sensory Analysis and Consumer Research. Food Qual. Prefer. 1994, 5, 263–269.
- Morin, M.; Hayward, L.; McSweeney, M.B. Use of Experienced Panelists and the Projective Mapping Task in Comparison to Trained Panelists and Naïve Consumers. J. Sens. Stud. 2018, 33, e12463.
- Berget, I.; Varela, P.; Næs, T. Segmentation in Projective Mapping. Food Qual. Prefer. 2019, 71, 8–20.
- Orden, D.; Fernández-Fernández, E.; Tejedor-Romero, M.; Martínez-Moraian, A. Geometric and Statistical Techniques for Projective Mapping of Chocolate Chip Cookies with a Large Number of Consumers. Food Qual. Prefer. 2021, 87, 104068.
- Moelich, E.; Muller, M.; Joubert, E.; Næs, T.; Kidd, M. Validation of Projective Mapping as Potential Sensory Screening Tool for Application by the Honeybush Herbal Tea Industry. Food Res. Int. 2017, 99, 275–286.
- Varela, P.; Antúnez, L.; Berget, I.; Oliveira, D.; Christensen, K.; Vidal, L.; Naes, T.; Ares, G. Influence of Consumers’ Cognitive Style on Results from Projective Mapping. Food Res. Int. 2017, 99, 693–701.
- Wilson, C.; Brand, J.; Toit, W.; Buica, A. Polarized Projective Mapping as a Rapid Sensory Analysis Method Applied to South African Chenin Blanc Wines. LWT—Food Sci. Technol. 2018, 92, 140–146.
- Aschemann-Witzel, J.; Varela, P.; Odile, A. Consumers’ Categorization of Food Ingredients: Do Consumers Perceive Them as ‘Clean Label’ Producers Expect? An Exploration with Projective Mapping. Food Qual. Prefer. 2019, 71, 117–128.
- Arellano-Covarrubias, A.; Varela, P.; Escalona-Buendía, H.B.; Gómez-Corona, C. A Food and Beverage Map: Exploring Food-Beverage Pairing through Projective Mapping. Food Qual. Prefer. 2022, 96, 104431.
- Varela, P.; Berget, I.; Hersleth, M.; Carlehög, M.; Asioli, D.; Næs, T. Projective Mapping Based on Choice or Preference: An Affective Approach to Projective Mapping. Food Res. Int. 2017, 100, 241–251.
- Kim, M.; Kim, K.; Chung, S. Utilizing Hedonic Frame for Projective Mapping: A Case Study with Korean Fermented Soybean Paste Soup. Food Qual. Prefer. 2019, 71, 279–285.
- Ares, G.; de Saldamando, L.; Vidal, L.; Antúnez, L.; Giménez, A.; Varela, P. Polarized Projective Mapping: Comparison with Polarized Sensory Positioning Approaches. Food Qual. Prefer. 2013, 28, 510–518.
- Vilela, A. The Importance of Yeasts on Fermentation Quality and Human Health-Promoting Compounds. Fermentation 2019, 5, 46.
- Alexi, N.; Byrne, D.V.; Nanou, E.; Grigorakis, K. Investigation of Sensory Profiles and Hedonic Drivers of Emerging Aquaculture Fish Species. J. Sci. Food Agric. 2018, 98, 1179–1187.
- Alexi, N.; Nanou, E.; Lazo, O.; Guerrero, L.; Grigorakis, K.; Byrne, D.V. Check-All-That-Apply (CATA) with Semi-Trained Assessors: Sensory Profiles Closer to Descriptive Analysis or Consumer Elicited Data? Food Qual. Prefer. 2018, 64, 11–20.
- Jaeger, S.R.; Chheang, S.L.; Jin, D.; Roigard, C.M.; Ares, G. Check-All-That-Apply (CATA) Questions: Sensory Term Citation Frequency Reflects Rated Term Intensity and Applicability. Food Qual. Prefer. 2020, 86, 103986.
- Vidal, L.; Antúnez, L.; Ares, G.; Cu, F.; Lee, P.; Le, M.; Jaeger, S.R. Sensory Product Characterisations Based on Check-All-That-Apply Questions: Further Insights on How the Static (CATA) and Dynamic (TCATA) Approaches Perform. Food Res. Int. 2019, 125, 108510.
- Jaeger, S.R.; Beresford, M.K.; Lo, K.R.; Hunter, D.C.; Chheang, S.L. What Does It Mean to Check-All-That-Apply? Four Case Studies with Beverages. Food Qual. Prefer. 2020, 80, 103794.
- Schumaker, M.R.; Diako, C.; Castura, J.C.; Edwards, C.G.; Ross, C.F. Influence of Wine Composition on Consumer Perception and Acceptance of Brettanomyces Metabolites Using Temporal Check-All-That-Apply Methodology. Food Res. Int. 2019, 116, 963–972.
- Mahieu, B.; Visalli, M.; Thomas, A.; Schlich, P. An Investigation of the Stability of Free-Comment and Check-All-That-Apply in Two Consumer Studies on Red Wines and Milk Chocolates. Food Qual. Prefer. 2021, 90, 104159.
- Carneiro, R.C.V.; Wang, C.; Yu, J.; O’Keefe, S.F.; Duncan, S.E.; Gallagher, C.D.; Burlingame, G.A.; Dietrich, A.M. Check-If-Apply Approach for Consumers and Utilities to Communicate about Drinking Water Aesthetics Quality. Sci. Total Environ. 2021, 753, 141776.
- Meynersa, M.; Jaegerb, S.R.; Ares, G. On the Analysis of Rate-All-That-Apply (RATA) Data. Food Qual. Prefer. 2016, 49, 1–10.
- Jaeger, S.R.; Alcaire, F.; Hunter, D.C.; Jin, D.; Castura, J.C. Number of Terms to Use in Temporal Check-All-That-Apply Studies (TCATA and TCATA Fading) for Sensory Product Characterization by Consumers. Food Qual. Prefer. 2018, 64, 154–159.
- Spinelli, S.; Dinnella, C.; Masi, C.; Paolo, G.; Prescott, J. Investigating Preferred Coffee Consumption Contexts Using Open-Ended Questions. Food Qual. Prefer. 2017, 61, 63–73.
- Deneulin, P.; Bavaud, F. Analyses of Open-Ended Questions by Renormalized Associativities and Textual Networks: A Study of Perception of Minerality in Wine. Food Qual. Prefer. 2016, 47, 34–44.
- Silva, R.; Rocha, R.S.; Guimarães, J.T.; Balthazar, C.F.; Scudino, H.; Ramos, G.L.P.A.; Pimentel, T.C.; Silva, M.C.; Henrique, F.; Silva, P.; et al. Dulce de Leche Submitted to Ohmic Heating Treatment: Consumer Sensory Profile Using Preferred Attribute Elicitation (PAE) and Temporal Check-All-That-Apply (TCATA). Food Res. Int. 2020, 134, 109217.
- Muggah, E.M.; McSweeney, M.B. Using Preferred Attribute Elicitation to Determine How Males and Females Evaluate Beer. J. Food Sci. 2017, 82, 1916–1923.
- Himmler, S.; Soekhai, V.; van Exel, J.; Brouwer, W. What Works Better for Preference Elicitation among Older People? Cognitive Burden of Discrete Choice Experiment and Case 2 Best-Worst Scaling in an Online Setting. J. Choice Model. 2021, 38, 100265.
- Campigotto, P.; Teso, S.; Battiti, R.; Passerini, A. Learning Modulo Theories for Constructive Preference Elicitation. Artif. Intell. 2021, 295, 103454.
- Popoola, I.O.; Bruce, H.L.; McMullen, L.M.; Wismer, W.V. Consumer Sensory Comparisons Among Beef, Horse, Elk, and Bison Using Preferred Attributes Elicitation and Check-All-That-Apply Methods. J. Food Sci. 2019, 84, 3009–3017.
- Ares, G.; Antúnez, L.; de Saldamando, L.; Giménez, A. Polarized Sensory Positioning. In Descriptive Analysis in Sensory Evaluation; Kemp, S.E., Hort, J., Hollowood, T., Eds.; John Wiley & Sons Ltd.: Hoboken, NJ, US, 2018; pp. 561–577.
- Lawless, H.T.; Clatter, S. Consistency of Multidimensional Scaling Models Derived from Odor Sorting. J. Sens. Stud. 1990, 5, 217–230.
- Hamilton, L.M.; Lahne, J. Assessment of Instructions on Panelist Cognitive Framework and Free Sorting Task Results: A Case Study of Cold Brew Coffee. Food Qual. Prefer. 2020, 83, 103889.
- López-López, A.; Sánchez-Gómez, A.H.; Montaño, A.; Cortés-Delgado, A.; Garrido-Fernández, A. Panel and Panelist Performance in the Sensory Evaluation of Black Ripe Olives from Spanish Manzanilla and Hojiblanca Cultivars. Foods 2019, 8, 562.
- Cortés-Diéguez, S.; Otero-Cerviño, C.; Rodeiro-Mougán, H.; Feijóo-Mateo, J.A. Quantitative Descriptive Analysis of Traditional Herbal and Coffee Liqueurs Made with Grape Marc Spirit (Orujo). Foods 2020, 9, 753.
- Cliceri, D.; Dinnella, C.; Depezay, L.; Morizet, D.; Giboreau, A.; Appleton, K.M.; Hartwell, H.; Monteleone, E. Exploring Salient Dimensions in a Free Sorting Task: A Cross-Country Study within the Elderly Population. Food Qual. Prefer. 2017, 60, 19–30.
- Burns, S.L.; Pen, M.P.; Saxton, A.M.; Luckett, C.R. Comparison of Triangle and Tetrad Discrimination Methodology in an Applied Manner. Food Qual. Prefer. 2018, 68, 105–112.
- Sinkinson, C. Triangle Test. In Discrimination Testing in Sensory Science; Woodhead Publishing: Duxford, UK, 2017; pp. 153–170. ISBN 9780081010099.
- Debela, H.; Belay, A. Caffeine, Invertase Enzyme, and Triangle Test Sensory Panel Used to Differentiate Coffea Arabica and Vernonia Amygdalina Honey. Food Control. 2021, 123, 107857.
- Loucks, J.N.; Eggett, D.L.; Dunn, M.L.; Steele, F.M.; Jefferies, L.K. Effect of Monetary Reward and Food Type on Accuracy and Assessment Time of Untrained Sensory Panelists in Triangle Tests. Food Qual. Prefer. 2017, 56, 119–125.
- Sanderson, T. Tetrad Test. In Discrimination Testing in Sensory Science; Elsevier Ltd: Amsterdam, The Netherlands, 2017; pp. 183–195. ISBN 9780081010099.
- Purcell, S. Duo-Trio. In Discrimination Testing in Sensory Science: A Practical Handbook; Elsevier Ltd: Amsterdam, The Netherlands, 2017; pp. 197–207. ISBN 9780081011164.
- O’Sullivan, M.G. Discrimination Testing for Reformulated Products. Salt Fat Sugar Reduct. 2020, 9, 215–226.
- Bi, J.; O’Mahony, M.; Lee, H.S. The Performance of the Dual Reference Duo-Trio (DRDT) Method Using a Balanced-Reference Mode. Food Qual. Prefer. 2016, 48, 303–313.
- Jeong, Y.N.; Kang, B.A.; Jeong, M.J.; Song, M.J.; Hautus, M.J.; Lee, H.S. Sensory Discrimination by Consumers of Multiple Stimuli from a Reference: Stimulus Configuration in A-Not AR and Constant-Ref. Duo-Trio Superior to Triangle and Unspecified Tetrad? Food Qual. Prefer. 2016, 47, 10–22.
- Vietoris, V. Dual-Standard Test. In Discrimination Testing in Sensory Science: A Practical Handbook; Elsevier Ltd: Amsterdam, The Netherlands, 2017; pp. 289–301. ISBN 9780081011164.
- Yang, Q.; Ng, M.L. Paired Comparison/Directional Difference Test/2-Alternative Forced Choice (2-AFC) Test, Simple Difference Test/Same-Different Test. In Discrimination Testing in Sensory Science: A Practical Handbook; Elsevier: Amsterdam, The Netherlands, 2017; pp. 109–134. ISBN 9780081011164.
- Bi, J.; Kuesten, C.; Lee, H.S.; O’Mahony, M. Paired Versions of Various Sensory Discrimination Forced-Choice Methods and the Same-Different Area Theorem. Food Qual. Prefer. 2018, 63, 97–106.
- Bi, J.; Kuesten, C. The Four-Interval, Two-Alternative Forced-Choice (4I2AFC): A Powerful Sensory Discrimination Method to Detect Small, Directional Changes Particularly Suitable for Visual or Manual Evaluations. Food Qual. Prefer. 2019, 73, 202–209.
- Ruark, A.; Vingerhoeds, M.H.; Kremer, S.; Vries, M.A.N.; Piqueras-Fiszman, B. Insights on Older Adults’ Perception of at-Home Sensory-Hedonic Methods: A Case of Ideal Profile Method and CATA with Ideal. Food Qual. Prefer. 2016, 53, 29–38.
- Zay, K.; Gere, A. Sensory Acceptance of Poppy Seed-Flavored White Chocolates Using Just-about-Right Method. LWT—Food Sci. Technol. 2019, 103, 162–168.
- Gere, A.; Sipos, L.; Kovács, S.; Kókai, Z.; Héberger, K. Case Study Using Sum of Ranking Differences. Chemom. Intell. Lab. Syst. 2017, 161, 130–135.
- Liu, N.; Nguyen, H.; Wismer, W.; Temelli, F. Development of an Orange-Flavoured Functional Beverage Formulated with Beta-Glucan and Coenzyme Q10-Impregnated Beta-Glucan. J. Funct. Foods 2018, 47, 397–404.
- Kim, M.A.; van Hout, D.; Dessirier, J.M.; Lee, H.S. Degree of Satisfaction-Difference (DOSD) Method for Measuring Consumer Acceptance: A Signal Detection Measurement with Higher Reliability than Hedonic Scaling. Food Qual. Prefer. 2018, 63, 28–37.
- Hu, X.; Lee, J. Emotions Elicited While Drinking Coffee: A Cross-Cultural Comparison between Korean and Chinese Consumers. Food Qual. Prefer. 2019, 76, 160–168.
- Betancur, M.I.; Motoki, K.; Spence, C.; Velasco, C. Factors Influencing the Choice of Beer: A Review. Food Res. Int. 2020, 137, 109367.
- Verdonk, N.; Ristic, R.; Culbert, J.; Pearce, K.; Wilkinson, K. Understanding Australian Wine Consumers’ Preferences for Different Sparkling Wine Styles. Beverages 2020, 6, 14.
- Dorado, R.; Picard, A.; Chaya, C. Influence of First Position Effect on Emotional Response. Food Qual. Prefer. 2016, 49, 189–196.
- Adjei, M.Y.B.; Saliba, A.J.; Carr, T.; Hardie, W.J.; Heymann, H. Relative Preference Mapping (RPM)—A Novel Approach for Simultaneous 2D Relative Scoring of Difference and Liking to Identify Consumer Preference for Innovative Wine Styles. Food Qual. Prefer. 2020, 83, 103901.
- Ristic, R.; Danner, L.; Johnson, T.E.; Meiselman, H.L.; Hoek, A.C.; Jiranek, V.; Bastian, S.E.P. Wine-Related Aromas for Different Seasons and Occasions: Hedonic and Emotional Responses of Wine Consumers from Australia, UK, and the USA. Food Qual. Prefer. 2019, 71, 250–260.
- Gmuer, A.; Siegrist, M.; Dohle, S. Does Wine Label Processing Fluency Influence Wine Hedonics? Food Qual. Prefer. 2015, 44, 12–16.
- Danner, L.; Johnson, T.E.; Ristic, R.; Meiselman, H.L.; Bastian, S.E.P. “I like the Sound of That!” Wine Descriptions Influence Consumers’ Expectations, Liking, Emotions, and Willingness to Pay for Australian White Wines. Food Res. Int. 2017, 99, 263–274.
- Danner, L.; Ristic, R.; Johnson, T.E.; Meiselman, H.L.; Hoek, A.C.; Jeffery, D.W.; Bastian, S.E.P. Context and Wine Quality Effects on Consumers’ Mood, Emotions, Liking and Willingness to Pay for Australian Shiraz Wines. Food Res. Int. 2016, 89, 254–265.
- Ares, G. Methodological Issues in Cross-Cultural Sensory and Consumer Research. Food Qual. Prefer. 2018, 64, 253–263.
- Calvo-Porral, C.; Ruiz-Vega, A. An Emotion-Based Typology of Wine Consumers. Food Qual. Prefer. 2020, 79, 103777.
- Jiang, W.W.; Niimi, J.; Ristic, R.; Bastian, S.E.P. Effects of Immersive Context and Wine Flavor on Consumer Wine Flavor Perception and Elicited Emotions. Am. J. Enol. Vitic. 2017, 68, 1–10.
- Silva, A.P.; Jager, G.; van Bommel, R.; van Zyl, H.; Voss, H.P.; Hogg, T.; Pintado, M.; de Graaf, C. Functional or Emotional? How Dutch and Portuguese Conceptualise Beer, Wine, and Non-Alcoholic Beer Consumption. Food Qual. Prefer. 2016, 49, 54–65.
- Mora, M.; Urdaneta, E.; Chaya, C. Effect of Personality on the Emotional Response Elicited by Wines. Food Qual. Prefer. 2019, 76, 39–46.
- Danner, L.; Johnson, T.E.; Ristic, R.; Meiselman, H.L.; Bastian, S.E.P. Consumption Context Effects on Fine Wine Consumer Segments’ Liking and Emotions. Foods 2020, 9, 1798.
- Nguyen, Q.C.; Varela, P. Identifying Temporal Drivers of Liking and Satiation Based on Temporal Sensory Descriptions and Consumer Ratings. Food Qual. Prefer. 2021, 89, 104143.
- Pierguidi, L.; Spinelli, S.; Monteleone, E.; Dinnella, C. The Combined Use of Temporal Dominance of Sensations (TDS) and Discrete Time-Intensity (DTI) to Describe the Dynamic Sensory Profile of Alcoholic Cocktails. Food Qual. Prefer. 2021, 93, 104281.
- Chaya, C.; Criado, C.; Pozo-Bayón, M.Á.; Echevarrías-Marco, A.; Dupas, A.; Matos, D. A New Index for Predicting Differences in Repeatability of Time-Intensity Curves: Time-Intensity Reliability Index (TI-RI). Food Qual. Prefer. 2019, 76, 33–38.
- Lyu, J.; Chen, S.; Nie, Y.; Xu, Y.; Tang, K. Aroma Release during Wine Consumption: Factors and Analytical Approaches. Food Chem. 2021, 346, 128957.
- Silva, A.P.; Voss, H.P.; van Zyl, H.; Hogg, T.; de Graaf, C.; Pintado, M.; Jager, G. Effect of Adding Hop Aroma in Beer Analysed by Temporal Dominance of Sensations and Emotions Coupled with Temporal Liking. Food Qual. Prefer. 2019, 75, 54–63.
- Frost, S.C.; Blackman, J.W.; Ebeler, S.E.; Heymann, H. Analysis of Temporal Dominance of Sensation Data Using Correspondence Analysis on Merlot Wine with Differing Maceration and Cap Management Regimes. Food Qual. Prefer. 2018, 64, 245–252.
- Olegario, L.S.; González-Mohino, A.; Estévez, M.; Madruga, M.S.; Ventanas, S. Impact of ‘Free-from’ and ‘Healthy Choice’ Labeled Versions of Chocolate and Coffee on Temporal Profile (Multiple-Intake TDS) and Liking. Food Res. Int. 2020, 137, 109342.
- Wakihira, T.; Miyashita, S.; Kobayashi, M.; Uemura, K.; Schlich, P. Temporal Dominance of Sensations Paired with Dynamic Wanting in an Ad Libitum Setting: A New Method of Sensory Evaluation with Consumers for a Better Understanding of Beer Drinkability. Food Qual. Prefer. 2020, 86, 103992.
- Chaya, C. Continuous Time—Intensity. In Time-Dependent Measures of Perception in Sensory Evaluation; Hort, J., Kemp, S.E., Hollowood, T., Eds.; John Wiley & Sons Ltd.: Hoboken, NJ, USA, 2017.
- Lorido, L.; Hort, J.; Estévez, M.; Ventanas, S. Reporting the Sensory Properties of Dry-Cured Ham Using a New Language: Time Intensity (TI) and Temporal Dominance of Sensations (TDS). Meat Sci. 2016, 121, 166–174.
- Van Bommel, R.; Stieger, M.; Boelee, N.; Schlich, P.; Jager, G. From First to Last Bite: Temporal Dynamics of Sensory and Hedonic Perceptions Using a Multiple-Intake Approach. Food Qual. Prefer. 2019, 78, 103748.
- Greis, M.; Sainio, T.; Katina, K.; Kinchla, A.J.; Nolden, A.; Partanen, R.; Seppä, L. Dynamic Texture Perception in Plant-Based Yogurt Alternatives: Identifying Temporal Drivers of Liking by TDS. Food Qual. Prefer. 2020, 86, 104019.
- Thomas, A.; Chambault, M.; Dreyfuss, L.; Gilbert, C.C.; Hegyi, A.; Henneberg, S.; Knippertz, A.; Kostyra, E.; Kremer, S.; Silva, A.P.; et al. Measuring Temporal Liking Simultaneously to Temporal Dominance of Sensations in Several Intakes. An Application to Gouda Cheeses in 6 European Countries. Food Res. Int. 2017, 99, 426–434.
- Peltier, C.; Visalli, M.; Thomas, A. Using Temporal Dominance of Emotions at Home. Impact of Coffee Advertisements on Consumers’ Behavior and Methodological Perspectives. Food Qual. Prefer. 2019, 71, 311–319.
- Merlo, T.C.; Soletti, I.; Saldaña, E.; Menegali, B.S.; Martins, M.M.; Clara, A.; Teixeira, B.; Harada-Padermo, S.S.; Dargelio, M.D.B.; Contreras-Castillo, C.J. Measuring Dynamics of Emotions Evoked by the Packaging Colour of Hamburgers Using Temporal Dominance of Emotions (TDE). Food Res. Int. 2019, 124, 147–155.
- Van Bommel, R.; Stieger, M.; Visalli, M.; de Wijk, R.; Jager, G. Does the Face Show What the Mind Tells? A Comparison between Dynamic Emotions Obtained from Facial Expressions and Temporal Dominance of Emotions (TDE). Food Qual. Prefer. 2020, 85, 103976.
- Rocha, C.; Lima, R.C.; Moura, A.P.; Costa, T.; Cunha, L.M. Implicit Evaluation of the Emotional Response to Premium Organic Herbal Infusions through a Temporal Dominance Approach: Development of the Temporal Dominance of Facial Emotions (TDFE). Food Qual. Prefer. 2019, 76, 71–80.
- Van Bommel, R.; Stieger, M.; Schlich, P.; Jager, G. Dutch Consumers Do Not Hesitate: Capturing Implicit ‘No Dominance’ Durations Using Hold-down Temporal Dominance Methodologies for Sensations (TDS) and Emotions (TDE). Food Qual. Prefer. 2019, 71, 332–342.
- Castura, J.C.; Antúnez, L.; Giménez, A.; Ares, G. Temporal Check-All-That-Apply (TCATA): A Novel Dynamic Method for Characterizing Products. Food Qual. Prefer. 2016, 47, 79–90.
- Janice, Q.; Niaura, T.; Kantono, K. How Does Wine Ageing Influence Perceived Complexity? Temporal-Choose-All-That-Apply (TCATA) Reveals Temporal Drivers of Complexity in Experts and Novices. Food Qual. Prefer. 2021, 92, 104230.
- Mendel-Marabolí, M.; López-Solís, R.; Valenzuela-Prieto, D.; Vargas-Silva, S.; Obreque-Slier, E. Limited Relationship between Temporality of Sensory Perception and Phenolic Composition of Red Wines. LWT—Food Sci. Technol. 2021, 142, 111028.
- Mahieu, B.; Visalli, M.; Thomas, A.; Schlich, P. Using Free-Comment with Consumers to Obtain Temporal Sensory Descriptions of Products. Food Qual. Prefer. 2020, 86, 104008.
- Le Menn, N.; Marchal, R.; Demarville, D.; Casenave, P.; Tempere, S.; Campbell-Sills, H.; de Revel, G.; Marchand, S. Development of a New Sensory Analysis Methodology for Predicting Wine Aging Potential. Application to Champagne Reserve Wines. Food Qual. Prefer. 2021, 94, 104316.
This entry is offline, you can click here to edit this entry!