Your browser does not fully support modern features. Please upgrade for a smoother experience.
Please note this is an old version of this entry, which may differ significantly from the current revision.
Subjects:
Agriculture, Dairy & Animal Science
Banana Fusarium wilt (BFW), which is a soilborne fungal disease caused by the fungus Fusarium oxysporum f. sp. cubense race 4 (Foc 4) is the most devastating disease of bananas. It can occur in the whole growth period and spread fast.
- Banana Fusarium wilt disease
- Hotspot Analysis
- multispectral image
1. Introduction
Banana (Musa spp.) is one of the most important food crops in the world and the source of income in many developing countries, such as China, India, Brazil, Philippines, Venezuela, some African countries, and so on [1][2][3]. It is also one of the largest herbaceous flowering plants [4]. It is normally tall and fairly sturdy, often mistaken for trees. However, what appears to be a trunk is actually a pseudo-stem, which is formed by the tightly packed leaf sheaths. All the above-ground parts grow from a corm in the soil (Figure 1A). The flower emerges out from the center of the pseudo-stem right after the last leaf. The mother plant will wither after the banana is harvested, but the offshoots or suckers will grow up and continue to produce fruits next year[5]. Farmers usually keep 1–2 banana suckers for the coming year or generation, and the canopy of the mother plant will be chopped off to make the remaining nutrition in the pseudo-stem feeding the suckers [6].
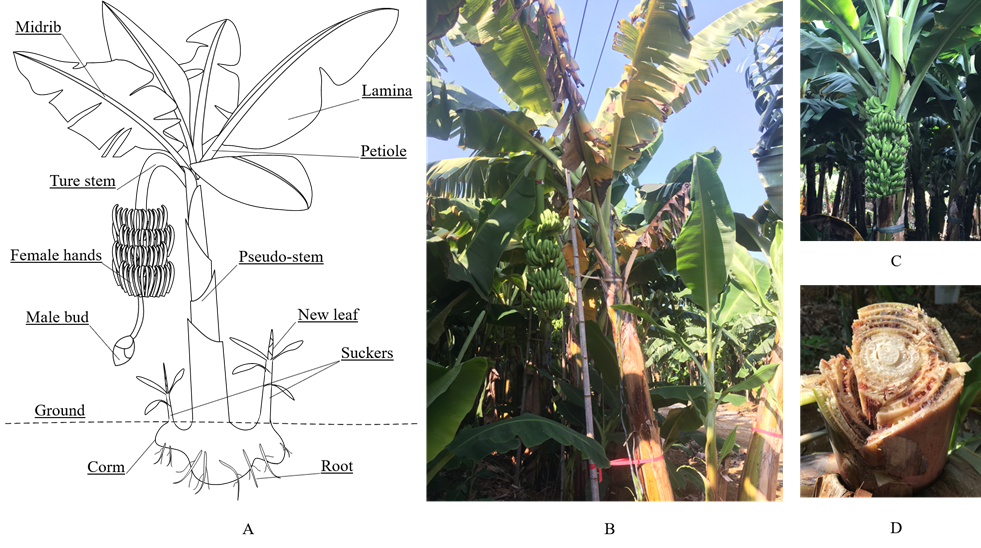
Figure 1. Schematic diagram of the banana plant and the images of BFW-infected plants: (A) The schematic diagram of the banana plant; (B) An image of BFW-infected banana plant; (C) The fruit of a BFW-infected banana; (D) The pseudo-stem of a BFW-infected banana.
The frequent occurrence of diseases has seriously affected the development of banana plantations. Banana Fusarium wilt (BFW, Figure 1B–D), which is a soilborne fungal disease caused by the fungus Fusarium oxysporum f. sp. cubense race 4 (Foc 4) is the most devastating disease of bananas. It can occur in the whole growth period and spread fast.
Pegg et al. found that on day 12, after banana plantlets were inoculated with Foc 4, the edges of banana leaves turned yellow; one month after inoculation, 70% of the plants were dead or dying [7]. Generally, the yield has 20–40% reduction for mildly infected fields and 90–100% reduction for seriously infected fields [8][9]. As there is no cure for BFW, severely infected banana plantations must switch to other crops. A BFW-infected banana plantation needs proper and dynamic evaluation of its degree of infection to give farmers the best decision on where and when to abandon banana planting. Farmers usually make their decisions based on man inspection, which is labor-intensive and greatly dependent on farmers’ experiences [10]. The temporal and spatial evaluation accuracies based on man inspection cannot be assured because of the usually large area of banana plantations. So, it is of great importance to timely and accurately monitor the occurrence of the disease and map the spatial distribution in a more effective way. The emergence of UAV technology provides an efficient means for large-scale, rapid, and accurate monitoring of crop diseases and insect pests [11].
Over the past 20 years, UAVs have been widely used in agriculture. UAVs can be equipped with RGB, multispectral, or hyperspectral sensors for the rapid acquisition of high-resolution images [12][13]. Due to their obvious lower cost and higher resolution than the hyperspectral sensors, multispectral and RGB sensors are more widely selected to be integrated on UAV systems to identify field diseases [14]. Kerkech et al., identified vine diseases using UAV-based RGB images [15]. Ishengoma et al., identified maize leaves infected by fall armyworms using UAV-based RGB images [16]. RGB images can provide rich color and texture features due to their relatively higher spatial resolution, but the spectral information provided is limited as the band number is only three, the band wavelength is mainly in the visible range, and the bandwidth is wide. More complex methods were usually adopted to monitor plant diseases based on RGB images to make up for the scarcity of image features. However, these methods are usually slow and involve supervised labeling to obtain precise data. In contrast, multispectral sensors can provide more subtle spectral information not only in the RGB bands but also in the red edge (RE) and near-infrared (NIR) bands. Researchers performed the identification and evaluation of various plant diseases from UAV-based multispectral imagery, including citrus greening disease [17], potato late blight [18], wheat yellow rust [19], and so on. However, comprehensive research on BFW monitoring is rarely reported. Selvaraj et al. classified banana bunchy top disease and Xanthomonas wilt disease from the healthy banana plants through pixel-based classifications from UAV multispectral imagery [1]. Ye et al., conducted a preliminary study on detection of BFW from UAV-based multispectral images; a few randomly selected samples were investigated as ground truth, and the performance of several machine learning methods including the logistic regression (LR) (overall accuracy (OA) = 80%) support vector machine (SVM) (OA = 91.4%), Random Forest (RF) (OA = 90.0%) and Artificial Neural Network (ANN) (OA = 91.1%) were evaluated, but more comprehensive ground investigation needs to be conducted to produce more convincing results [20][21].
At present, machine learning methods are commonly used in plant diseases’ identification based on multispectral images. Su et al. [19] used statistical dependency analysis via mutual information to select the sensitive bands and vegetation indices (VIs) for disease severity estimation of wheat yellow rust. Red and NIR were determined as the sensitive bands, and their derived normalized difference vegetation indices (NDVI) provided better monitoring results in the early and middle stages of wheat yellow rust. Lan et al. [17] evaluated the accuracies of several machine learning methods including LR (OA = 72.20%), SVM (OA = 79.76%), naive Bayes (OA = 80.03%), K-Nearest Neighbor (KNN) (OA = 81.27%), Neural Network (OA = 97.22%), and AdaBoost (OA = 100%) to detect citrus greening disease from UAV-based multispectral images, and it concluded that AdaBoost and neural network approaches had strong robustness and the best classification results although they took relatively long computing time. Isip et al. [22] detected twister disease using an unsupervised classification method named Iterative Self-Organizing Data Analysis Technique Algorithm (ISODATA) based on eight VIs, and the results showed that green normalized difference vegetation index (GNDVI), pigment specific simple ratio for chlorophyll a (PSSRa), and NDVI obtained the highest OAs of 83.33%, 80.95%, and 78.57%, respectively.
Different methods and different inputs usually produce different classification results; even one specific classification method could produce different results with different man interventions, especially for the supervised methods [17][18][19][20][21][23]. Therefore, it is necessary to adapt the images and methods to improve the classification accuracy [23]. Supervised models need to build feature libraries manually, and the selection of features is affected by subjective factors. In addition, supervised models need to be trained for specific sample data. If the data characteristics change significantly (for example, the image characteristics are greatly changed by factors such as light and time), the adaptability of the models may be greatly reduced. The vegetation index is one of the methods to enhance spectral features and reduce environmental influence. Unsupervised methods can significantly reduce or even eliminate the effects of the above factors; hence, unsupervised methods are worth trying for classification.
2. Reflectance Difference of the Healthy and BFW-Infected Canopies
The spectral reflectance between the healthy and BFW-infected libraries are shown in Figure 7. From the box plots, it can be seen that the boxes which represent the middle half of the datasets had small overlaps for most of the bands, especially for the red and NIR bands, indicating an obvious difference existed between the two classes, but the difference was much less obvious at blue and RE band. Moreover, the reflectance distribution of each band in August was wider than that in July, indicating that with the development of the disease, the spectral characteristics showed more variation. The average reflectance represented by the dashed lines tells a clearer difference between the two classes: the BFW-infected class had higher reflectance at the visible region, but lower reflectance at the NIR region than the healthy one.
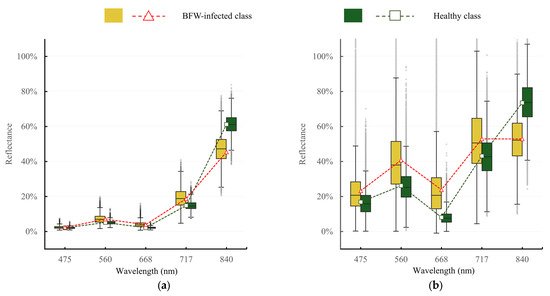
Figure 7. The spectral reflectance between the healthy and BFW-infected libraries at different stages: (a) Result in July; (b) Result in August.
3. Feature Analyzing of the Selected VIs
The histograms of the selected VIs of the healthy and BFW-infected classes are plotted in Figure 8. All VIs had obvious distribution differences between the two classes. The average value of the healthy class was significantly higher than that of the infected class. The first quantile of the healthy class, the third quantile of the infected class, and their ratio were calculated for quantitative comparison. The results showed that, except for ARI1, the quantile ratios were 100% to 150% in July, and 130% to 200% in August.
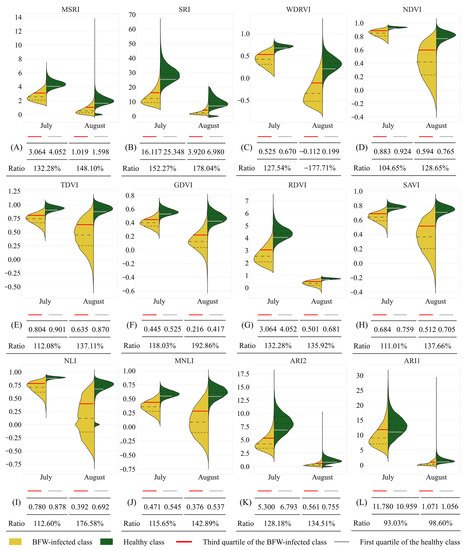
Figure 8. Value distribution of different VIs. Ratio means the first quartile of the healthy class to the third quartile of the BFW-infected class. (A) The histogram of MSRI; (B) The histogram of SRI; (C) The histogram of WDRVI; (D) The histogram of NDVI; (E) The histogram of TDVI; (F) The histogram of GDVI; (G) The histogram of RDVI; (H) The histogram of ASVI; (I) The histogram of NLI; (J) The histogram of MNLI; (K) The histogram of ARI2; (L) The histogram of ARI1.
5. Spectral Features of BFW Disease
The finding in Figure 7 that BFW-infected class had higher reflectance at the visible region, but lower reflectance at the NIR region than the healthy one, was consistent with the spectral change trend of the green plants: the healthier in growth condition, the lower the reflectance in the visible region, and the higher the reflectance in the NIR region [24]. BFW disease normally starts to spread in June and develops fast in August. In the beginning, the secondary metabolites secreted by the pathogen began to destroy the cell structure, but the water balance and pigment structure of the leaves have not been significantly destroyed; therefore, the spectral reflectance does not change much at this stage. By August, with the accumulation of fusaric acid, the cell membranes and chloroplasts of banana leaves were severely damaged, a large amount of leaf water was lost, and the infection area on the leaves expanded rapidly. So the spectral difference between the healthy and BFW-infected canopies is more significant in August than that in July.
VI is an enhancement of original spectral reflectance. Most of the VIs had obvious differences between the two classes for both periods as shown in Figure 8, except ARI1. The main reason was that most of the selected VIs were calculated from the values at the NIR, red, or green band, which had obvious differences between the two classes, but ARI1 was calculated from the values at the green and RE band which had less difference between the two classes. For all the VIs, the heathy class had higher values than the BFW- infected class, and the ratios of the first quantile of the healthy class to the third quantile of the infected class were mostly larger than 100%, which meant that more than 75% of the pixels can be correctly divided with proper thresholds. Moreover, the differences in August were more significant than in July, which was consistent with the previous description that August had more obvious disease symptoms than July.
This entry is adapted from the peer-reviewed paper 10.3390/rs14051231
References
- Selvaraj, M.G.; Vergara, A.; Montenegro, F.; Alonso Ruiz, H.; Safari, N.; Raymaekers, D.; Ocimati, W.; Ntamwira, J.; Tits, L.; Omondi, A.B.; et al. Detection of banana plants and their major diseases through aerial images and machine learning methods: A case study in DR Congo and Republic of Benin. ISPRS J. Photogramm. Remote Sens. 2020, 169, 110–124.
- Olivares, B.O.; Rey, J.C.; Lobo, D.; Navas-Cortés, J.A.; Gómez, J.A.; Landa, B.B. Fusarium wilt of bananas: A review of agro-environmental factors in the Venezuelan production system affecting its development. Agronomy 2021, 11, 986.
- Ploetz, R.C. Management of Fusarium wilt of banana: A review with special reference to tropical race 4. Crop Prot. 2015, 73, 7–15.
- Hai-Jun Liu; Shabtai Cohen; Josef Tanny; Jorge Hugo Lemcoff; Guanhua Huang; Transpiration estimation of banana (Musa sp.) plants with the thermal dissipation method. Plant and Soil 2008, 308, 227-238, 10.1007/s11104-008-9622-4.
- André Drenth; Gerrit Haatje Jan Kema; The Vulnerability of Bananas to Globally Emerging Disease Threats. Phytopathology® 2021, 111, 2146-2161, 10.1094/phyto-07-20-0311-rvw.
- Niranjan Panigrahi; Andrew J. Thompson; Sergio Zubelzu; Jerry W. Knox; Identifying opportunities to improve management of water stress in banana production. Scientia Horticulturae 2020, 276, 109735, 10.1016/j.scienta.2020.109735.
- Pegg, K.G.; Coates, L.M.; O’Neill, W.T.; Turner, D.W. The epidemiology of Fusarium wilt of banana. Front. Plant Sci. 2019, 10, 1395.
- Blomme, G.; Dita, M.; Jacobsen, K.S.; Vicente, L.P.; Molina, A.; Ocimati, W.; Poussier, S.; Prior, P. Bacterial diseases of bananas and enset: Current state of knowledge and integrated approaches toward sustainable management. Front. Plant Sci. 2017, 8, 1290.
- Nakkeeran, S.; Rajamanickam, S.; Saravanan, R.; Vanthana, M.; Soorianathasundaram, K. Bacterial endophytome-mediated resistance in banana for the management of Fusarium wilt. 3 Biotech 2021, 11, 267.
- Mahlein, A.K. Plant disease detection by imaging sensors-parallels and specific demands for precision agriculture and plant phenotyping. Plant Dis. 2016, 100, 241–251.
- Zhong, C.Y.; Hu, Z.L.; Li, M.; Li, H.L.; Yang, X.J.; Liu, F. Real-time semantic segmentation model for crop disease leaves using group attention module. Trans. Chin. Soc. Agric. 2021, 37, 208–215, (In Chinese with English abstract).
- Zhou, J.; Zhou, J.; Ye, H.; Ali, M.L.; Nguyen, H.T.; Chen, P. Classification of soybean leaf wilting due to drought stress using UAV-based imagery. Comput. Electron. Agric. 2020, 175, 105576.
- Deng, X.; Zhu, Z.; Yang, J.; Zheng, Z.; Huang, Z.; Yin, X.; Wei, S.; Lan, Y. Detection of citrus Huanglongbing based on multi-input neural network model of UAV hyperspectral remote sensing. Remote Sens. 2020, 12, 2678.
- Xie, C.; Yang, C. A review on plant high-throughput phenotyping traits using UAV-based sensors. Comput. Electron. Agric. 2020, 178, 105731.
- Kerkech, M.; Hafiane, A.; Canals, R. Deep leaning approach with colorimetric spaces and vegetation indices for vine diseases detection in UAV images. Comput. Electron. Agric. 2018, 155, 237–243.
- Ishengoma, F.S.; Rai, I.A.; Said, R.N. Identification of maize leaves infected by fall armyworms using UAV-based imagery and convolutional neural networks. Comput. Electron. Agric. 2021, 184, 106124.
- Lan, Y.; Huang, Z.; Deng, X.; Zhu, Z.; Huang, H.; Zheng, Z.; Lian, B.; Zeng, G.; Tong, Z. Comparison of machine learning methods for citrus greening detection on UAV multispectral images. Comput. Electron. Agric. 2020, 171, 105234.
- Rodríguez, J.; Lizarazo, I.; Prieto, F.; Angulo-Morales, V. Assessment of potato late blight from UAV-based multispectral imagery. Comput. Electron. Agric. 2021, 184, 106061.
- Su, J.; Liu, C.; Hu, X.; Xu, X.; Guo, L.; Chen, W.H. Spatio-temporal monitoring of wheat yellow rust using UAV multispectral imagery. Comput. Electron. Agric. 2019, 167, 105035.
- Ye, H.; Huang, W.; Huang, S.; Cui, B.; Dong, Y.; Guo, A.; Ren, Y.; Jin, Y. Recognition of banana Fusarium wilt based on UAV remote sensing. Remote Sens. 2020, 12, 938.
- Ye, H.; Huang, W.; Huang, S.; Cui, B.; Dong, Y.; Guo, A.; Ren, Y.; Jin, Y. Identification of banana Fusarium wilt using supervised classification algorithms with UAV-based multi-spectral imagery. Int. J. Agric. Biol. Eng. 2020, 13, 136–142.
- Isip, M.F.; Alberto, R.T.; Biagtan, A.R. Exploring vegetation indices adequate in detecting twister disease of onion using Sentinel-2 imagery. Spat. Inf. Res. 2020, 28, 369–375.
- Lu, D.; Weng, Q. A survey of image classification methods and techniques for improving classification performance. Int. J. Remote Sens. 2007, 28, 823–870.
- Gitelson, A.A.; Merzlyak, M.N. Signature analysis of leaf reflectance spectra: Algorithm development for remote sensing of chlorophyll. J. Plant Physiol. 1996, 148, 494–500.
This entry is offline, you can click here to edit this entry!