Perennial herb Solidago canadensis L. (Asteraceae: Astereae), originating in North America, was brought and introduced into middle Europe as an ornamental, schizanthus, and melliferous plant in the middle of the 18th century. In the end, it unintentionally spread from the gardens to the natural environment.
- Canadian goldenrod
- morphological traits
- essential oil productivity
- management
1. Introduction
- -
-
the production of a high number of small, light-winged seeds, spreading mostly by the air, germinating rapidly in the high percentage and, with a wide tolerance for the different values of soil reaction, salinity, and moisture;
- -
-
robust asexual reproductive ability of the underground parts (rhizomes, nodes, stem bases), hereby just a naturalized population has a great capacity for a clonal growth, since the clonality is in general concurrently found to offer advantages that facilitate invasion [5];
- -
- -
2. Morphological Traits
| Morphological Traits | A Category 75–100% (Heavy Degree of Invasion) | |||||
|---|---|---|---|---|---|---|
| May/June | June/July | August | September | October | ||
| Plant height (cm) | *** | 100.5 ± 14.5 | 139.8 ± 14.9 * | 167.8 ± 20.2 * | 167.5 ± 22.3 | 159.4 ± 30.9 |
| Entire plant weight (g) | * | 35.2 ± 10.1 * | 47.8 ± 16.3 | 55.1 ± 17.1 | 67.3 ± 34.9 | 62.5 ± 22.2 |
| Relative water content of entire plant (%) | 75.6 ± 6.6 | 61.7 ± 3.6 | 58.6 ± 1.3 | 55.9 ± 1.2 | 57.9 ± 2.4 º | |
| Stem length (cm) | *** | 100.5 ± 14.5 | 139.8 ± 14.9 * | 132.7 ± 12.9 * | 131.4 ± 11.6 * | 129.4 ± 24.9 |
| Stem weight (g) | *** | 21.9 ± 6.3 * | 29.3 ± 11.0 * | 19.9 ± 8.6 * | 9.9 ± 1.8 | 12.7 ± 4.8 * |
| Stem relative water content (%) | 72.8 ± 8.3 | 59.2 ± 3.6 | 53.8 ± 1.8 º | 47.9 ± 3.5 | 51.7 ± 1.9 | |
| Number of all leaves | * | 52.4 ± 8.3 | 93.8 ± 7.1 | 76.4 ± 10.4 º | 67.0 ± 8.2 | 62.0 ± 17.7 |
| Weight of all leaves (g) | ** | 12.9 ± 3.9 | 18.2 ± 5.6 | 12.8 ± 3.9 | 11.4 ± 3.6 | 14.3 ± 8.6 |
| Weight of a single leaf (g) | ** | 0.2 ± 0.05 | 0.2 ± 0.06 | 0.2 ± 0.04 | 0.2 ± 0.08 | 0.2 ± 0.12 |
| Relative water content of all leaves (%) | * | 35.2 ± 10.1 * | 47.8 ± 16.3 | 55.1 ± 17.1 | 67.3 ± 34.9 | 62.5 ± 22.2 |
| Number of assimilating, green, leaves | 43.0 ± 8.9 | 70.3 ± 7.3 | 60.9 ± 2.4 | 60.1 ± 5.9 º | 44.9 ± 16.1 | |
| Weight of assimilating, green, leaves (g) | ** | 11.9 ± 3.7 | 16.9 ± 5.6 | 11.9 ± 3.4 | 10.8 ± 3.4 | 12.4 ± 8.6 |
| Weight of a single assimilating, green, leaf (g) | ** | 0.3 ± 0.1 | 0.2 ± 0.1 | 0.2 ± 0.1 | 0.2 ± 0.1 | 0.3 ± 0.1 |
| Relative water content of assimilating, green, leaves (%) | ** | 75.1 ± 4.0 | 67.9 ± 3.1 | 64.9 ± 3.1 | 65.6 ± 0.8 *** | 66.2 ± 4.5 |
| Number of non-assimilating, brown, leaves | * | 9.3 ± 0.8 | 23.5 ± 5.0 * | 15.6 ± 8.0 | 6.9 ± 3.7 | 17.1 ± 10.6 |
| Weight of non-assimilating, brown, leaves (g) | ** | 0.9 ± 0.4 * | 1.3 ± 0.4 * | 0.8 ± 0.5 | 0.6 ± 0.4 | 1.9 ± 0.9 |
| Weight of single non-assimilating, brown, leaf (g) | 0.1 ± 0.42 | 0.06 ± 0.01 | 0.05 ± 0.02 | 0.09 ± 0.03 | 0.1 ± 0.05 | |
| Relative water content of non-assimilating, brown, leaves (%) | 59.8 ± 16.9 | 36.9 ± 8.8 | 37.3 ± 7.3 | 55.4 ± 12.9 | 50.2 ± 14.3 | |
| Inflorescence length (cm) | - | - | 35.2 ± 7.9 | 36.1 ± 10.9 | 29.9 ± 7.2 | |
| Inflorescence weight (g) | - | - | 11.1 + 4.4 | 22.6 ± 14.9 | 16.9 ± 7.9 | |
| Inflorescence relative water content (%) | * | - | - | 65.5 + 3.1 | 68.8 ± 4.2 * | 64.8 ± 3.3 |
| Stem EO yield (mg/kg) | ** | 0.7 ± 0.8 | 6.2 ± 5.7 | 4.7 ± 4.0 | 12.3 ± 13.8 * | 7.8 ± 4.6 ** |
| Leaf EO yield (mg/kg) | * | 1.9 ± 2.5 | 5.9 ± 6.2 | 3.5 ± 2.9 * | 17.9 ± 10.7 ** | 248.3 ± 29.7 ** |
| Inflorescence EO yield (mg/kg) | - | - | 6.7 ± 9.3 | 20.9 ± 10.4 | 18.5 ± 6.7 *,º | |
| Morphological Traits | B Category 50–75% (Middle Degree of Invasion) | |||||
|---|---|---|---|---|---|---|
| May/June | June/July | August | September | October | ||
| Plant height (cm) | °° | 95.2 ± 8.9 | 121.8 ± 11.6 | 162.9 ± 6.8 ° | 146.9 ± 13.3 | 140.9 ± 22.4 |
| Entire plant weight (g) | 32.3 ± 5.9 ° | 42.0 ± 8.5 | 60.5 ± 13.8 | 59.1 ± 25.5 | 45.3 ± 9.3 | |
| Relative water content of entire plant (%) | 73.2 ± 3.4 | 61.2 ± 2.6 | 56.9 ± 1.8 | 55.9 ± 6.5 | 49.6 ± 6.2 ° | |
| Stem length (cm) | °°° | 95.2 ± 8.9 | 121.8 ± 11.6 | 127.7 ± 3.2 ° | 115.9 ± 10.1 | 110.4 ± 17.3 |
| Stem weight (g) | °°° | 19.5 ± 3.0 ° | 24.3 ± 5.5 | 18.9 ± 2.7 °° | 10.1 + 2.3 | 11.9 ± 6.0 |
| Stem relative water content (%) | 72.8 ± 8.3 | 59.2 ± 3.6 | 53.8 ± 1.8 ° | 47.9 ± 3.5 | 51.7 ± 1.9 | |
| Number of all leaves | °°° | 50.3 ± 8.4 | 89.5 ± 12.4 | 89.2 ± 7.3 °° | 79.8 ± 6.6 ° | 68.4 ± 11.1 |
| Weight of all leaves (g) | °° | 13.1 ± 5.6 ° | 17.2 ± 2.9 | 15.5 ± 1.7 °° | 11.5 ± 3.1 | 8.9 ± 4.1 |
| Weight of a single leaf (g) | 0.3 ± 0.01 °° | 0.2 ± 0.02 ° | 0.2 ± 0.01 | 0.2 ± 0.04 | 0.1 ± 0.04 | |
| Relative water content of all leaves (%) | 32.3 ± 5.9 ° | 42.0 ± 8.5 | 60.5 ± 13.8 | 59.1 ± 25.5 | 45.3 ± 9.3 | |
| Number of assimilating, green, leaves | 44.0 ± 6.9 | 67.6 ± 8.8 | 69.3 ± 3.5 °° | 68.1 ± 3.4 ° | 48.1 ± 23.9 | |
| Weight of assimilating, green, leaves (g) | ° | 12.4 ± 2.7 ° | 15.9 ± 2.9 | 13.9 ± 1.6 °° | 10.5 ± 3.0 | 7.4 ± 4.9 |
| Weight of a single assimilating, green, leaf (g) | 0.3 ± 0.02 °° | 0.2 ± 0.02 ° | 0.2 ± 0.02 | 0.2 ± 0.05 | 0.2 ± 0.04 | |
| Relative water content of assimilating, green, leaves (%) | 75.4 ± 1.4 | 67.1 ± 1.7 | 63.1 ± 1.7 | 61.8 ± 3.4 | 64.2 ± 2.4 | |
| Number of non-assimilating, brown, leaves | °° | 7.2 ± 0.5 | 21.9 ± 4.4 ° | 19.9 ± 9.3 ° | 11.8 ± 9.1 | 20.3 ± 13.9 |
| Weight of non-assimilating, brown, leaves (g) | ° | 0.7 ± 0.3 ° | 1.3 ± 0.1 °° | 1.6 ± 0.9 ° | 1.04 ± 0.7 | 1.5 ± 1.2 |
| Weight of single non-assimilating, brown, leaf (g) | 0.09 ± 0.03 ° | 0.06 ± 0.01 ° | 0.08 ± 0.03 | 0.10 ± 0.03 | 0.07 ± 0.01 | |
| Relative water content of non-assimilating, brown, leaves (%) | 65.9 ± 8.7 | 42.5 ± 8.5 | 44.2 ± 11.4 | 49.5 ± 9.6 | 39.7 ± 1.3 | |
| Inflorescence length (cm) | - | - | 35.2 ± 5.6 | 31.4 ± 7.8 | 30.6 ± 7.3 | |
| Inflorescence weight (g) | - | - | 13.7 ± 8.3 | 18.5 ± 10.2 | 12.1 ± 2.9 | |
| Inflorescence relative water content (%) | - | - | 66.5 ± 2.5 | 64.9 ± 2.5 | 62.4 ± 3.6 | |
| Stem EO yield (mg/kg) | 1.6 ± 2.2 | 11.5 ± 26.1 | 4.7 ± 2.6 | 4.6 ± 3.8 | 8.8 ± 6.5 °° | |
| Leaf EO yield (mg/kg) | 4.4 ± 6.7 | 14.4 ± 31.7 | 11.7 ± 8.3 | 12.1 ± 10.5 | 7.2 ± 5.2 | |
| Inflorescence EO yield (mg/kg) | - | - | 25.2 ± 31.4 | 15.5 ± 11.7 | 9.3 ± 7.8 | |
| Morphological Traits | C Category 25–50% (Mild Degree of Invasion) | ||||
|---|---|---|---|---|---|
| May/June | June/July | August | September | October | |
| Plant height (cm) | 78.9 ± 16.1 | 93.7 ± 31.4 | 123.9 ± 31.4 | 129.7 ± 39.5 | 119.9 ± 35.3 |
| Entire plant’s weight (g) | 19.5 ± 7.1 | 22.7 ± 15.4 | 33.7 ± 22.7 | 52.3 ± 41.2 | 44.5 ± 26.7 |
| Relative water content of entire plant (%) | 70.9 ± 4.7 | 62.6 ± 2.8 | 57.6 ± 2.2 | 60.1 ± 7.9 | 59.1 ± 3.6 |
| Stem length (cm) | 78.9 ± 16.1 | 93.7 ± 31.4 | 95.8 ± 21.3 | 96.2 ± 27.5 | 93.5 ± 25.2 |
| Stem weight (g) | 11.0 ± 5.0 | 12.4 ± 9.3 | 9.2 ± 3.3 | 6.5 ± 4.3 | 5.2 ± 3.4 |
| Stem relative water content (%) | 68.8 ± 6.4 | 58.9 ± 2.9 | 53.2 ± 0.9 | 54.0 ± 16.3 | 51.2 ± 2.3 |
| Number of all leaves | 48.4 ± 3.4 | 70.1 ± 21.0 | 68.6 ± 6.8 | 63.6 ± 7.8 | 60.1 ± 10.9 |
| Weight of all leaves (g) | 8.3 ± 2.1 | 9.9 ± 5.9 | 7.9 ± 3.0 | 9.5 ± 3.0 | 10.7 ± 3.6 |
| Weight of a single leaf (g) | 0.2 ± 0.03 | 0.1 ± 0.03 | 0.1 ± 0.06 | 0.2 ± 0.07 | 0.2 ± 0.05 |
| Relative water content of all leaves (%) | 19.5 ± 7.1 | 22.7 ± 15.4 | 33.7 ± 22.7 | 52.3 ± 41.2 | 44.5 ± 26.7 |
| Number of assimilating, green, leaves | 41.7 ± 2.9 | 59.0 ± 13.5 | 61.9 ± 9.1 | 58.4 ± 5.9 | 46.7 ± 17.8 |
| Weight of assimilating, green, leaves (g) | 8.0 ± 2.1 | 9. 5 ± 5.5 | 7.7 ± 2.9 | 9.1 ± 3.0 | 9.2 ± 4.6 |
| Weight of a single assimilating, green, leaf (g) | 0.2 ± 0.04 | 0.2 ± 0.05 | 0.1 ± 0.07 | 0.2 ± 0.07 | 0.2 ± 0.05 |
| Relative water content of assimilating, green, leaves (%) | 73.8 ± 2.7 | 67.4 ± 3.4 | 61.3 ± 4.8 | 59.3 ± 1.5 | 52.8 ± 14.3 |
| Number of non-assimilating, brown, leaves | 6.6 ± 2.5 | 11.1 ± 7.6 | 6.7 ± 2.5 | 5.1 ± 4.6 | 13.4 ± 7.8 |
| Weight of non-assimilating, brown, leaves (g) | 0.3 ± 0.1 | 0.5 ± 3.8 | 0.3 ± 0.2 | 0.4 ± 0.4 | 4.5 ± 1.9 |
| Weight of single non-assimilating, brown, leaf (g) | 0.05 ± 0.01 | 0.05 ± 0.01 | 0.04 ± 0.01 | 0.07 ± 0.03 | 0.09 ± 0.07 |
| Relative water content of non-assimilating, brown, leaves (%) | 52.8 ± 11.2 | 50.9 ± 11.4 | 41.4 ± 10.4 | 43.9 ± 11.3 | 34.7 ± 11.9 |
| Inflorescence length (cm) | - | - | 28.1 ± 11.8 | 33.5 ± 15.7 | 26.4 ± 11.1 |
| Inflorescence weight (g) | - | - | 8.1 ± 8.0 | 17.9 ± 17.4 | 13.9 ± 11.4 |
| Inflorescence relative water content (%) | - | - | 67.3 ± 0.9 | 62.2 ± 2.9 | 51.6 ± 13.7 |
| Stem EO yield (mg/kg) | 1.7 ± 3.0 | 2.5 ± 3.2 | 4.3 ± 4.6 | 3.5 ± 2.0 | 3.3 ± 2.2 |
| Leaf EO yield (mg/kg) | 3.9 ± 3.6 | 3.6 ± 4.0 | 8.1 ± 5.5 | 6.0 ± 8.0 | 3.9 ± 3.1 |
| Inflorescence EO yield (mg/kg) | - | - | 12.1 ± 17.8 | 19.5 ± 28.4 | 8.4 ± 8.3 |
Single values of morphological traits represent means ± standard deviations (SD) from the 40 values (10 specimens x 4 sampling stands of the identical sampling stand category, according to degree of invasion A1–4, B5–8, C9–12), presented in the separate sampling terms. Single values of EO yields represent means ± standard deviations (SD) from the particular values (weight of the EO extracted from the 0.020 kg of the dry Solidago canadensis biomass) from 4 sampling stands of the identical sampling stand category according to the degree of invasion, presented for the separate sampling terms, sampling stand category and separated plant organs of Solidago canadensis used for the extraction. Values ± SD were determined using univariate statistic. Differences between the sampling stands categories in the selected morphological traits and EO yields were assessed using Two-way and One-way ANOVA, with three levels of significance (p < 0.05; p < 0.01; p < 0.001), where º indicates differences between the A versus B, * A versus C, and ° B versus C categories.
2.1. Morphological Traits—Different Phenological Phases
The lowest number of all the leaves was observed at the 1st (May/June) sampling term, while the highest was at the 2nd (June/July) sampling term. Consequently, the number of all leaves decreased, till, in September and October, this decrease was significant (2nd June/July versus 4th September p < 0.05; 2nd June/July versus 5th October p < 0.001; 3rd August versus 5th October p < 0.01). The weight of the all leaves was the highest in the 2nd (June/July) sampling term. Consequently, no distinctions were observed between the separate sampling terms. However, the average weight of the single leaf was significantly higher at first, in comparison to other of the sampling terms. The ratio between the entire plant´s weight and all leaves´ weight was more than 3.5, in general, as well as in every category of sampling stands. The lowest number of the assimilating leaves was noticed in May. Consequently, their number significantly increased from June to August, and repeatedly significantly decreased in October. A similar pattern was observed concerning the weight of assimilating, green, leaves; however, the distinctions between the particular sampling terms were not significant. In opposition, the number, as well as the weight, of non-assimilating, brown, leaves were the highest just at the end of the growing season. Since the average weight of the single assimilating leaf decreased, those of the non-assimilating increased from the beginning to the end of the growing season. The mutual ratio of the assimilating and non-assimilating leaves changes on behalf of the non-assimilating leaves as the growing season came to the end.
2.2. Morphological Traits—Different Degree of Invasion
In general, the plants from the stands with the mild degree of invasion (25–50%) were significantly lower (A versus C p < 0.001; B versus C p < 0.01) and lighter (A versus C p < 0.05). The differences between the sampling stands in the plant´s height and the entire plant´s weight are also shown in the dendrograms (Figure 1a,b), where clusters, consisting of stands with the identical degree of invasion (A1–4, B5–8, C9–12), are clearly recognizable. The separated position of the group of stands with a heavy degree of invasion (A category) is obvious.
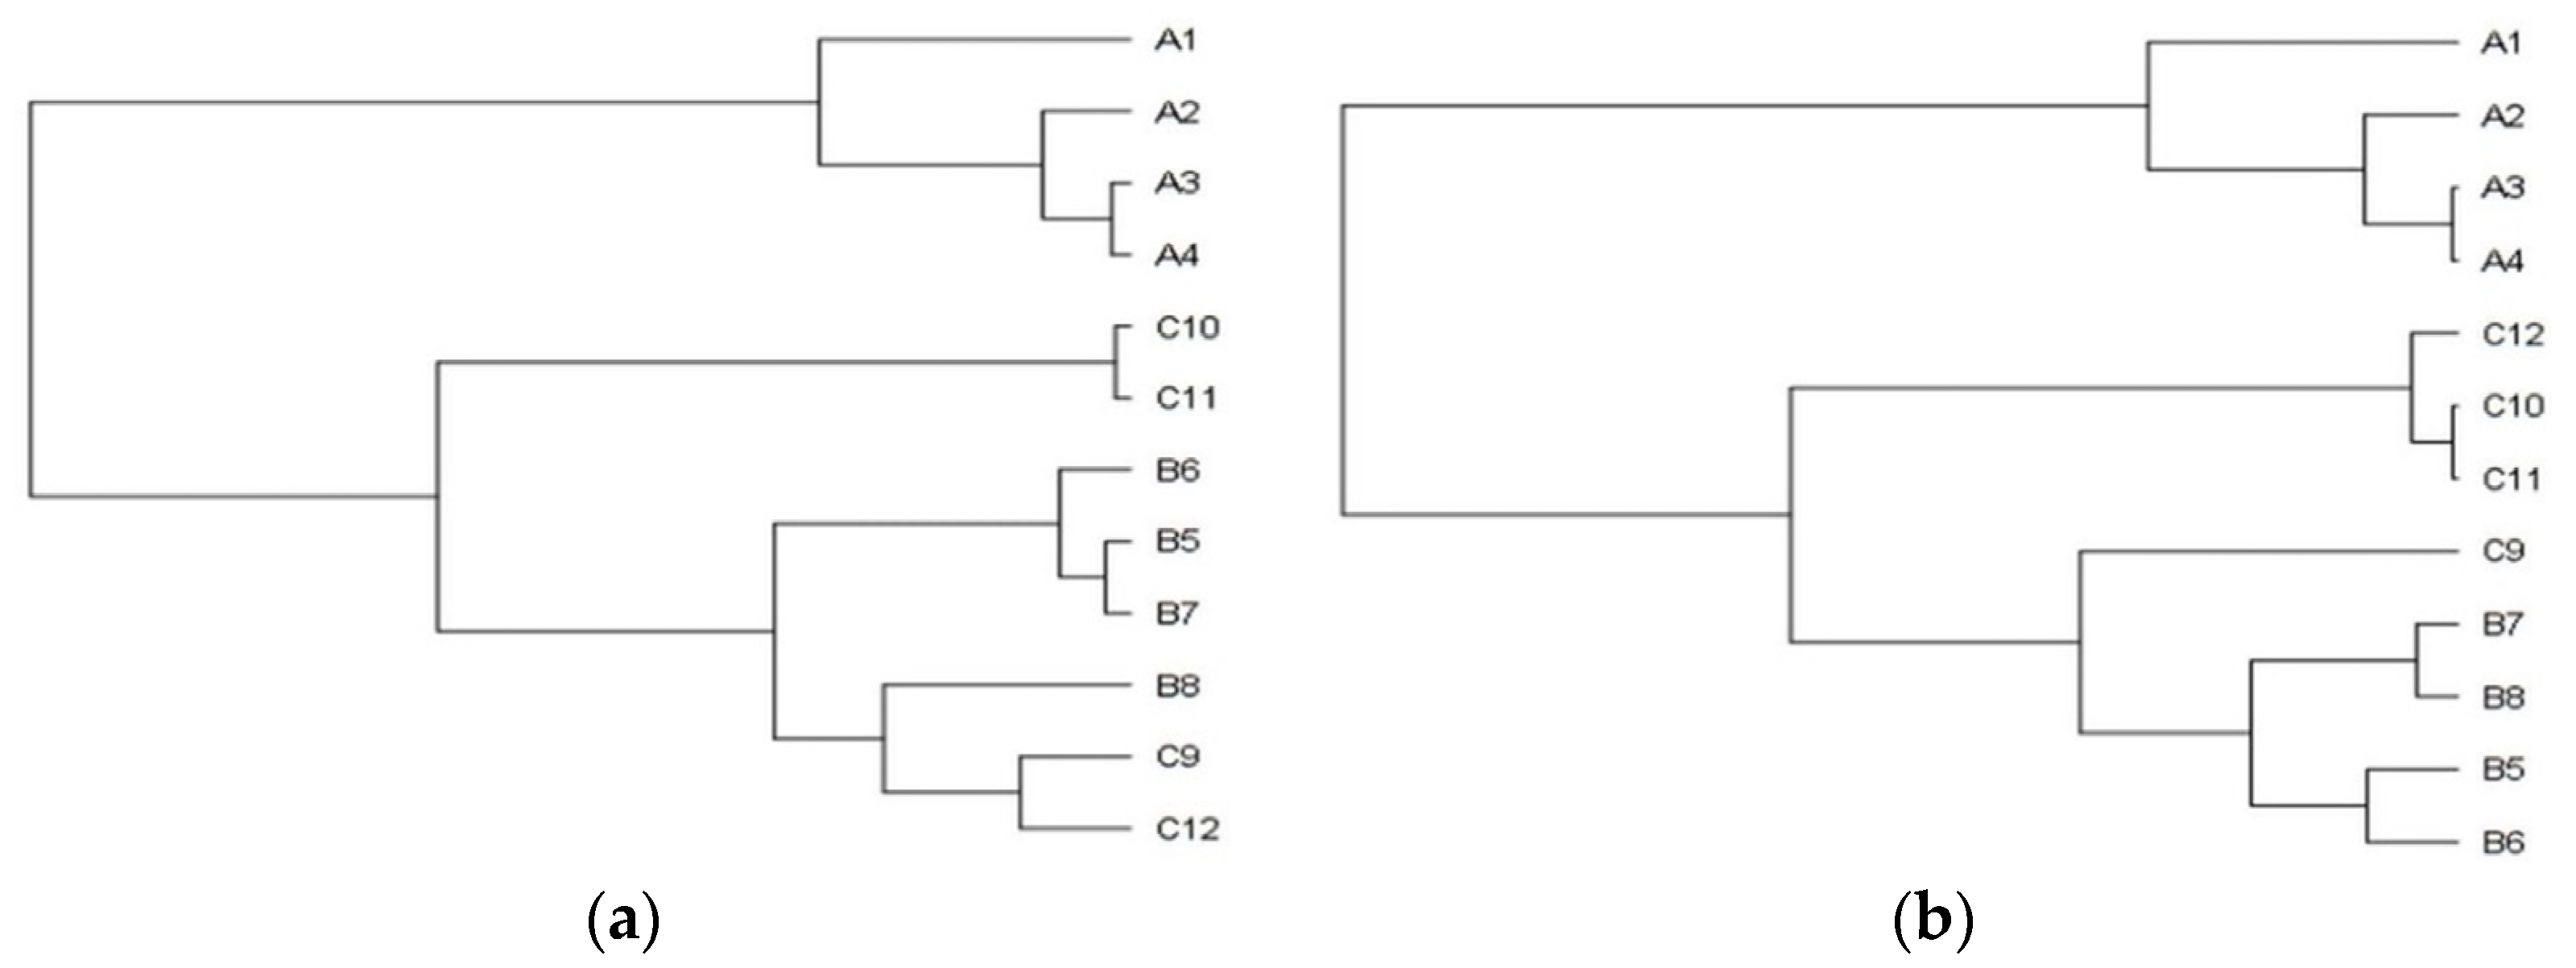
The plants with the longest stems were noticed within the stands with 75–100% S. canadensis relative abundance. The stem´s average length significantly decreased simultaneously with the decrease of invasion degree (A versus C p < 0.001; B versus C p < 0.001). The stem weight was, in general, significantly lowest in the plants from the C category of sampling stands (A versus C p < 0.001; B versus C p < 0.001).
The lowest number of all the leaves was observed in the plants from the mildly invaded stands (25–50% S. canadensis representation; A versus C p < 0.05; B versus C p < 0.001). Plants from the stands with mild degree of invasion had significantly lower weight of all leaves (A versus C p < 0.01; B versus C p < 0.01), as well as the single leaf’s weight, in comparison to plants from the A category (A versus C p < 0.01).
In addition, researchers did not notice the distinctions in the number of assimilating, green, leaves between the A, B, and C categories. However, assimilating leaves from the plants of mildly invaded stands showed significantly lower weight (A versus C p < 0.01; B versus C p < 0.05). Non-assimilating, brown, leaves from the plants of the C category showed a significantly lower count, as well as weight, in comparison to those of A and B categories (number: A versus C p < 0.05; B versus C p < 0.01; weight: A versus C p < 0.01; B versus C p < 0.05).
Generally, no distinctions in the entire plant´s nor stem´s relative water contents were observed between the A, B, and C sampling stands categories. Only all the leaves and inflorescences from the plants of the heavily invaded stands had a significantly higher relative water content in comparison to those from the mildly invaded stands (leaves A versus C p < 0.05; inflorescences A versus C p < 0.05).
2.3. Relative Daily Growth Rate
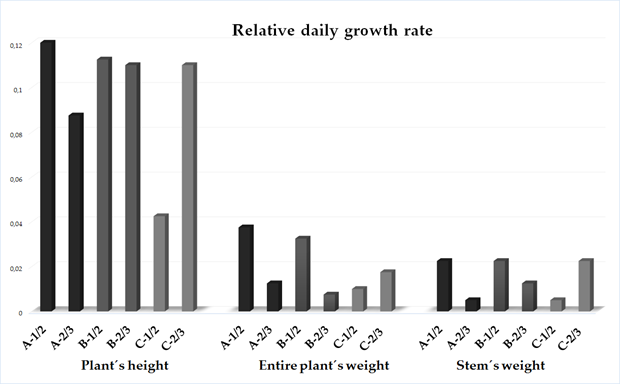
3. Essential Oil Productivity Rate
The hydro-distillation of the S. canadensis dry plant material yielded pale yellow oil. In general, the mean EO yield increased continuously till the 4th sampling term (September), when it was the highest, and significantly higher in comparison with every of the other sampling terms. A similar pattern was observed by evaluating the EOs´ yields from the separated plant organs, i.e., stems, leaves, and inflorescences, as well as according to degree of invasion. Generally, the highest average EO yield was obtained from the plants of the heavily invaded stands, while the lowest was obtained from those of the mildly invaded stands (Figure 3a). The mean EO yield obtained from the plants of the A category was significantly higher in comparison to those of the C category (p < 0.01). The highest EOs´ yields were, in general, extracted from the inflorescences, followed by leaves and stems (Figure 3b). The inflorescences´ mean EO yield was, in comparison, also significantly higher (I versus L p < 0.001; I versus L p < 0.001). The same pattern was equally observed within the separated A, B, and C categories.
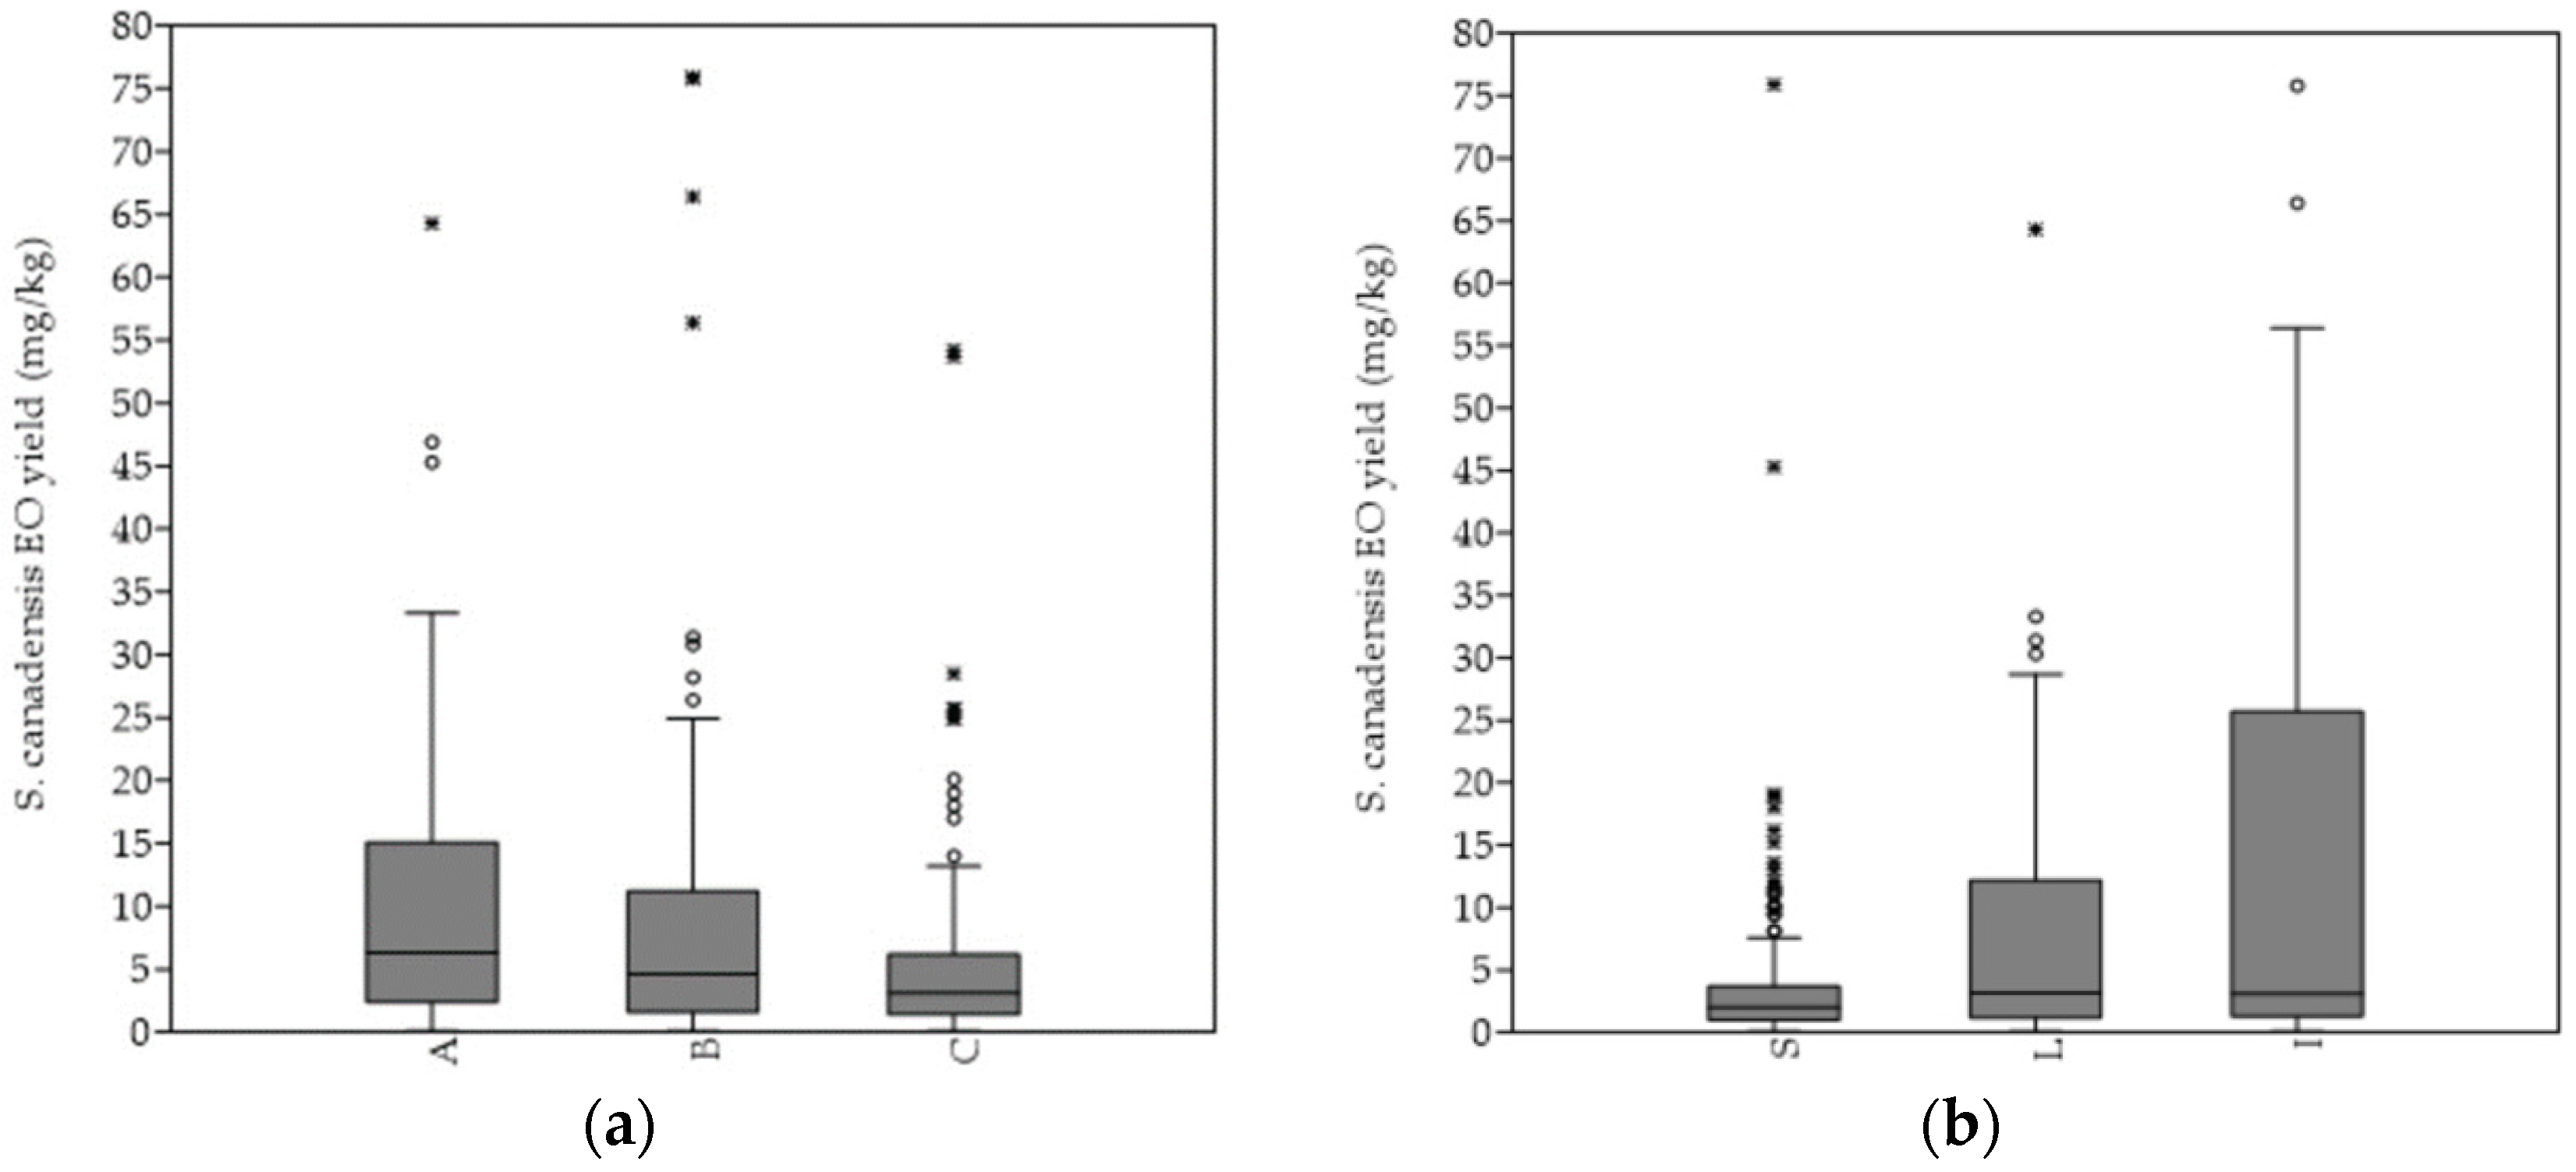
Figure 3. Differences in the essential oil productivity rate according to different Solidago canadensis (a) degree of invasion and (b) plant organs. Abbreviations and notes: A = sampling stands´ category with 75–100%, B = 50–75% and C = 25–50% relative abundance of Solidago canadensis within the vegetation cover; S—stems, L—leaves, I—inflorescences. Boxplot outliers are shown as * and °.
4. Correlations
The plant´s height and overall plant´s weight positively and significantly (p < 0.05) correlated with all other morphological traits. The exception concerned number of all leaves and relative water content of the entire plant. The number of all leaves positively and significantly (p < 0.05) correlated with the stem´s length and weight. Length and weight of the inflorescence positively and significantly correlated with the stem´s weight. The entire plant´s relative water content did not correlate with any morphological traits evaluated.
The stems´ and leaves´ EO yields were mutually correlated with each other.
The stems´ EO yield was negatively and significantly correlated with the entire plant´s relative water content (p < 0.05). The leaves´ EO yield positively and significantly (p < 0.05) correlated with the stem´s length.
Categories of sampling stands did not mutually differ in the variables used for their characterization. However, researchers observed a significant positive correlation (p < 0.01) between the degree of invasion and soil reaction. Average pH was the highest within the stands with the highest S. canadensis % representation. On the other side, the significant negative correlation (p < 0.05) between the goldenrod relative % abundance and the overall area of sampling stand was detected. The stands with the lowest area had the highest goldenrod coverage, and vice versa.
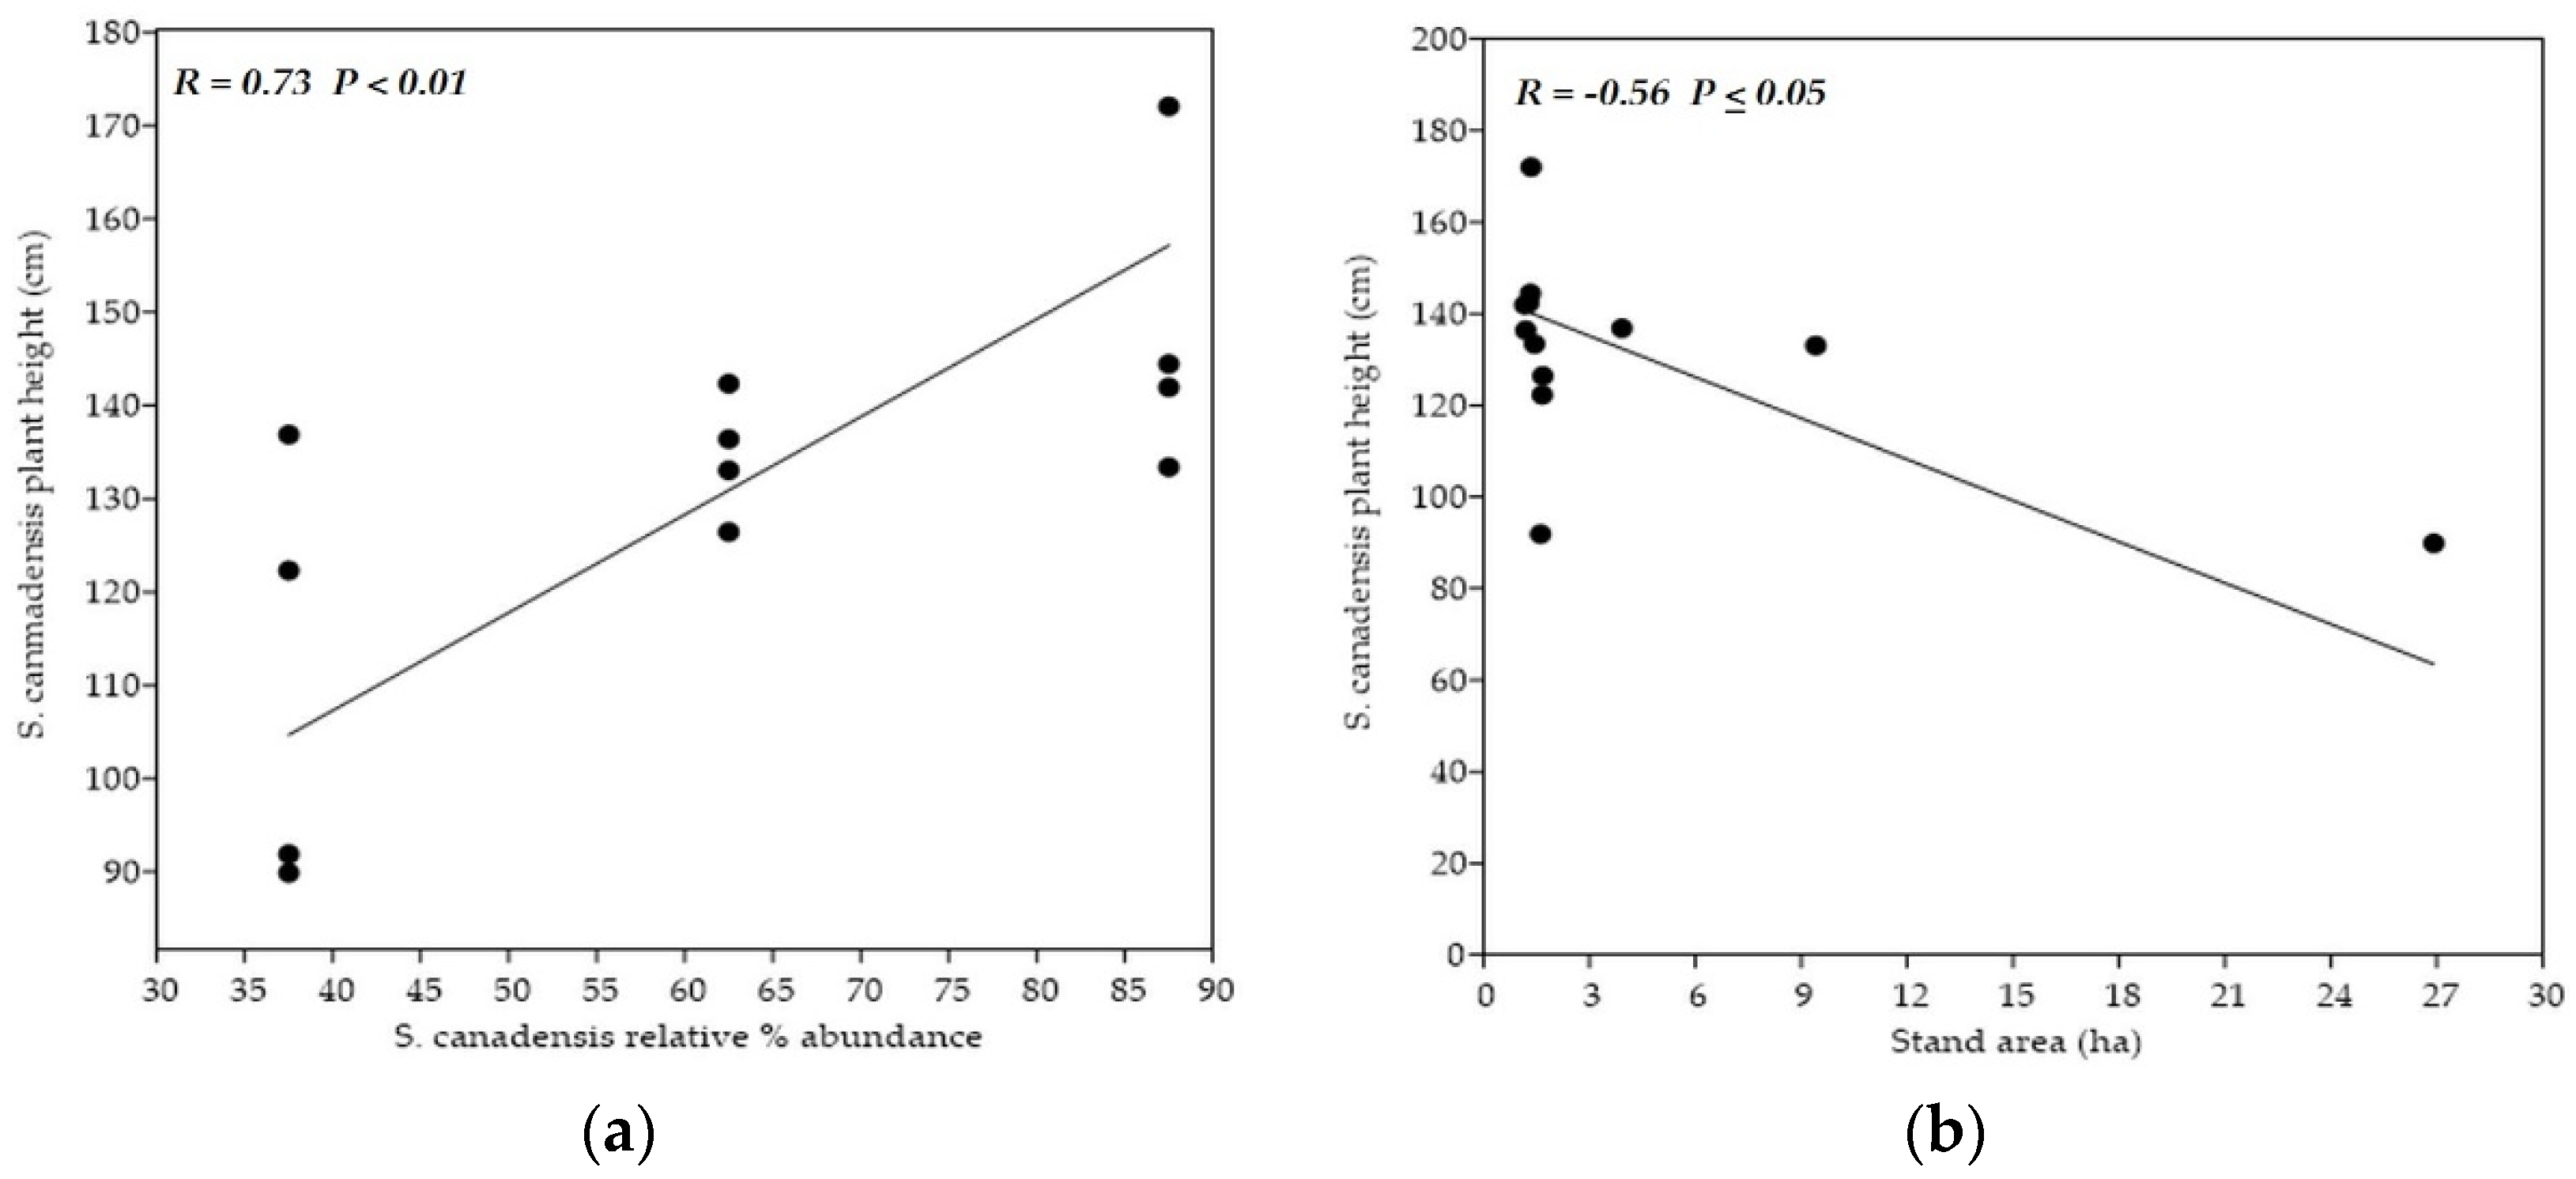
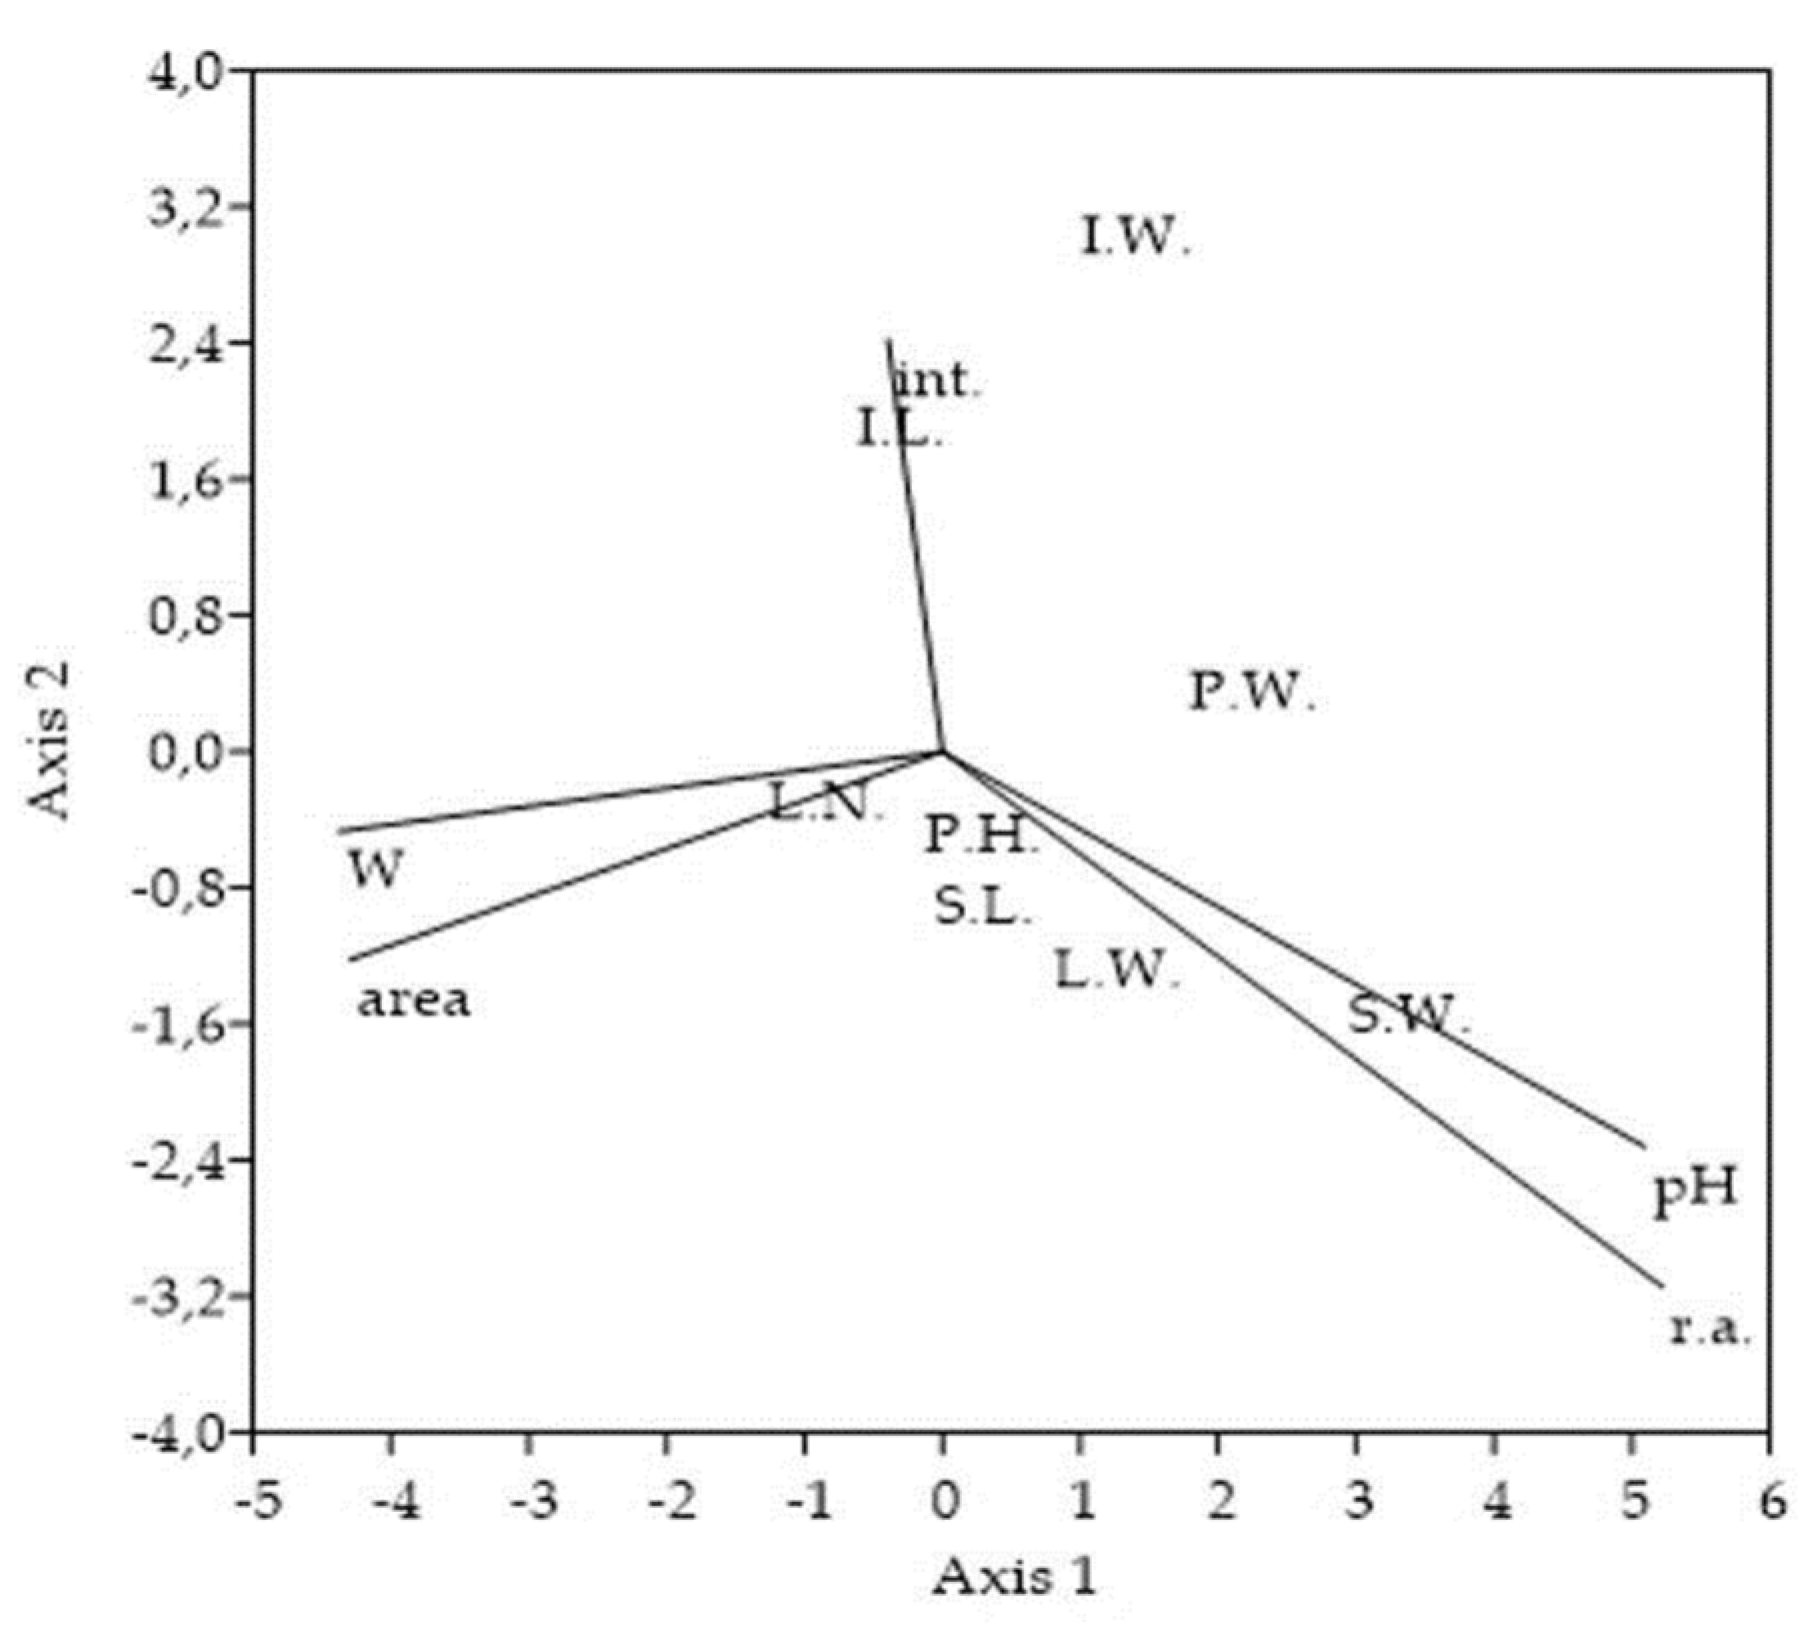
Figure 5. Ordination plot of the selected Solidago canadensis morphological traits and variables used for the sampling stands characterization. CCA ordination triplot shows association of 8 morphological traits to degree of invasion, soil reaction, soil moisture, stand area, and measure of interventions. The cumulative percentage variance of morphological traits-variables relation explained on Axis 1 = 70.26% and on Axis 2 = 20.92%, with eigenvalues for Axis 1 = 0.003 and for Axis 2 = 0.001. Abbreviations and notes: P.H.-plant´s height, P.W.-entire plant´s weight, S.L.-stem´s length, S.W.-stem´s weight, L.N.-all numbers of leaves, L.W.-all leaves weight, I.L.-inflorescence´s length, I.W.-inflorescence´s weight, r.a.-Solidago canadensis relative % abundance within vegetation cover, pH-soil reaction, W-soil moisture, area-overall area of sampling stands, int.-measure of interventions (number of mowings).
This entry is adapted from the peer-reviewed paper 10.3390/plants11040535
References
- Cvachová, A.; Gojdičová, E. Regulation for Invasive Plant Species Removal; SOPSR, COPK Banská: Bystrica, Slovakia, 2003; pp. 1–37. (In Slovak)
- Jakobs, G.; Weber, E.; Edwards, P.J. Introduced Plants of the Invasive Solidago gigantea (Asteraceae) are Larger and Grow Denser than Conspecifics in the Native Range. Divers. Distrib. 2004, 10, 11–19.
- Weber, E.; Jakobs, G. Biological Flora of Central Europe: Solidago gigantea Aiton. Flora 2005, 200, 109–118.
- Koutika, L.S.; Rainey, H.J.; Dassonville, N. Impacts of Solidago gigantea, Prunus serotina, Heracleum mantegazzianum and Fallopia japonica Invasions on Ecosystems. Appl. Ecol. Environ. Res. 2011, 91, 73–83.
- Martin, F.M.; Dommanget, F.; Lavallée, F.; Evette, A. Clonal Growth Strategies of Reynoutria japonica in Response to Light, Shade, and Mowing, and Perspectives for Management. NeoBiota 2020, 56, 89–110.
- Guo, S.L.; Fang, F. Physiological Adaptation of the Invasive Plant to Environments. Chin. J. Plant Ecol. 2003, 27, 47–52.
- Huang, H.; Chen, G.; Guo, S. Reproductive Biology in an Invasive Plant Solidago canadensis. Front. Biol. 2007, 2, 196–204.
- Sun, B.Y.; Tan, J.Z.; Wan, Z.G.; Gu, F.G.; Zhu, M.D. Allelopathic Effects of Extracts from Solidago canadensis L. against Seed Germination and Seedling Growth of Some Plants. J. Environ. Sci. 2006, 18, 304–309.
- Abhilasha, D.; Quintana, N.; Vivanco, J.; Joshi, J. Do Allelopathic Compounds in Invasive Solidago canadensis S.L. Restrain the Native European Flora? J. Ecol. 2008, 96, 993–1001.
- Gruľová, D.; Baranová, B.; Ivanova, V.; De Martino, L.; Mancini, E.; De Feo, V. Composition and Bio Activity of Essential Oils of Solidago spp. and their Impact on Radish and Garden Cress. Allelopath. J. 2016, 39, 129–141.
- Wang, C.; Xiao, H.; Zhao, L.; Liu, J.; Wang, L.; Zhang, F.; Shi, Y.; Du, D. The Allelopathic Effects of Invasive Plant Solidago Canadensis on Seed Germination and Growth of Lactuca Sativa Enhanced by Different Types of Acid Deposition. Ecotoxicology 2016, 25, 555–562.
- Możdżeń, K.; Barabasz-Krasny, B.; Zandi, P.; Kliszcz, A.; Puła, J. Effect of Aqueous Extracts from Solidago canadensis L. Leaves on Germination and Early Growth Stages of Three Cultivars of Raphanus sativus L. var. radicula Pers. Plants 2020, 9, 1549.
- Wang, C.; Cheng, H.; Wei, M.; Wang, S.; Wu, B.; Du, D. Plant Height and Leaf Size: Which One is More Important in Affecting the Successful Invasion of Solidago canadensis and Conyza canadensis in Urban Ecosystems? Urban For. Urban Green. 2021, 59, 127033.
- Song, D.L.; Zhao, Y.F.; Tang, F.P.; Zhang, Y.H.; Zhou, S.Q.; Don, L.J. Effects of Arbuscular Mycorrhizal Fungi on Solidago Canadensis Growth are Independent of Nitrogen Form. J. Plant Ecol. 2021, 14, 648–661.
- Yu, H.W.; He, W.M. Arbuscular Mycorrhizal Fungi Compete Asymmetrically for Amino Acids with Native and Invasive Solidago. Microb. Ecol. 2021.
- Wu, S.; Cheng, J.; Xu, X.; Zhang, Y.; Zhao, Y.; Li, H.; Qiang, S. Polyploidy in Invasive Solidago Canadensis Increased Plant Nitrogen Uptake, And Abundance and Activity of Microbes and Nematodes in Soil. Soil Biol. Biochem. 2019, 138, 107594.
- Szymura, M.; Szymura, T.H. Soil Preferences and Morphological Diversity of Goldenrods (Solidago L.) From South-Western Poland. Acta Soc. Bot. Pol. 2013, 82, 107–115.
- Alizadeh, M.A.; Jafari, A.A. Variation and Relationships of Morphological Traits, Shoot Yields and Essential Oil Contents of Four Species. Folia Hortic. 2016, 28, 165–172.
- Alizadeh, M.A.; Jafari, A.A.; Sayedian, S.E. Evaluation of Aerial Biomass Yield and Essential Oil Content of Seven Species of Tanacetum. J. Hortic. Res. 2017, 25, 19–25.
- Končeková, L.; Zahradníková, E.; Pintér, E.; Halmová, D. Assessment of an Impact of Mechanical Regulation on Selected Morphometric and Productive Parameters of Invasive Species Solidago canadensis Population in Agricultural Land. Agriculture 2016, 61, 121–128.
- Gala-Czekaj, D.; Synowiec, A.; Dąbkowska, T. Self-Renewal of Invasive Goldenrods (Solidago spp.) as a Result of Different Mechanical Management of Fallow. Agronomy 2021, 11, 1065.
- Sá, P.G.; Almeida, D.B.; Alves, C.M.L.; Barbosa, J.G.; Grossi, J.A.S.; Zandonadi, A.S.; Muniz, M.A. Different Harvest Stages and Longevity of Floral Stems of Canadian Goldenrod (Solidago canadensis L.). Acta Hortic. 2015, 1060, 225–228.
- Shelepova, O.; Vinogradova, Y.; Vergun, O.; Grygorieva, O.; Brindza, J. Invasive Solidago canadensis L. as a Resource of Valuable Biological Compounds. Potravin. Slovak J. Food Sci. 2019, 13, 280–286.
- Kalemba, D.; Thiem, B. Constituents of the Essential Oils of Four Micropropagated Solidago Species. Flavour Frag. J. 2004, 19, 40–43.
- Shelepova, O.; Vinogradova, Y.; Zaitchik, B.; Ruzhitsky, A.; Grygorieva, O.; Brindza, J. Constituents of the Essential Oil in Solidago canadensis L. from Eurasia. Potravin. Slovak J. Food Sci. 2018, 12, 20–25.
- Benelli, G.; Pavela, R.; Cianfaglione, K.; Nagy, D.U.; Canale, A.; Maggi, F. Evaluation of two Invasive Plant Invaders in Europe (Solidago canadensis And Solidago gigantea) as Possible Sources of Botanical Insecticides. J. Pest Sci. 2019, 92, 805–821.
- Huang, Y.; Bai, Y.; Wang, Y.; Kong, H. Allelopathic Effects of the Extracts from an Invasive Species Solidago Canadensis L. on Microcystis aeruginosa. Lett. Appl. Microbiol. 2013, 57, 451–458.
- Elshafie, H.S.; Gruľová, D.; Baranová, B.; Caputo, L.; De Martino, L.; Sedlák, V.; Camele, I.; De Feo, V. Antimicrobial Activity and Chemical Composition of Essential Oil Extracted from Solidago canadensis L. Growing Wild in Slovakia. Molecules 2018, 24, 1206.
- González-Coloma, A.; Reina, M.; Díaz, C.E.; Fraga, B.; Santana-Méridas, O. Natural Product—Based Biopesticides for Insect Control. Comprehensive Natural Products II. Chem. Mol. Sci. Chem. Eng. 2010, 3, 237–268.
- Synowiec, A.; Kalemba, D.; Drozdek, E.; Bocianowski, J. Phytotoxic Potential of Essential Oils from Temperate Climate Plants Against the Germination of Selected Weeds and Crops. J. Pest Sci. 2017, 90, 407–419.
- Mariychuk, R.; Gruľová, D.; Grishchenko, L.M.; Linni, R.P.; Lisnyak, V.V. Green Synthesis of Non-spherical Gold Nanoparticles Using Solidago canadensis L. extract. Appl. Nanosci. 2020, 10, 4817–4826.
