Your browser does not fully support modern features. Please upgrade for a smoother experience.
Please note this is an old version of this entry, which may differ significantly from the current revision.
Subjects:
Economics
|
Green & Sustainable Science & Technology
Research and development (R&D) has long been recognized as an important component of sustainable development, with a key role in the combatting of climate change. Moreover, R&D activity is increasingly acknowledged as an important contributing factor to global post-pandemic economic recovery. However, little is known about the determinants of R&D intensity (the share of R&D expenditure in GDP) and countries have repeatedly missed their set targets for this indicator.
- R&D intensity
- sustainable development
- impact factors
- high-technology exports
- human capital
- trade openness
- renewable energy consumption
- patents
- dynamic panel data
- system-GMM
1. Introduction
The COVID-19 pandemic quickly transformed into the deepest social and economic crisis since World War II [1], posing major challenges for global innovation systems, as it endangered key production and innovation capabilities [2]. However, despite foreseen financial pressures, especially for public R&D expenditures [3], R&D investment is projected to play a key role for sustainable economic growth in the post-pandemic era (the so-called “Great Reset” as per [4]), contributing to underpinning private sector growth and job creation [5]). Moreover, science and innovation are acknowledged as quintessential factors in the post-COVID recovery period for world economies to tackle the climate emergency, meet the UN’s Sustainable Development Goals of the 2030 Agenda, spur the digital transformation and promote more democratic and inclusive societies [2][6].
In fact, the crucial role of innovation for economic development and growth, presumed by the endogenous growth theory, has been validated by a large body of literature, from paramount earlier works [7][8][9][10][11][12] to more recent research [13][14][15][16][17][18].
Moreover, innovation is a documented mitigating factor for pollution, and spending on R&D contributes to decreasing carbon emissions in different countries and over different time periods [19][20][21][22][23] and also to increase energy efficiency by reducing carbon intensity [24]
The above-documented relationships also emerge from the researchers study sample; Figure 1 reflects that the increasing share of R&D expenditure in GDP is generally positively related to economic income, and generally negatively related to carbon intensity (implying a negative relationship with polluting emissions and a positive relationship with energy efficiency), at world level.
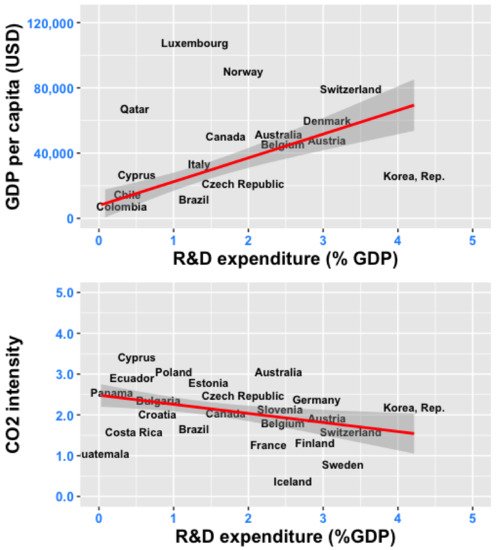
Figure 1. R&D expenditure (% GDP) and GDP per capita (USD), most recent year (Panel A); R&D expenditure (% GDP) and CO2 intensity (kg per kg of oil equivalent energy use), most recent year (Panel B). Source of data: World Bank’s Development Indicators (WDI) database.
Moreover, the world’s top 10 investors in innovation reflected in Table 1 are all high-income countries and include amongst them world leaders in renewable energy, such as Sweden, Denmark, Germany or the US. The low-carbon technological innovation links, at the global level, innovative activities with the shift toward sustainable energy sources. Governments acknowledged the need to significantly increasing the public funding for technological innovation in low-carbon energy [25]. Moreover, sustainable energy technology represents around 80% of total public energy R&D spending, which in 2019 increased by 3% reaching USD 30 billion globally, while corporate energy R&D reached USD 90 billion [26].
Table 1. World top 10 investors in R&D, most recent year of available data per country (2015).
| Country | GDP Per Capita (Constant 2010 USD) | R&D Expenditures (% GDP) |
|---|---|---|
| Israel | 33,124 | 4.26 |
| Korea, Rep. | 26,064 | 4.22 |
| Japan | 47,103 | 3.28 |
| Sweden | 56,340 | 3.26 |
| Denmark | 60,402 | 3.05 |
| Austria | 47,789 | 3.05 |
| Germany | 45,208 | 2.91 |
| Finland | 45,648 | 2.89 |
| United States | 52,236 | 2.72 |
| Belgium | 45,507 | 2.46 |
As such, given its established role as a promoter of sustainable economic growth and contributor to mitigating pollution and tackling climate change at world level, with its acknowledged increasing importance in the post-pandemic era, the researchers main research goal is to provide a deeper understanding of the determinants of countries’ R&D investment, by examining its potential driving factors. Surprisingly, the related literature remains narrow, with few previous studies concerned with the determinants of R&D funding across countries, which further motivates the researchers endeavor. Not in the least, it should be mentioned that countries, recognizing the importance of R&D investment for sustainable economic growth, have set minimum threshold levels for R&D intensity (i.e., the 3% goal set by the EU [27] or the 1% objective set by the African Union [28], which have been vastly unmet [6]. Moreover, ref. [29] concluded that countries should even reach R&D intensity levels as high as approximately 4 or 5% to achieve their INDC targets, numbers that not even world top investors in innovation reflected in Table 1 have managed to reach. Consequently, understanding driving factors for R&D intensity is paramount and has important policy implications at world level. All these factors are important motivators for this study.
Among the few related research, references [30][31] identifies population and GDP per capita income as key factors of R&D expenditure, whereas ref. [32] confirm that economic development (GDP per capita) is conducive to R&D investment. Ref. [33] finds that national culture and patent protection are factors that explain R&D investment, while also concluding that the degree of openness of an economy is unrelated to R&D intensity. In contrast, ref. [34] reveals that trade openness has a negative effect on domestic R&D, and that this effect decreases with an increase in GDP per capita and trade with OECD countries. Further, refs. [35][36] confirm the positive impact of intellectual property rights (IPRs) on innovation, whereas ref. [37] concludes that the investment in education quality leads to higher output of innovation activity.
2. Driving Factors for R&D Intensity
The System GMM regression results from estimating Equation (3) over the period 2007–2015, for the global panel and the two sub-panels corresponding to the two income-groups of countries are reported in Table 2. The researchers also checked the robustness of the researchers results against alternative measures of R&D output (i.e., the number of patents), and these results are reported in Table 3. As the two-step GMM estimators can be seriously biased downwards in finite samples [38], similar to ref. [39] the researchers preferred to employ the one-step version of the system GMM estimation for all panels and model specifications. Additionally, as mentioned earlier, the robustness of the System GMM estimators depends both on the assumption that the error term does not have a serial correlation problem and on the validity of instruments. Consequently, these assumptions were verified through the Arellano–Bond test for no serial correlation in the error terms and the Hansen/Sargan test for the validity of the instruments, which are reported in the bottom rows of Table 2 and Table 3, respectively. According to ref. [40], the GMM estimator requires that there is no second-order serial correlation (AR2 test) in the differenced residuals. In all estimations in this study, these diagnostics support the validity of the model specifications. Note also that, in all specifications, the Hansen/Sargan test does not reject the null hypothesis of instrument validity, consistently indicating a high chance of a type one error if the null is rejected (for example, ref. [41] stated that even a p-value as high as 0.25 “should be viewed with concern”; the researchers results indicate p-values of at least 0.6, which allows for a high degree of confidence in the validity of instruments). All diagnostic tests thus confirm that all System GMM equations are properly specified; thus, the researchers can proceed with presenting and discussing the estimations’ results.
Table 2. Effect of explanatory variables on R&D intensity: one-step system-GMM dynamic panel estimation regression results for the global, high-income and low- and middle-income panels.
| Global | High-Income (HI) | Low- and Middle-Income (LMI) | |
|---|---|---|---|
| Dependent variable: R&D intensity | |||
| Independent variables | Estimate | ||
| R&D Intensity (−1) | 0.400225 *** | 0.357990 *** | 0.3843145 *** |
| TradeOpen | −0.256184 *** | −0.139277 *** | −0.4507593 *** |
| NoR | 0.467285 *** | 0.589239 *** | 0.3931260 *** |
| HTEXP | 0.050262 | 0.063533 | 0.0923286 ** |
| REC | −0.019476 | −0.028049 | 0.0037797 |
| Hansen/Sargan J-test (p-value) | 0.8642 | 0.6387 | 0.7231 |
| AR2 test (p-value) | 0.74768 | 0.53016 | 0.45671 |
Table 3. Robustness checks: Effect of alternative explanatory variables on R&D intensity: one-step system-GMM dynamic panel estimation regression results for the global, high-income and low- and middle-income panels.
| Global | High-Income (HI) | Low- and Middle-Income (LMI) | |
|---|---|---|---|
| Dependent variable: R&D intensity | |||
| Independent variables | Estimate | ||
| R&D Intensity (−1) | 0.3282568 *** | 0.262483 *** | 0.376961 *** |
| TradeOpen | −0.2634110 *** | 0.116984 | −0.297510 ** |
| NoR | 0.4977531 *** | 0.552330 *** | 0.338678 *** |
| Patent | 0.0097895 | 0.080565 *** | 0.043666 |
| REC | −0.0202989 | 0.041230 | 0.033483 |
| Hansen/Sargan J-test (p-value) | 0.7634 | 0.5946 | 0.6675 |
| AR2 test (p-value) | 0.7397 | 0.99914 | 0.4782 |
The findings for all three panels confirm the researchers a priori assumption, namely, that higher R&D intensity in the previous period contributes to higher R&D intensity in the current period. At a global level, a 1% increase in the lagged R&D intensity advanced the investment in R&D in the current period by about 0.40%, while the results for the income-based sub-panels show similar levels.
Furthermore, another significant (negative) impact, which is present throughout the panels, is found for the trade openness variable, such that a 1% increase in the trade openness decreases R&D expenditures worldwide by 0.25%, but the impact is significantly higher for low and middle-income countries (i.e., −0.45%) than for rich countries, where a 1% increase in openness decreases the investment in R&D by −0.14%. As such, it can be extracted that a greater trade openness, which permits the rapid transmission of knowledge and innovation, could be a good policy for beneficiating from innovation transfer, and consequently affects domestic R&D investment decisions. In this respect, the researchers findings support previous studies [42] that concluded that technology spills across countries through the channel of trade flows. Moreover, the low- and middle-income countries seem to beneficiate more from knowledge and innovation spillover than their developed counterparts. Thus, the researchers results confirm that openness is an important channel for promoting technological progress, supporting the findings of refs. [34][43]. The negative relationship between trade openness and R&D intensity also implies that innovation spillovers through the trade channel and R&D investment act as substitutes, rather than complements, for the sample of countries in this study. However, it should be noted that, in robustness checks (Table 3) innovation stops spilling through the trade channel in the case of high-income countries, when patents are introduced as explanatory variables. This is explained by the stronger intellectual property rights (IPRs) in this group of countries and further confirms the findings of ref. [44], which show that patent rights have a significant positive impact on the motivation to innovate in wealthy nations, while this effect is statistically insignificant in developing countries.
Furthermore, results indicate that the number of researchers involved in R&D is the main factor that increases R&D intensity in the investigated countries, worldwide and across the income-groups of countries. However, the relationship is stronger for high-income countries, where a 1% increase in the number of researchers increases R&D intensity by 0.58%, whereas for low and middle-income countries the impact is lower (i.e., 0.39%). Additionally, these results remain robust across different model specifications. the researchers findings are in line with those of ref. [45] that shows that the scientific researchers in a country are robust determinants for R&D intensity and confirm that highly skilled human resources are crucial for a country’s research and innovation capacity and competitiveness [46]. The findings also validate the endogenous growth model proposed by ref. [47], whereby human capital is a key input factor in the R&D sector that generate new designs, which at their turn generate new investment opportunities and complement those of ref. [48] that conclude that human capital is the most significant driving factor for innovation, as proxied by current patent applications per capita.
Moreover, a disaggregation occurs between high-income and low- and middle-income countries whereby the factor representing high-technology exports has a significant positive effect on R&D intensity in the low and middle-income countries, while it has no significant impact on R&D intensity in the high-income countries. In fact, for countries included in the LMI panel, the increase in high-technology exports by 1% results in an increase in R&D intensity of 0.09%, whereas this propensity is not found in the case of other countries. the researchers should recall that the UN’s 2030 Agenda encourages technical advancement, particularly in developing countries, through research and innovation [49]. Additionally, the share of high-technology exports in total manufactured exports is one relevant indicator that reflects the progress made toward achieving that goal. The greater the proportion of exports in higher technological complexity categories, the more evidence that the economy’s structural transformation has advanced. Moreover, as ref. [50] showed, R&D intensity enhances downstream commercialization and diffusion activities, such as increasing high-technology exports. Thus, the researchers findings confirm that R&D and innovation are critical to this shift in the case of low and middle-income countries because they lay the groundwork for the adoption of new, more efficient technologies, which lead to increased high-technology exports that in turn are conducive to increased R&D funding. Consequently, the researchers find proof of positive feedback between high-technology exports and R&D intensity, reflecting that developing countries are in the right track toward the achievement of the 9th sustainable development goal (SDG) of the 2030 Agenda. This effect is not present for high-income countries, attesting previous findings [3] that the gap between developing and developed countries has narrowed as developing economies have been catching up in the structural transformation of manufactured export. On the contrary, when the researchers redid the researchers estimations by using an alternative measure of R&D output (i.e., the number of patents instead of high-technology exports), the findings in Table 3 show that patents are conducive to R&D intensity only in developed countries, whereas this impact is not present for low- and middle-income economies. This further implies that a positive feedback effect between patents and R&D funding exists only in high-income countries, whereby an increase in innovation output (i.e., number of patents) determines higher R&D funding, which in turn stimulates innovative activities and the creation of more innovations. Furthermore, these data imply that the patent gap between developing and developed countries remains wide, whereas it has shrunk in terms of structural change of manufactured exports.
Finally, results show no statistically significant relationship between renewable energy consumption and R&D intensity for all three panels of countries, and thus find that, globally, an increase in renewable energy consumption is not conducive to increased investments in R&D. On the other hand, a reverse effect has been previously encountered for rich countries, whereas increased R&D funding has been showed to spur the consumption of renewable energy [51]. Thus, the world’s top investors in innovation include amongst them world leaders in renewable energy [52][53]. However, the researchers did not encounter a feedback effect between REC and R&D intensity. There may be several reasons for such a finding. One explanation for this result is that, although currently the cost of renewable energy registered dramatic falls [54][55], this was not the case over the analysis period in this study [56] and as such, over 2007-2015, countries did incur economic costs in their path toward carbon neutrality, which would have consequently eliminated the propensity to undertake new R&D investments. Additionally, this relationship could be explained by the fact that countries generally rely on innovation diffusion through the trade flow channel to increase their consumption of sustainable energy [57].
This entry is adapted from the peer-reviewed paper 10.3390/su14031854
References
- European Commission, Directorate-General for Research and Innovation. Transformation Post-COVID; Mobilising Innovation for People, Planet and Prosperity. Available online: https://op.europa.eu/en/publication-detail/-/publication/6dabb3da-8c55–11eb-b85c-01aa75ed71a1/language-en/format-PDF/source-196325752 (accessed on 25 October 2021).
- Organisation for Economic Co-operation and Development (OECD). Science, Technology and Innovation Outlook 2021. Times of Crisis and Opportunity. Available online: https://www.oecd.org/sti/oecd-science-technology-and-innovation-outlook-25186167.htm (accessed on 25 October 2021).
- United Nations Conference on Trade and Development (UNCTAD). Towards Sustainable Industrialization and Higher Technologies. Available online: https://sdgpulse.unctad.org/sustainable-industry/ (accessed on 29 October 2021).
- World Economic Forum. The Great Reset. Available online: https://www.weforum.org/great-reset/ (accessed on 25 October 2021).
- World Economic Forum. These Countries Spend the Most on Research and Development. Available online: https://www.weforum.org/agenda/2020/11/countries-spending-research-development-gdp/ (accessed on 25 October 2021).
- United Nations Conference on Trade and Development (UNCTAD). Technology and Innovation Report. Catching Technological Waves: Innovation with Equity, United Nations, Geneva. 2021. Available online: https://unctad.org/system/files/official-document/tir2020_en.pdf (accessed on 25 October 2021).
- Solow, R.M. A Contribution to the Theory of Economic Growth. Q. J. Econ. 1956, 70, 65–94.
- Mansfield, E. R&D’s Contribution to the Economic Growth of the Nation. Res. Manag. 1972, 15, 31–46.
- Mansfield, E. Research and development, productivity, and inflation. Science 1980, 209, 1091–1093.
- Romer, P.M. Increasing Returns and Long-Run Growth. J. Political Econ. 1986, 94, 1002–1037.
- Lucas, R.E., Jr. On the Mechanics of Economic Development. J. Monet. Econ. 1988, 22, 3–42.
- Park, W.G. International R&D Spillovers and OECD Economic Growth. Econ. Inq. 1995, 33, 571–591.
- Falk, M. R&D Spending in the High-Tech Sector and Economic Growth. Res. Econ. 2007, 61, 140–147.
- Hasan, I.; Tucci, C.L. The Innovation–Economic Growth Nexus: Global Evidence. Res. Policy 2010, 39, 1264–1276.
- Kim, L.W. The Economic Growth Effect of R&D Activity in Korea. Korea World Econ. 2011, 12, 25–44.
- Galindo, M.Á.; Méndez, M.T. Entrepreneurship, Economic Growth, and Innovation: Are Feedback Effects at Work? J. Bus. Res. 2014, 67, 825–829.
- Inekwe, J.N. The Contribution of R&D Expenditure to Economic Growth in Developing Economies. Soc. Indic. Res. 2015, 124, 727–745.
- Sokolov-Mladenović, S.; Cvetanović, S.; Mladenović, I. R&D Expenditure and Economic Growth: EU28 Evidence for the Period 2002–2012. Econ. Res.-Ekon. Istraživanja 2016, 29, 1005–1020.
- Ganda, F. The Impact of Innovation and Technology Investments on Carbon Emissions in Selected Organisation for Economic Co-Operation and Development Countries. J. Clean. Prod. 2019, 217, 469–483.
- Fernández, Y.F.; López, M.F.; Blanco, B.O. Innovation for Sustainability: The Impact of R&D Spending on CO2 Emissions. J. Clean. Prod. 2018, 172, 3459–3467.
- Aldakhil, A.M.; Zaheer, A.; Younas, S.; Nassani, A.A.; Abro, M.M.Q.; Zaman, K. Efficiently Managing Green Information and Communication Technologies, High-Technology Exports, and Research and Development Expenditures: A Case Study. J. Clean. Prod. 2019, 240, 118164.
- Petrović, P.; Lobanov, M.M. The Impact of R&D Expenditures on CO2 Emissions: Evidence from Sixteen OECD Countries. J. Clean. Prod. 2020, 248, 119187.
- Anser, M.K.; Ahmad, M.; Khan, M.A.; Zaman, K.; Nassani, A.A.; Askar, S.E.; Abro, M.M.Q.; Kabbani, A. The Role of Information and Communication Technologies in Mitigating Carbon Emissions: Evidence from Panel Quantile Regression. Environ. Sci. Pollut. Res. 2021, 28, 21065–21084.
- Feng, J.; Yuan, J. Effect of Technology Innovation and Spillovers on the Carbon Intensity of Human Well-Being. SpringerPlus 2016, 5, 1–8.
- Miremadi, I.; Saboohi, Y.; Arasti, M. The Influence of Public R&D and Knowledge Spillovers on the Development of Renewable Energy Sources: The Case of the Nordic Countries. Technol. Forecast. Soc. Change 2019, 146, 450–463.
- International Energy Agency (IEA). Global Status of Clean Energy Innovation in 2020. Available online: https://www.iea.org/reports/clean-energy-innovation/global-status-of-clean-energy-innovation-in-2020 (accessed on 25 October 2021).
- European Commission. Europe 2020: A Strategy for Smart, Sustainable and Inclusive Growth. Available online: https://ec.europa.eu/eu2020/pdf/COMPLET%20EN%20BARROSO%20%20%20007%20-%20Europe%202020%20-%20EN%20version.pdf (accessed on 30 October 2021).
- United Nations Economic Commission for Africa (UNECA). Towards Achieving the African Union’s Recommendation of Expenditure of 1% of GDP on Research and Development. UNECA Policy Brief No. ECA/18/004; ECA Press: Addis Ababa, Ethiopia, 2018.
- Gu, G.; Wang, Z. Research on Global Carbon Abatement Driven by R&D Investment in the Context of INDCs. Energy 2018, 148, 662–675.
- Teitel, S. Patents, R & D Expenditures, Country Size, and Per-Capita Income: An International Comparison. Scientometrics 1994, 29, 137–159.
- Teitel, S. Scientific Publications, R&D Expenditures, Country Size, and Per Capita Income: A Cross Section Analysis. Technol. Forecast. Soc. Change 1994, 46, 175–187.
- Grande, E.; Peschke, A. Transnational Cooperation and Policy Networks in European Science Policy-Making. Res. Policy 1999, 28, 43–61.
- Varsakelis, N.C. The Impact of Patent Protection, Economy Openness and National Culture on R&D Investment: A Cross-Country Empirical Investigation. Res. Policy 2001, 30, 1059–1068.
- Bebczuk, R.N. R&D Expenditures and the Role of Government Around the World. Estud. Econ. 2002, 29, 109–121.
- Kanwar, S.; Evenson, R. Does Intellectual Property Protection Spur Technological Change? Oxf. Econ. Pap. 2003, 55, 235–264.
- Chen, Y.; Puttitanun, T. Intellectual Property Rights and Innovation in Developing Countries. J. Dev. Econ. 2005, 78, 474–493.
- Varsakelis, N.C. Education, Political Institutions and Innovative Activity: A Cross-Country Empirical Investigation. Res. Policy 2006, 35, 1083–1090.
- Blundell, R.; Bond, S. Initial Conditions and Moment Restrictions in Dynamic Panel Data Models. J. Econom. 1998, 87, 115–143.
- Berk, I.; Kasman, A.; Kılınç, D. Towards a Common Renewable Future: The System-GMM Approach to Assess the Convergence in Renewable Energy Consumption of EU Countries. Energy Econ. 2020, 87, 103922.
- Arellano, M.; Bond, S. Some Tests of Specification for Panel Data: Monte Carlo Evidence and an Application to Employment Equations. Rev. Econ. Stud. 1991, 58, 277–297.
- Roodman, D. A Note on the Theme of too Many Instruments. Oxf. Bull. Econ. Stat. 2009, 71, 135–158.
- Coe, D.T.; Helpman, E. International R&D Spillovers. Eur. Econ. Rev. 1995, 39, 859–887.
- Huang, J.; Wang, L.; Wang, D.; Lei, H. Decreasing China’s Carbon Intensity through Research and Development Activities. Environ. Res. 2020, 190, 109947.
- Kim, Y.K.; Lee, K.; Park, W.G.; Choo, K. Appropriate Intellectual Property Protection and Economic Growth in Countries at Different Levels of Development. Res. Policy 2012, 41, 358–375.
- Wang, E.C. Determinants of R&D investment: The Extreme-Bounds-Analysis approach applied to 26 OECD countries. Research Policy 2010, 39, 103–116.
- Eurostat. Archive: Europe 2020 Indicators-R&D and Innovation. Available online: https://ec.europa.eu/eurostat/statistics-explained/index.php?title=Europe_2020_indicators_-_R%26D_and_innovation&oldid=335438 (accessed on 29 October 2021).
- Romer, P.M. Endogenous Technological Change. J. Political Econ. 1990, 98, S71–S102.
- Diebolt, C.; Hippe, R. The Long-Run Impact of Human Capital on Innovation and Economic Development in the Regions of Europe. Appl. Econ. 2019, 51, 542–563.
- United Nations Development Programme (UNDP). The SDGs in Action. Available online: https://www.undp.org/sustainable-development-goals (accessed on 29 October 2021).
- Furman, J.L.; Porter, M.E.; Stern, S. The Determinants of National Innovative Capacity. Res. Policy 2002, 31, 899–933.
- Tudor, C.; Sova, R. On the Impact of GDP Per Capita, Carbon Intensity and Innovation for Renewable Energy Consumption: Worldwide Evidence. Energies 2021, 14, 6254.
- Climate Reality Project. Follow the Leader: How 11 Countries Are Shifting to Renewable Energy. Available online: https://www.climaterealityproject.org/blog/follow-leader-how-11-countries-are-shifting-renewable-energy (accessed on 29 October 2021).
- Climate Council. 11 Countries Leading the Charge on Renewable Energy. Available online: https://www.climatecouncil.org.au/11-countries-leading-the-charge-on-renewable-energy/ (accessed on 25 October 2021).
- World Economic Forum. The Cost of Renewable Energy Is Increasingly Undercutting Fossils. Available online: https://www.weforum.org/agenda/2020/06/cost-renewable-energy-cheaper-coal/ (accessed on 29 October 2021).
- International Renewable Energy Agency (IRENA). Majority of New Renewables Undercut Cheapest Fossil Fuel on Cost. Available online: https://www.irena.org/newsroom/pressreleases/2021/Jun/Majority-of-New-Renewables-Undercut-Cheapest-Fossil-Fuel-on-Cost; (accessed on 29 October 2021).
- International Renewable Energy Agency (IRENA). Power Generation Costs in 2017. Available online: https://www.irena.org/-/media/Files/IRENA/Agency/Publication/2018/Jan/IRENA_2017_Power_Costs_2018_summary.pdf (accessed on 29 October 2021).
- Omri, A.; Nguyen, D.K. On the Determinants of Renewable Energy Consumption: International Evidence. Energy 2014, 72, 554–560.
This entry is offline, you can click here to edit this entry!