Your browser does not fully support modern features. Please upgrade for a smoother experience.
Please note this is an old version of this entry, which may differ significantly from the current revision.
Subjects:
Engineering, Aerospace
Biomimetic aerofoils were designed in three dimensions with the help of Solidworks software and analyzed in the computational flow domain using the commercial code ANSYS Fluent.
- biomimetics
- computational fluid dynamics
- transonic flow
- viscous reduction
1. Introduction
In past decades, the rapid increase in people’s interest in aviation has influenced the entire aircraft industry to frequently improve itself in all aspects. Owing to that, many researchers, academics, and industrialists are trying very hard to develop new methodologies in order to meet current demands. The urgency to reduce carbon emissions in aviation is essential. With the pledges made in the recent Climate Change Conference held in Glasgow, the necessity to keep global warming within 1.5 degrees is of international importance. Humankind is under threat due to the increasing rate of climate change. The United Kingdom has included international aviation in their current sixth carbon budget which emphasizes the requirement of alternate solutions in the field of aviation. This has influenced all areas of the aerospace industry. As a part of this renovation process, most NACA aerofoils have been redesigned in order to improve their performance. NACA has three common classifications of the aerofoil: four-digit, five-digit, and six-digit aerofoils. In this computational analysis, NACA 0012 aerofoil is taken into account. The last two digits of this four-digit aerofoil denote a 12% chord of maximum thickness. Although NACA 0012 is used extensively in low and medium subsonic flows, it is not effective at high subsonic Mach numbers which are also called transonic flow.
2. Lift Force
Figure 1a clearly shows the pressure distribution on the top surface of the NACA 0012 aerofoil. This shows that NACA has above medium values of pressure which start near to the leading edge and cover a maximum area on the top surface. Generally, an aerofoil requires lower values of pressure on the top surface as indicated in Figure 3b, in order to generate higher values of lift. Pressure has been reduced to a medium value with the use of the RR pattern. At low and medium angles of attack i.e., from 0° to 15°, the values of lift generated are higher in NACA 0012 when compared to 1RR HPBA, whereas from 18° and above, the values of lift increased drastically in the 1RR HPBA model as shown in Figure 1c. This was due to the influence of the RR pattern in transonic flow. Based on Figure 3d, it is predicted that lift could be increased between the range 2.98% and 5.41% in the transonic flow regime.
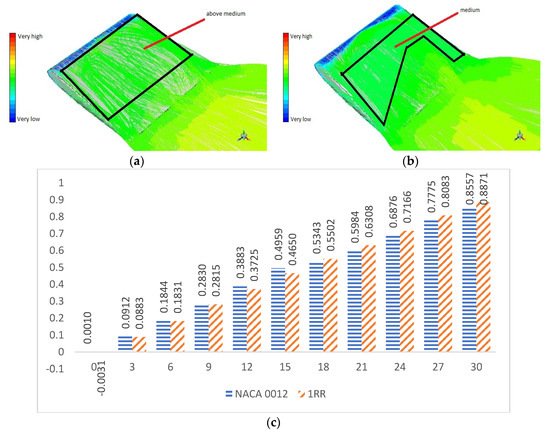
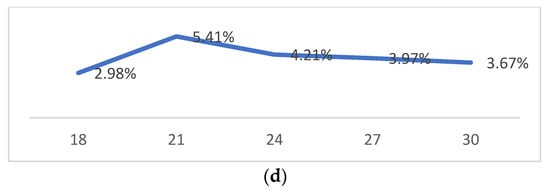
Figure 1. Lift analysis. (a) Pressure pathlines of NACA 0012. (b) Pressure pathlines of 1RR HPBA. (c) Lift generated at all angles of attack. (d) Lift increment in percentage.
3. Viscous Drag
Figure 2a clearly shows the distribution of skin friction on the top surface of NACA 0012 aerofoil. This shows that NACA 0012 has medium values of pressure near the leading edge. Generally, an aerofoil requires lower values of skin friction as indicated in Figure 2b in order to perform effectively. The larger concentration of medium values of friction were reduced to a shorter length with the use of the RR pattern. At low and medium angles of attack i.e., from 0° to 18°, the values of viscous forces are higher in NACA 0012 when compared to 1RR HPBA as shown in Figure 2c. This was due to the influence of the RR pattern in transonic flow. Based on Figure 4d, it is predicted that viscous forces could be reduced between the range of 3.36% and 9.98% in the transonic flow regime.
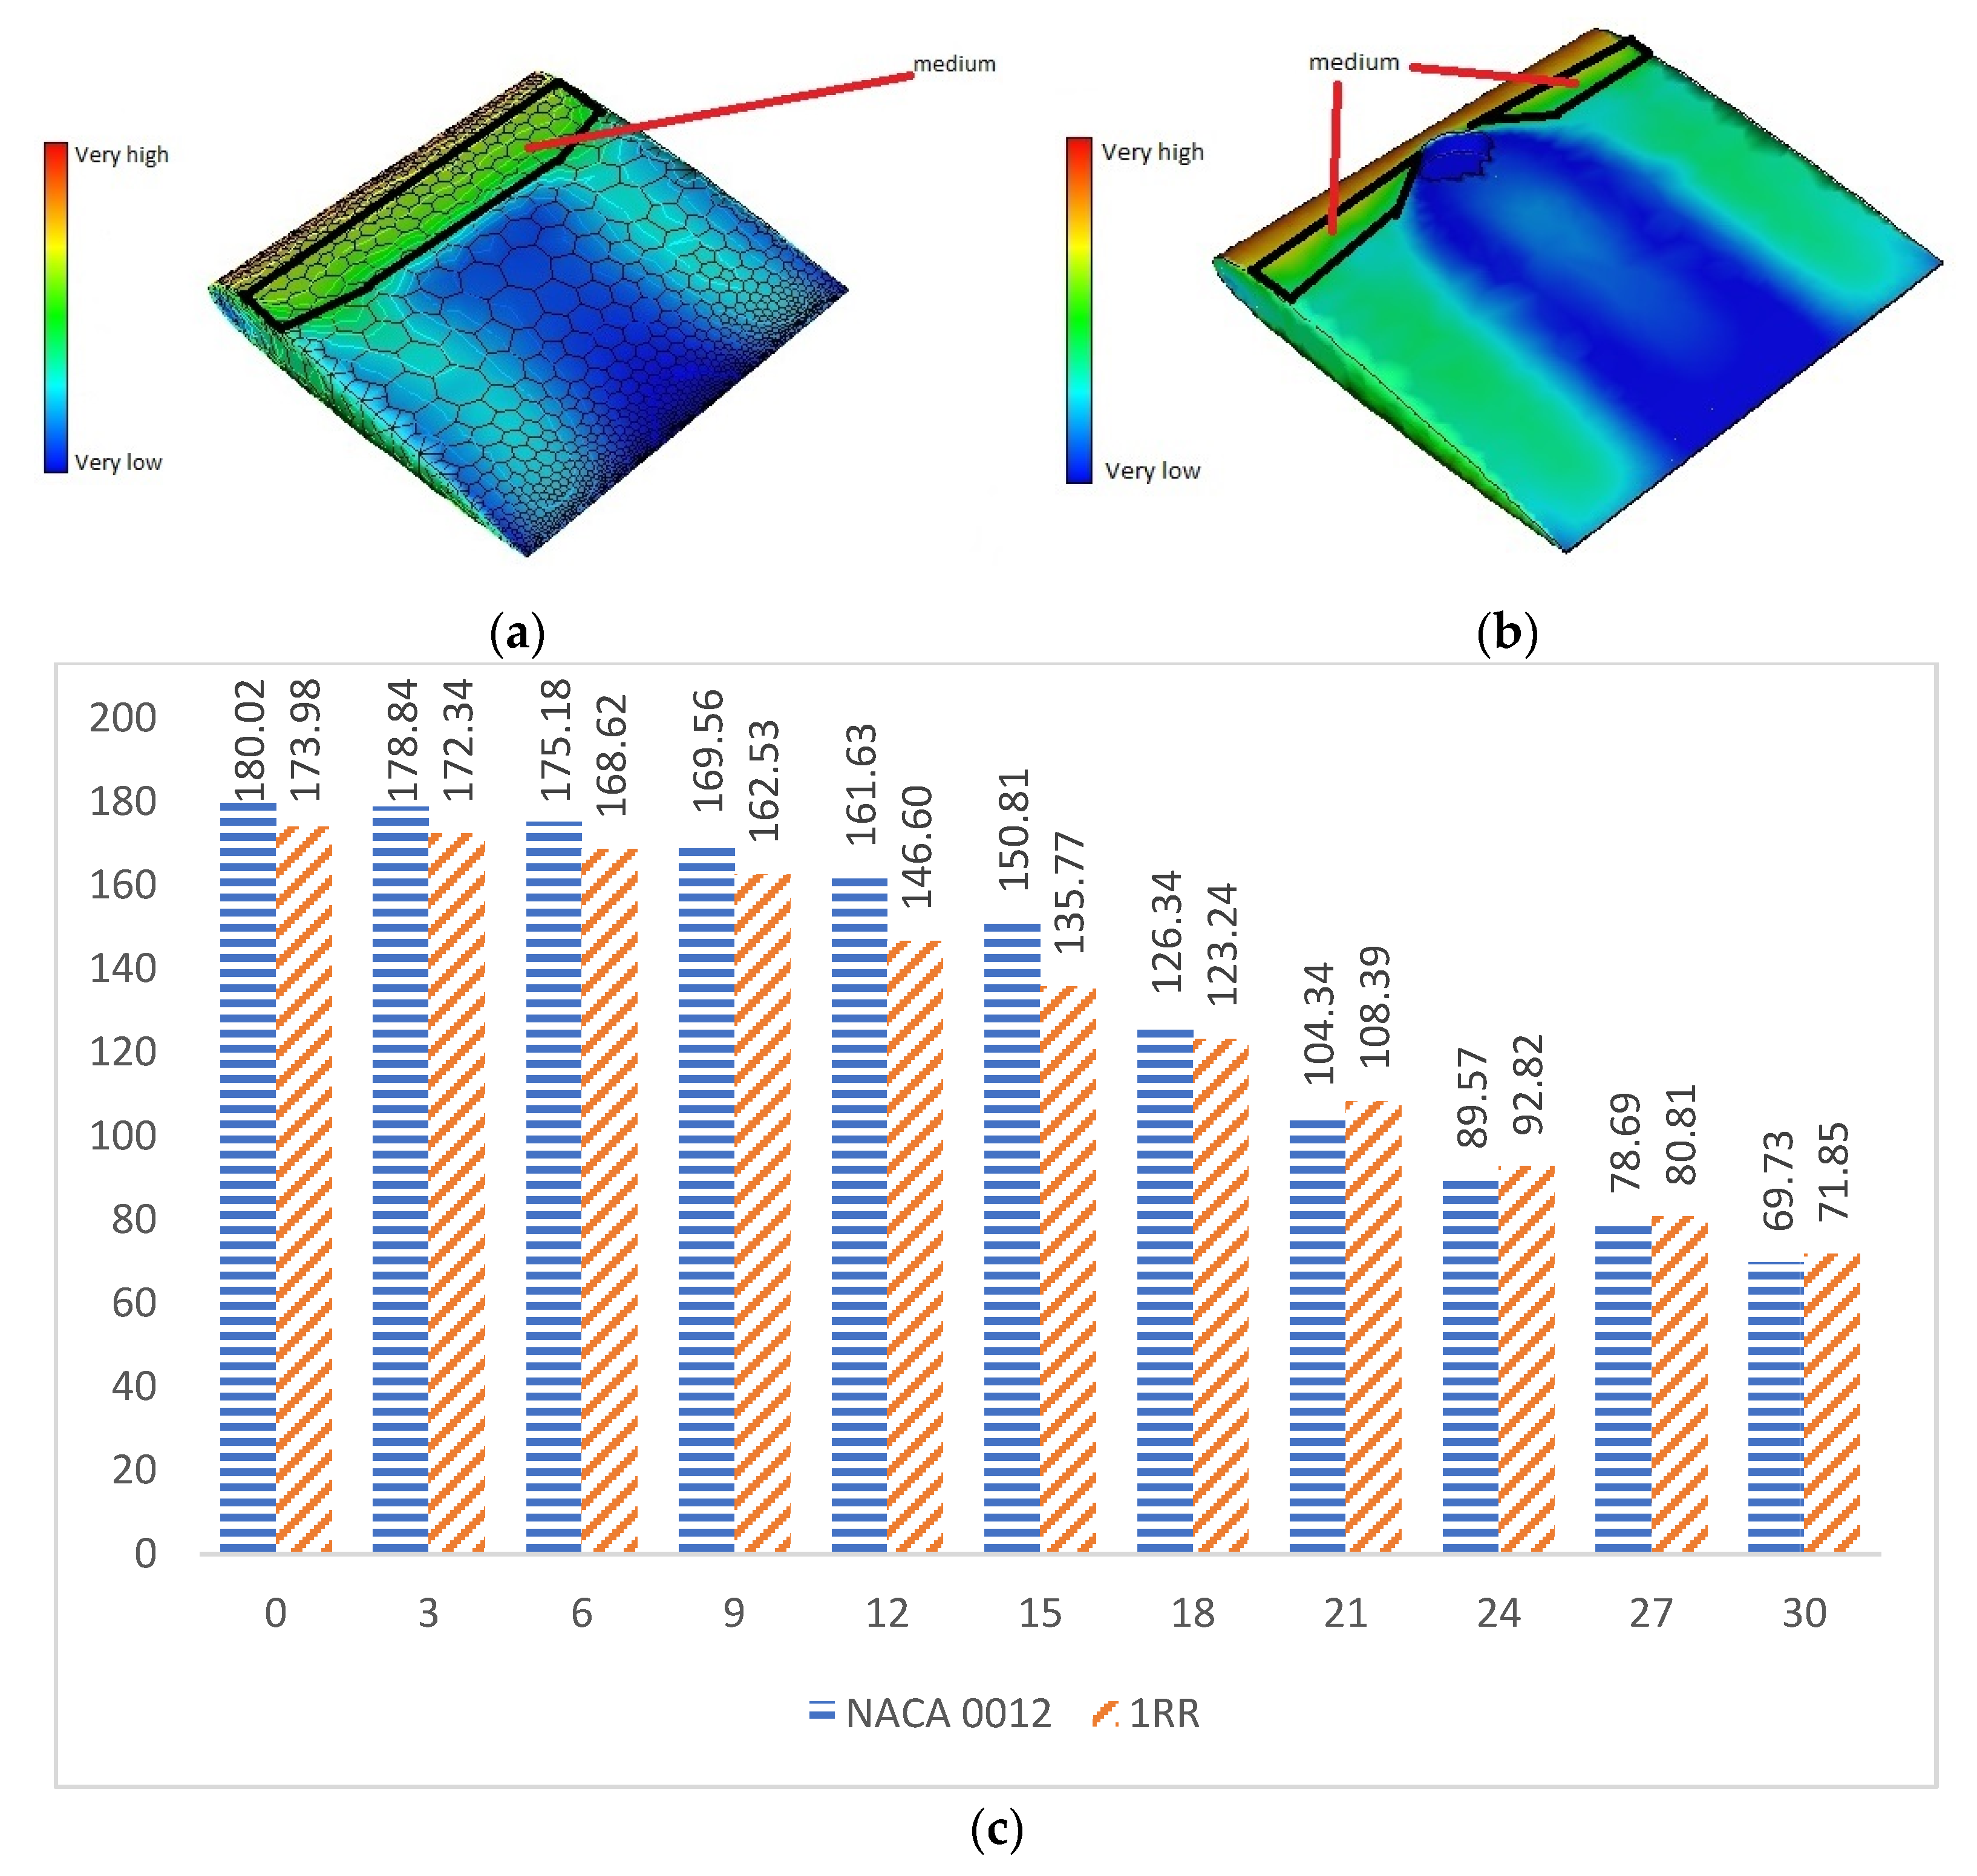
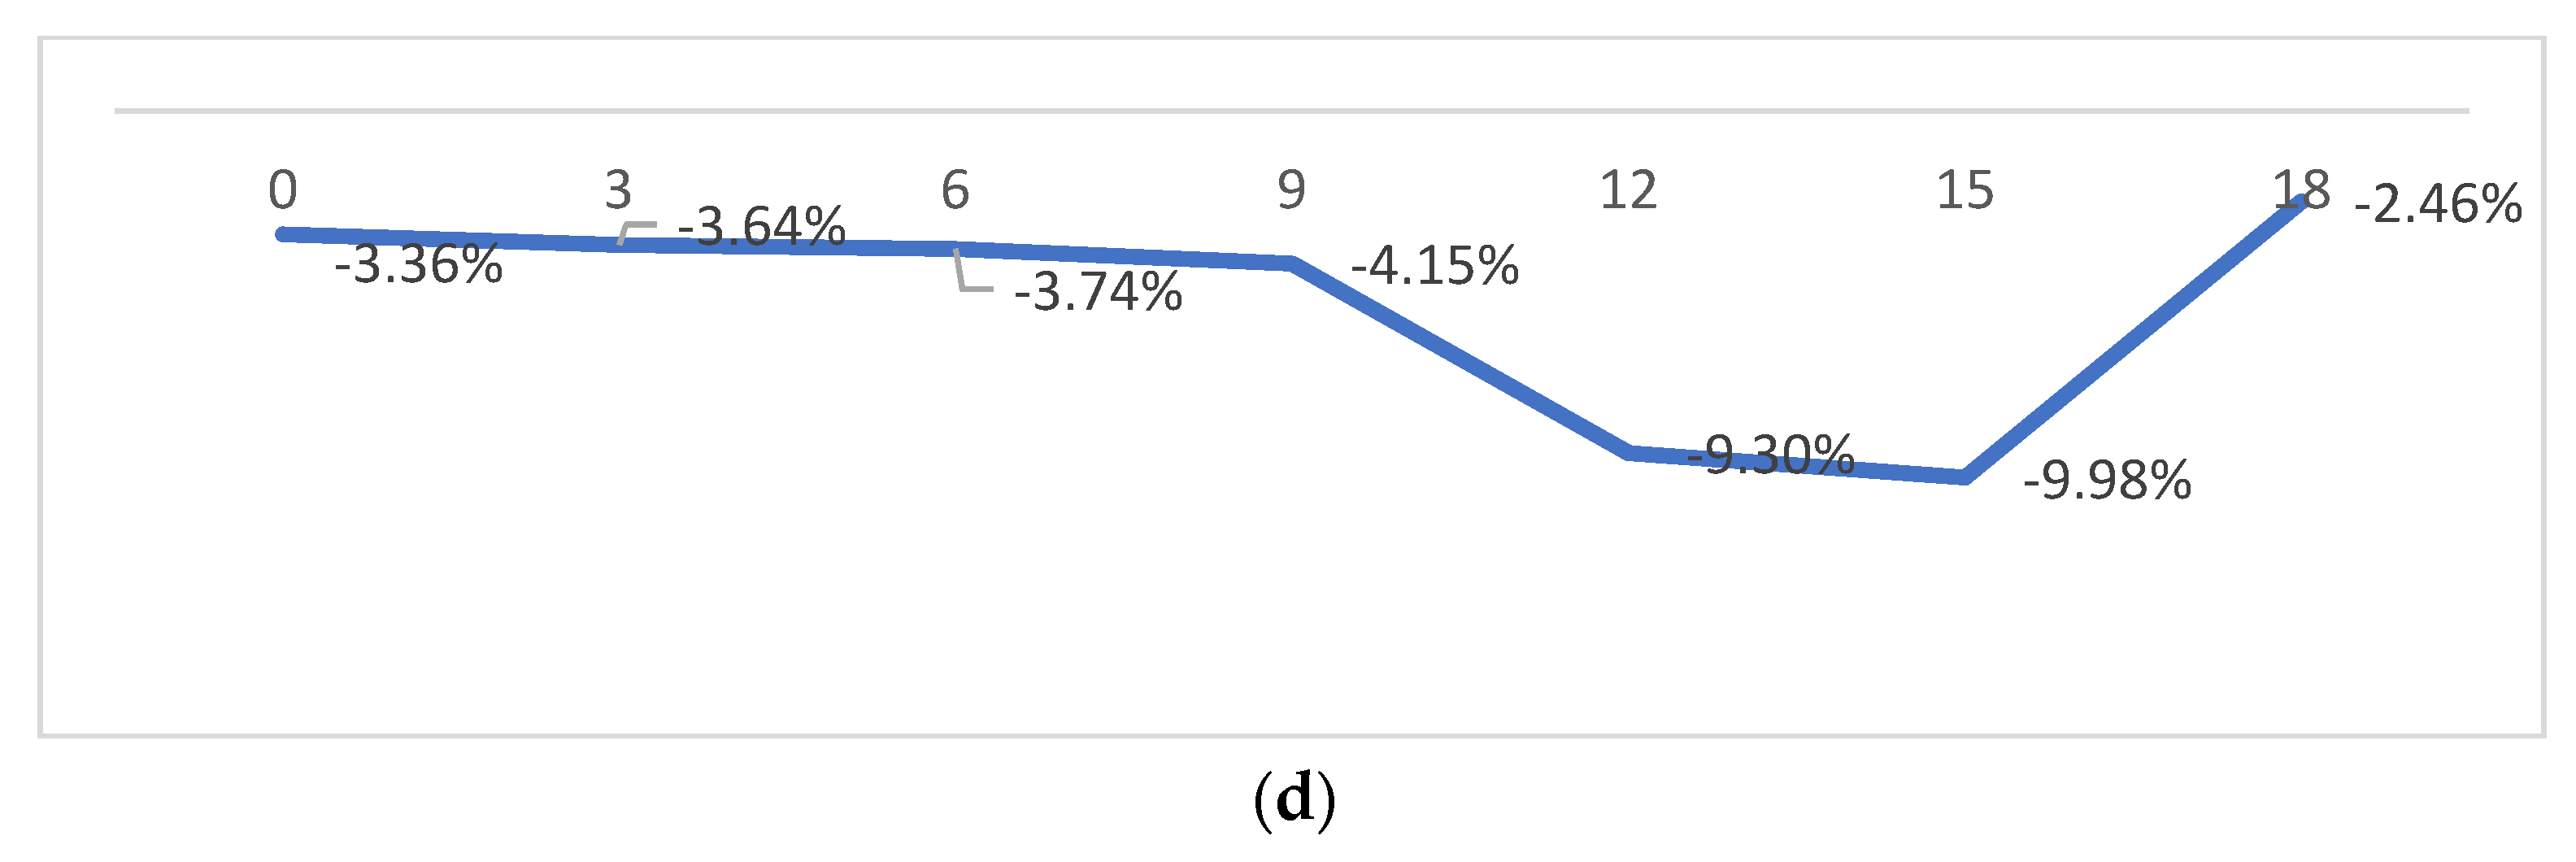
Figure 2. Viscous analysis. (a) Skin friction contour of NACA 0012. (b) Skin friction contour of 1RR HPBA. (c) Viscous generated at all angles of attack. (d) Viscous drag in percentage.
4. Influence of RR Pattern in Transonic Flow
At higher angles of attack, the fluid flow over an aerofoil reverses due to an increase in the adverse pressure gradient. RR pattern worked well with the reversed flows. When the airflow reversed, fluids entered the pattern through its tip way and reached the head of the RR pattern as shown in Figure 3a,b. These fluids circulated and re-reversed within the hollow section and elevated to the top surface. Thus, this straightened the fluid which helped it to flow along the normal direction. Due to the elevation of fluids above the top surface, the skin friction was reduced. Furthermore, the lift was increased due to the cultivation of disturbances within the hollow section of the fluid flow. These physical alterations in the fluid influenced by the RR pattern enabled the 1RR HPBA model to produce more lift and less viscous drag at many angles of attack.
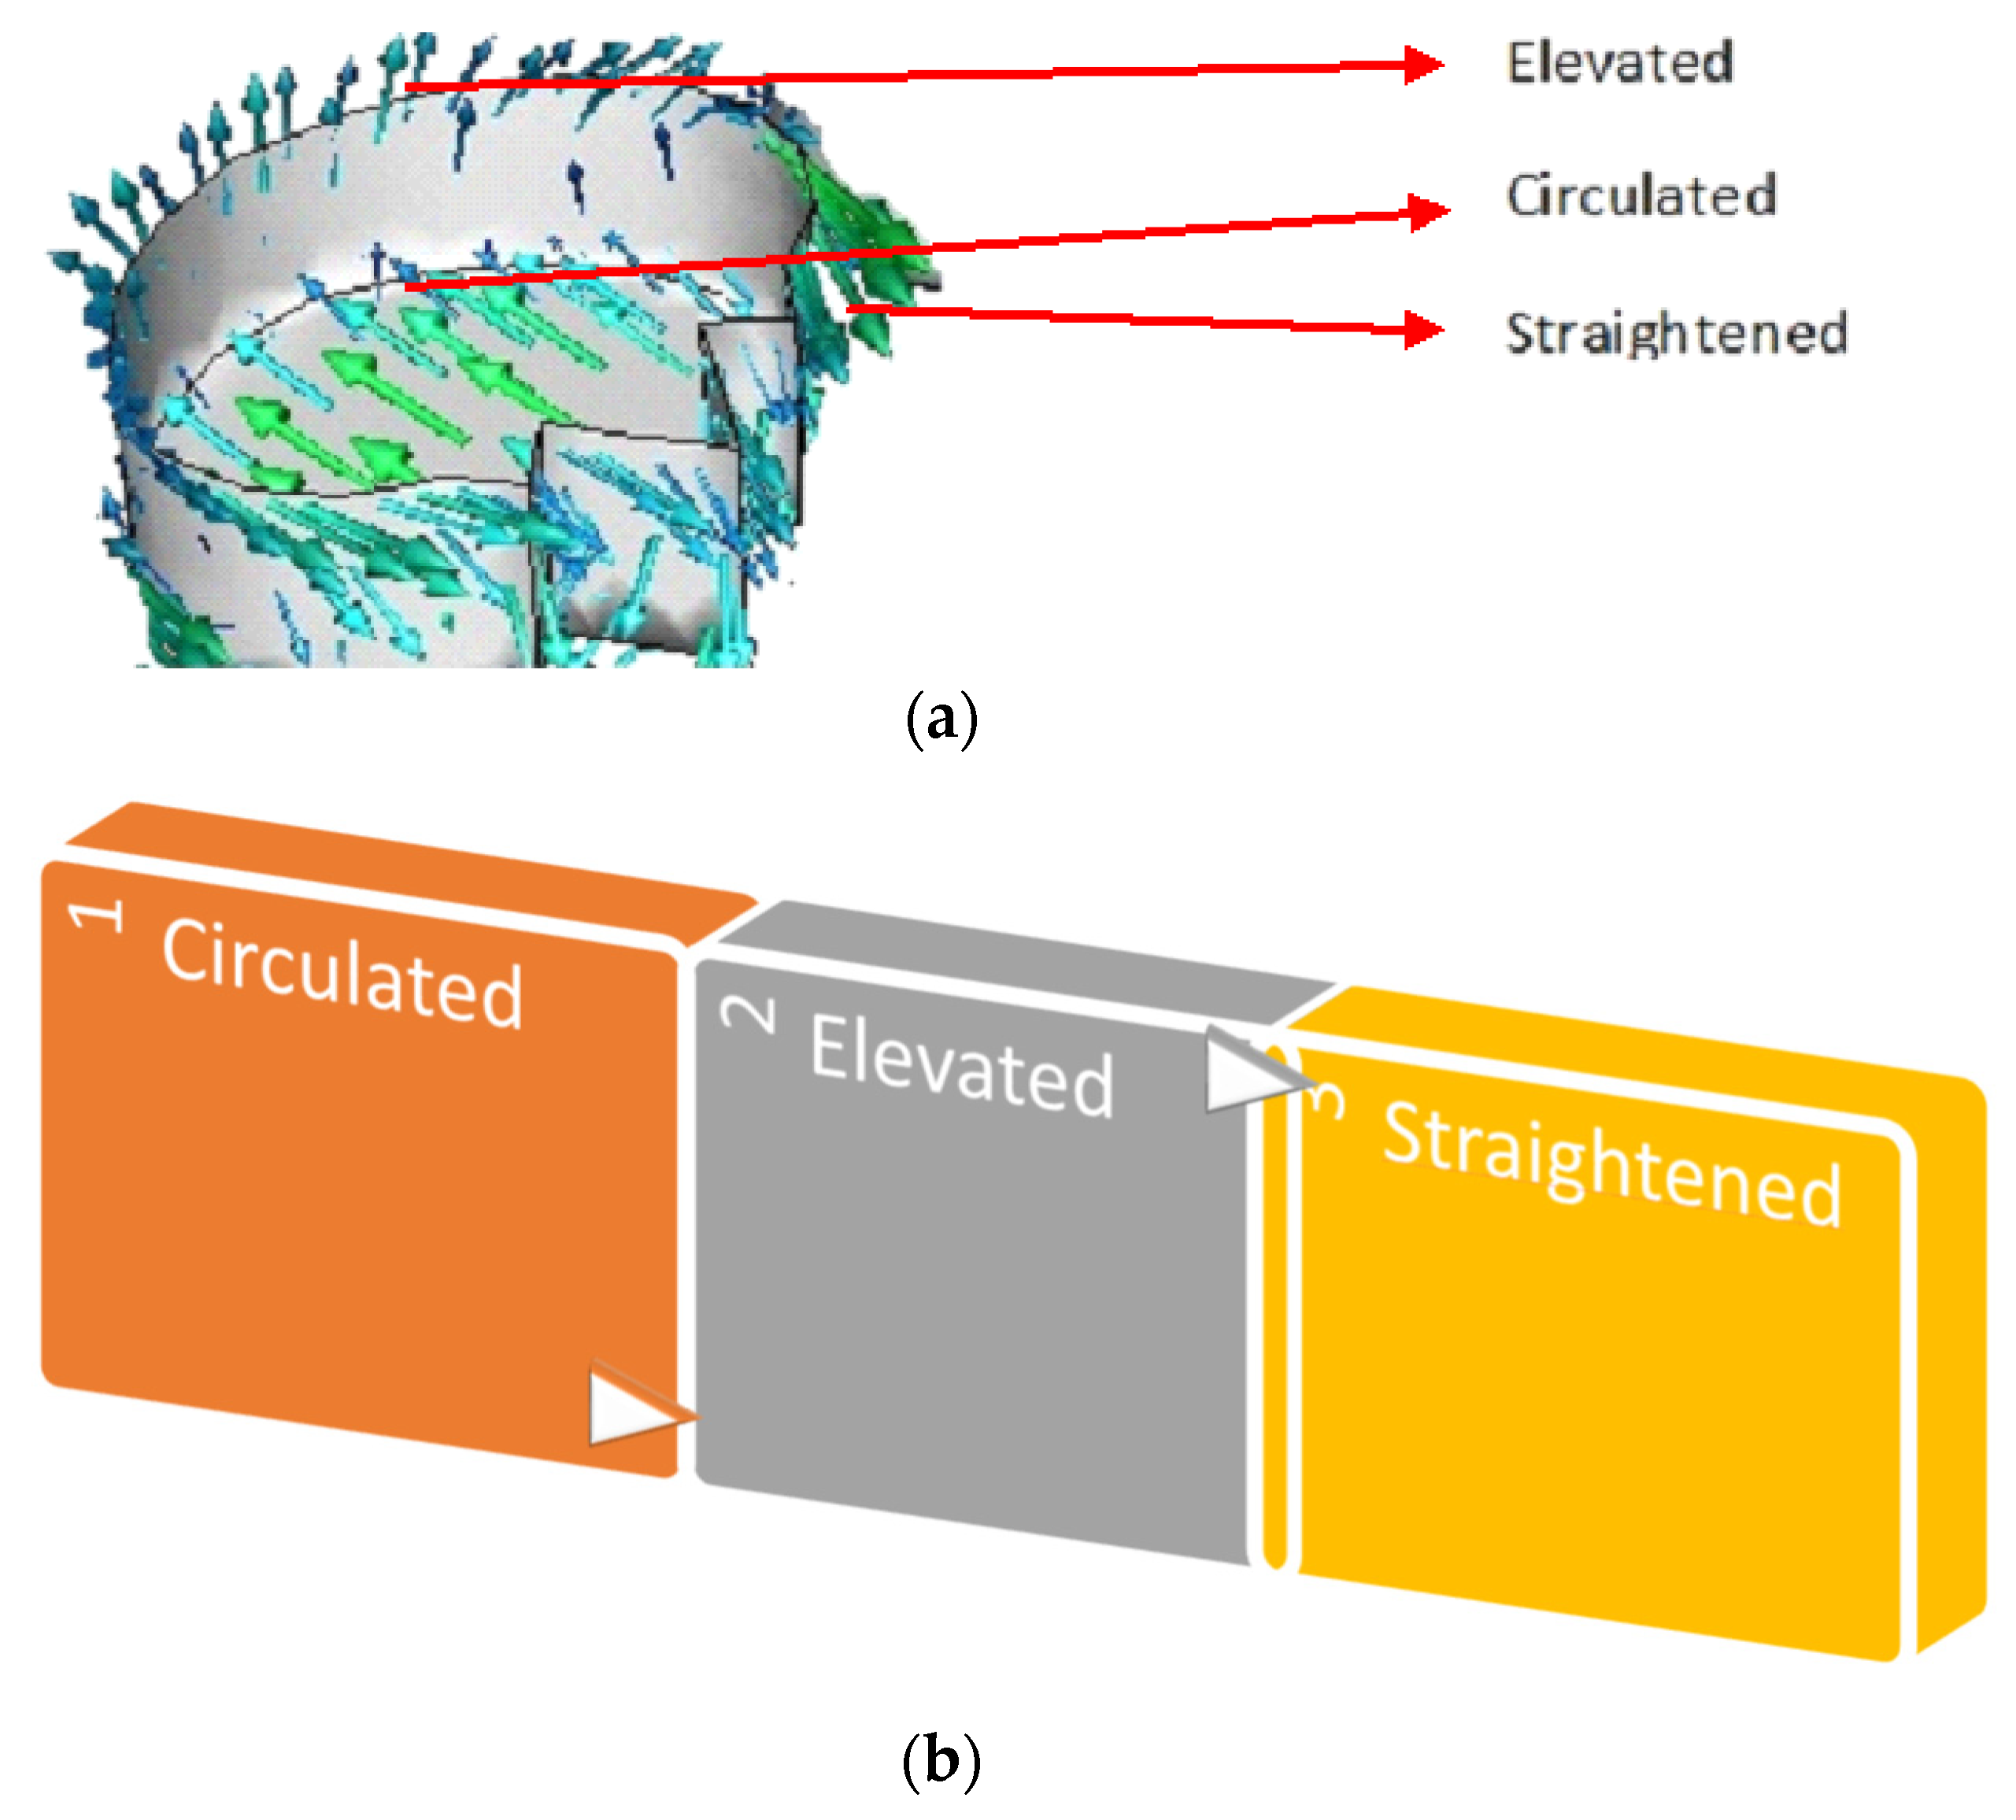
Figure 3. Fluid interaction. (a) Velocity vectors within the pattern. (b) Fluid flow sequence.
This entry is adapted from the peer-reviewed paper 10.3390/biomimetics7010020
This entry is offline, you can click here to edit this entry!