Your browser does not fully support modern features. Please upgrade for a smoother experience.
Please note this is an old version of this entry, which may differ significantly from the current revision.
Subjects:
Health Care Sciences & Services
The core corona dashboard depicts quantitative data—systemically decomposed—on key facts of the space and time spread of COVID-19 cases. There are three context-specific factors that determine the trajectory of the spread of the corona virus: (i) the degree of vaccination intensity in a given country; (ii) the policy stringency in coping with the virus; (iii) the degree of intensity of social contacts.
- corona dashboard
- infection cases
- hospital admission
- intensive care
- death cases
- vaccination
- policy stringency
1. COVID-19 Time Trajectories
The time trajectory of corona cases (beginning March 2020 until July 2021) in The Netherlands shows many fluctuations. Figure 1 describes the daily patterns (averaged over progressing weekly data) of the COVID-19 spread, measured in the number of infections, number of hospital admissions (including intensive care admissions) and number of deceased COVID-19 patients. This figure forms an empirical part of the broader corona dashboard designed in the context (see http//www.smart-city-dashboards.com, accessed on 1 July 2021). Two observations can be made on these curves: (i) there is a considerable correlation pattern between the three curves in this diagram in the initial stage of the corona disease; (ii) over the 18-month period, five corona waves can be identified, with rather different time intervals and amplitudes, however. In the last month of 2021, the impacts of the Omicron variant can already be observed.
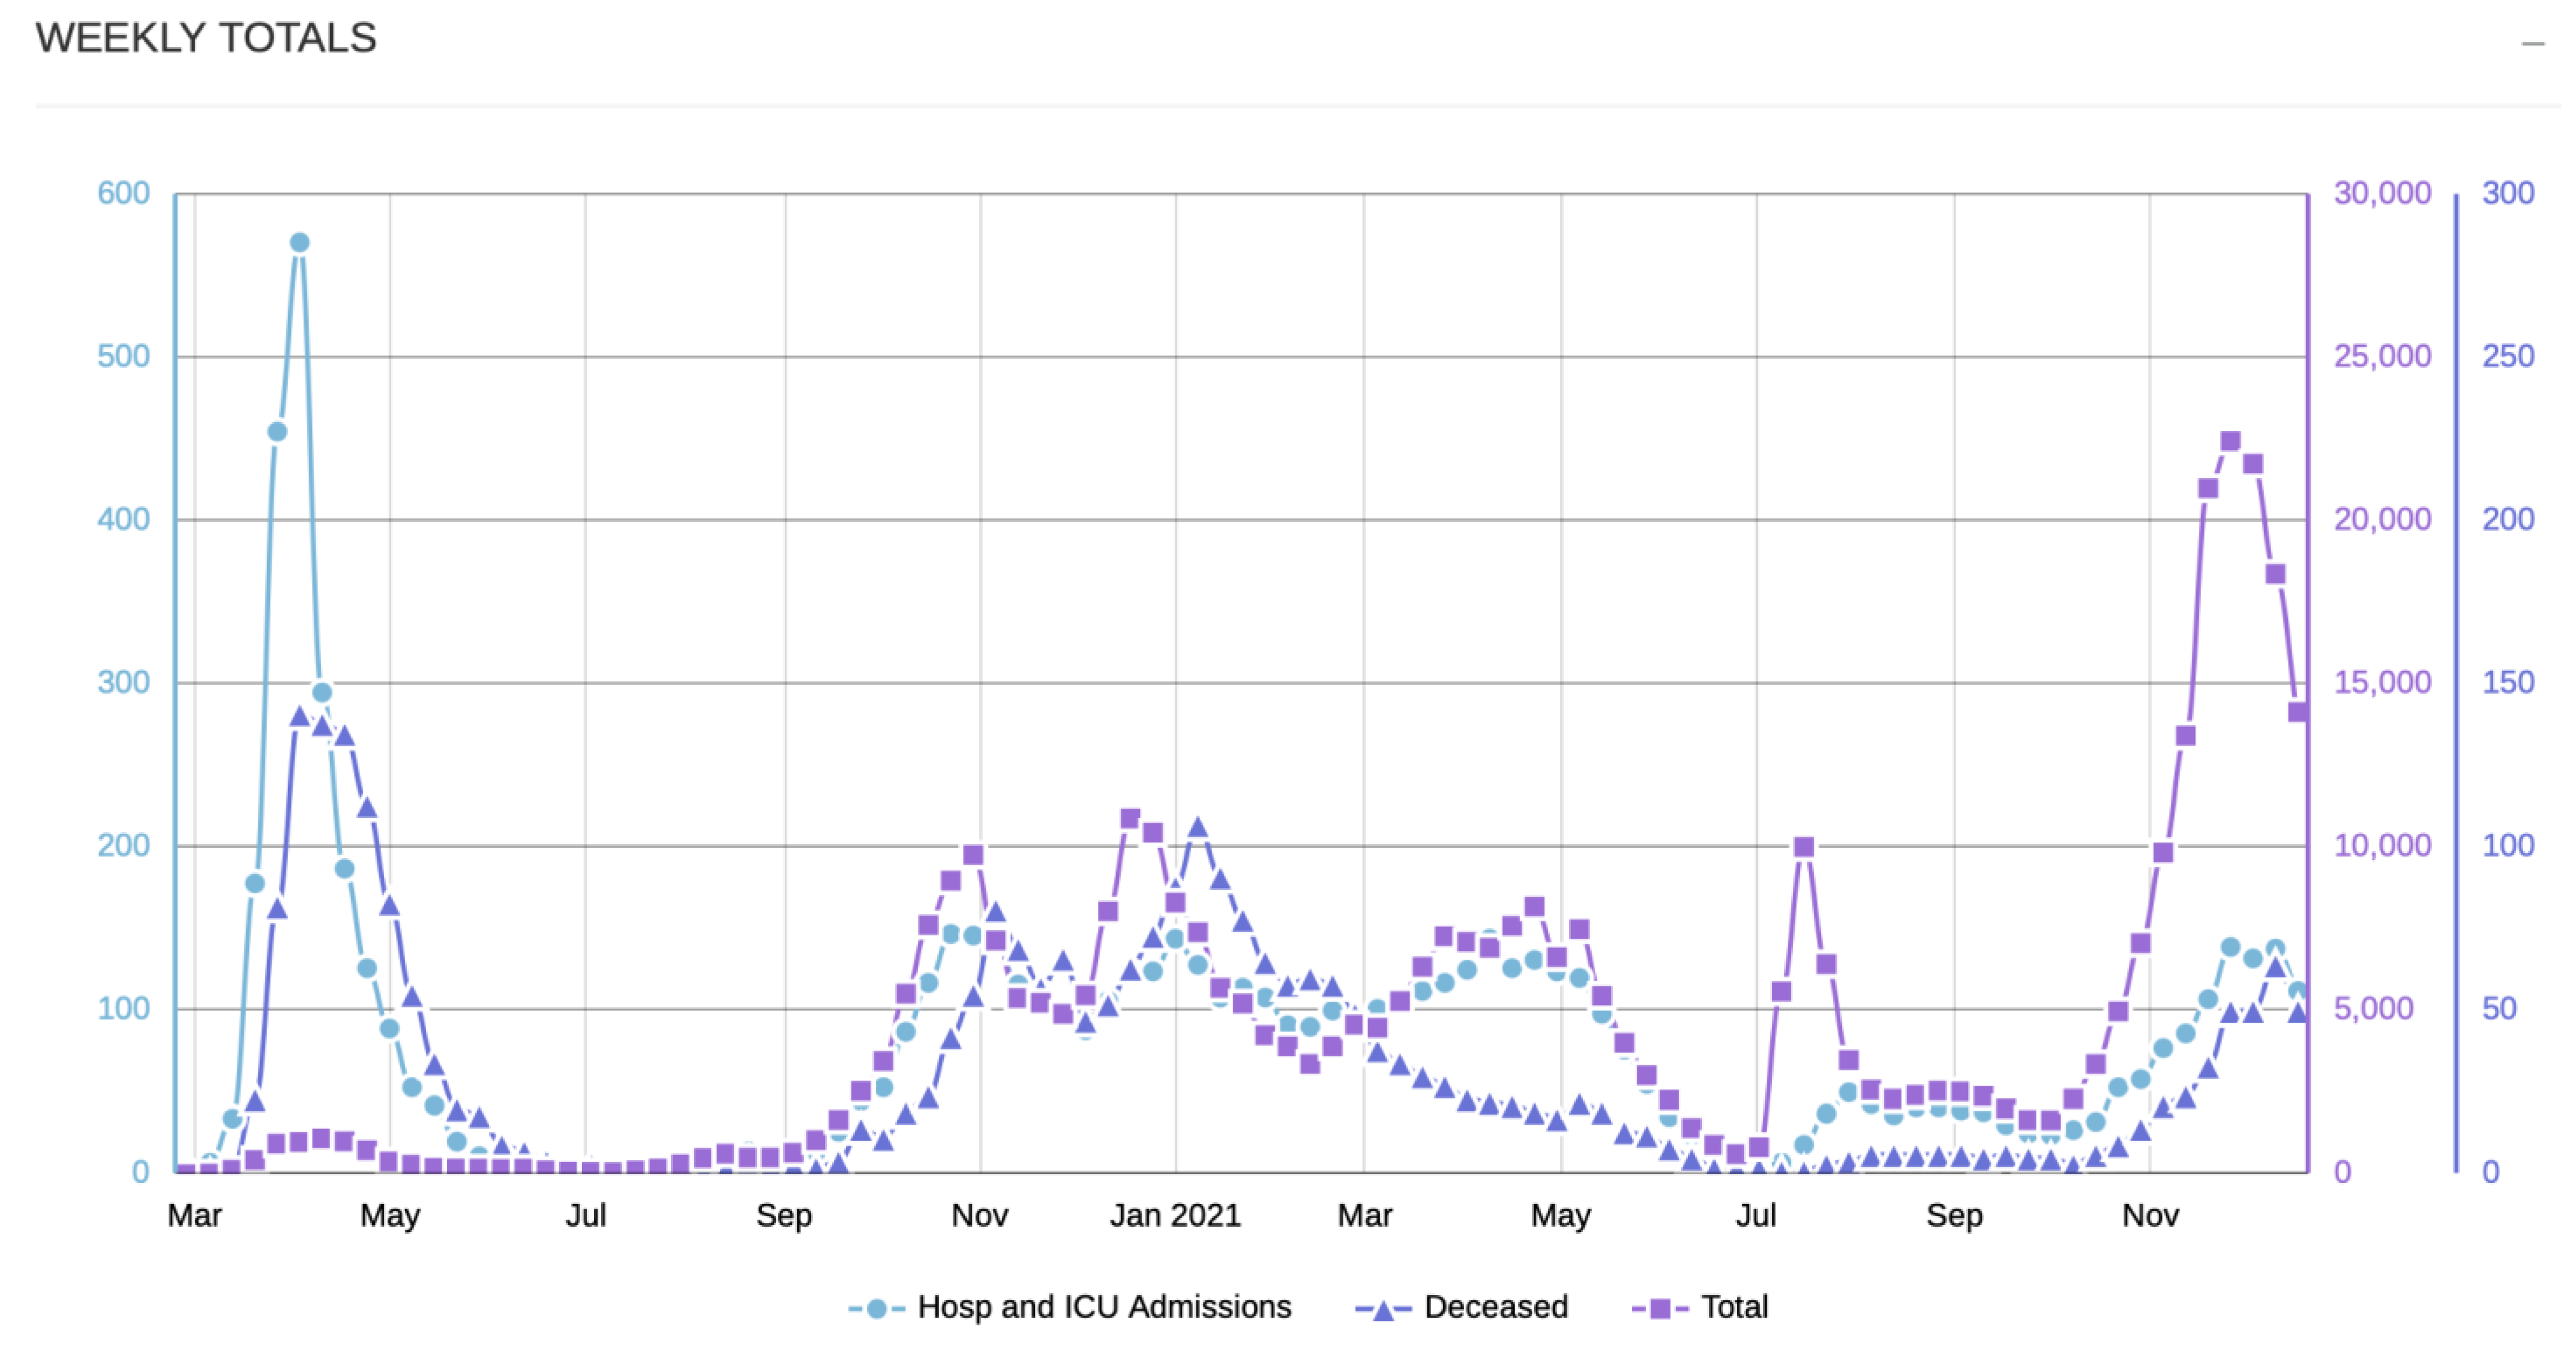
Figure 1. Illustration of corona patterns and curves: cases, December 2021. Source: The Center for Actionable Research of the Open University (CAROU), http://www.smartcity-dashboards.com, accessed on 15 December 2021. Authors’ own compilation.
It is an important question whether the shape and amplitude of these curves show a similarity with the patterns of the three aforementioned contextual factors, viz. vaccination, policy intensity and social contacts.
2. COVID-19 Vaccination Intensity
Right from the outset, it has immediately been argued by experts that next to a natural herd group immunisation, a strong vaccination programme would be the best way to get out of the crisis. The pharmaceutical industry has almost created a miracle by the extraordinarily fast invention, production and market entrance of various vaccines, of which in the western world AstraZeneca, Moderna, BioNTech Pfizer and Janssen are the most well-known. These four vaccines have different degrees of protection (also in regard to successive corona virus variants) and different vaccination conditions. Especially in the initial period (beginning of 2021), there was a real scarcity of all vaccines, so that the implementation of the vaccination programme showed many ups and downs. Furthermore, in addition to uncertain delivery schemes of these vaccines, health authorities in different countries developed a vaccination scheme that was co-determined by health conditions, age, vulnerability of groups, contact patterns of people, key professionals, or socio-economic status, so that the time trajectory of vaccinations—and hence of corona cases—was difficult to monitor and to control. Finally, many uncertainties and beliefs in ‘fake news’ also influenced the acceptance rates of the public.
The vaccination programmes in most countries started in the beginning of 2021 and showed different intensities and growth paths for most countries, with forerunners such as Israel and the UK, and with many backrunners in the developing world. Figure 2 shows that the vaccination programme in The Netherlands started somewhat slow in the first month of 2021, but then the country accelerated its vaccination efforts. It is noteworthy that daily vaccination data are not available due to a complicated recording and reporting system, with many agencies involved. Another complexity is formed by the doses needed for a full vaccination (two for AstraZeneca, Moderna and BionNTech Pfizer, and one for Janssen). Therefore, the current vaccination curves are not very accurate, especially if a subdivision is made according to the shares of the four abovementioned vaccines (see also Figure 3). It should be noted that gradually also more spatially disaggregate data on vaccinations become available.
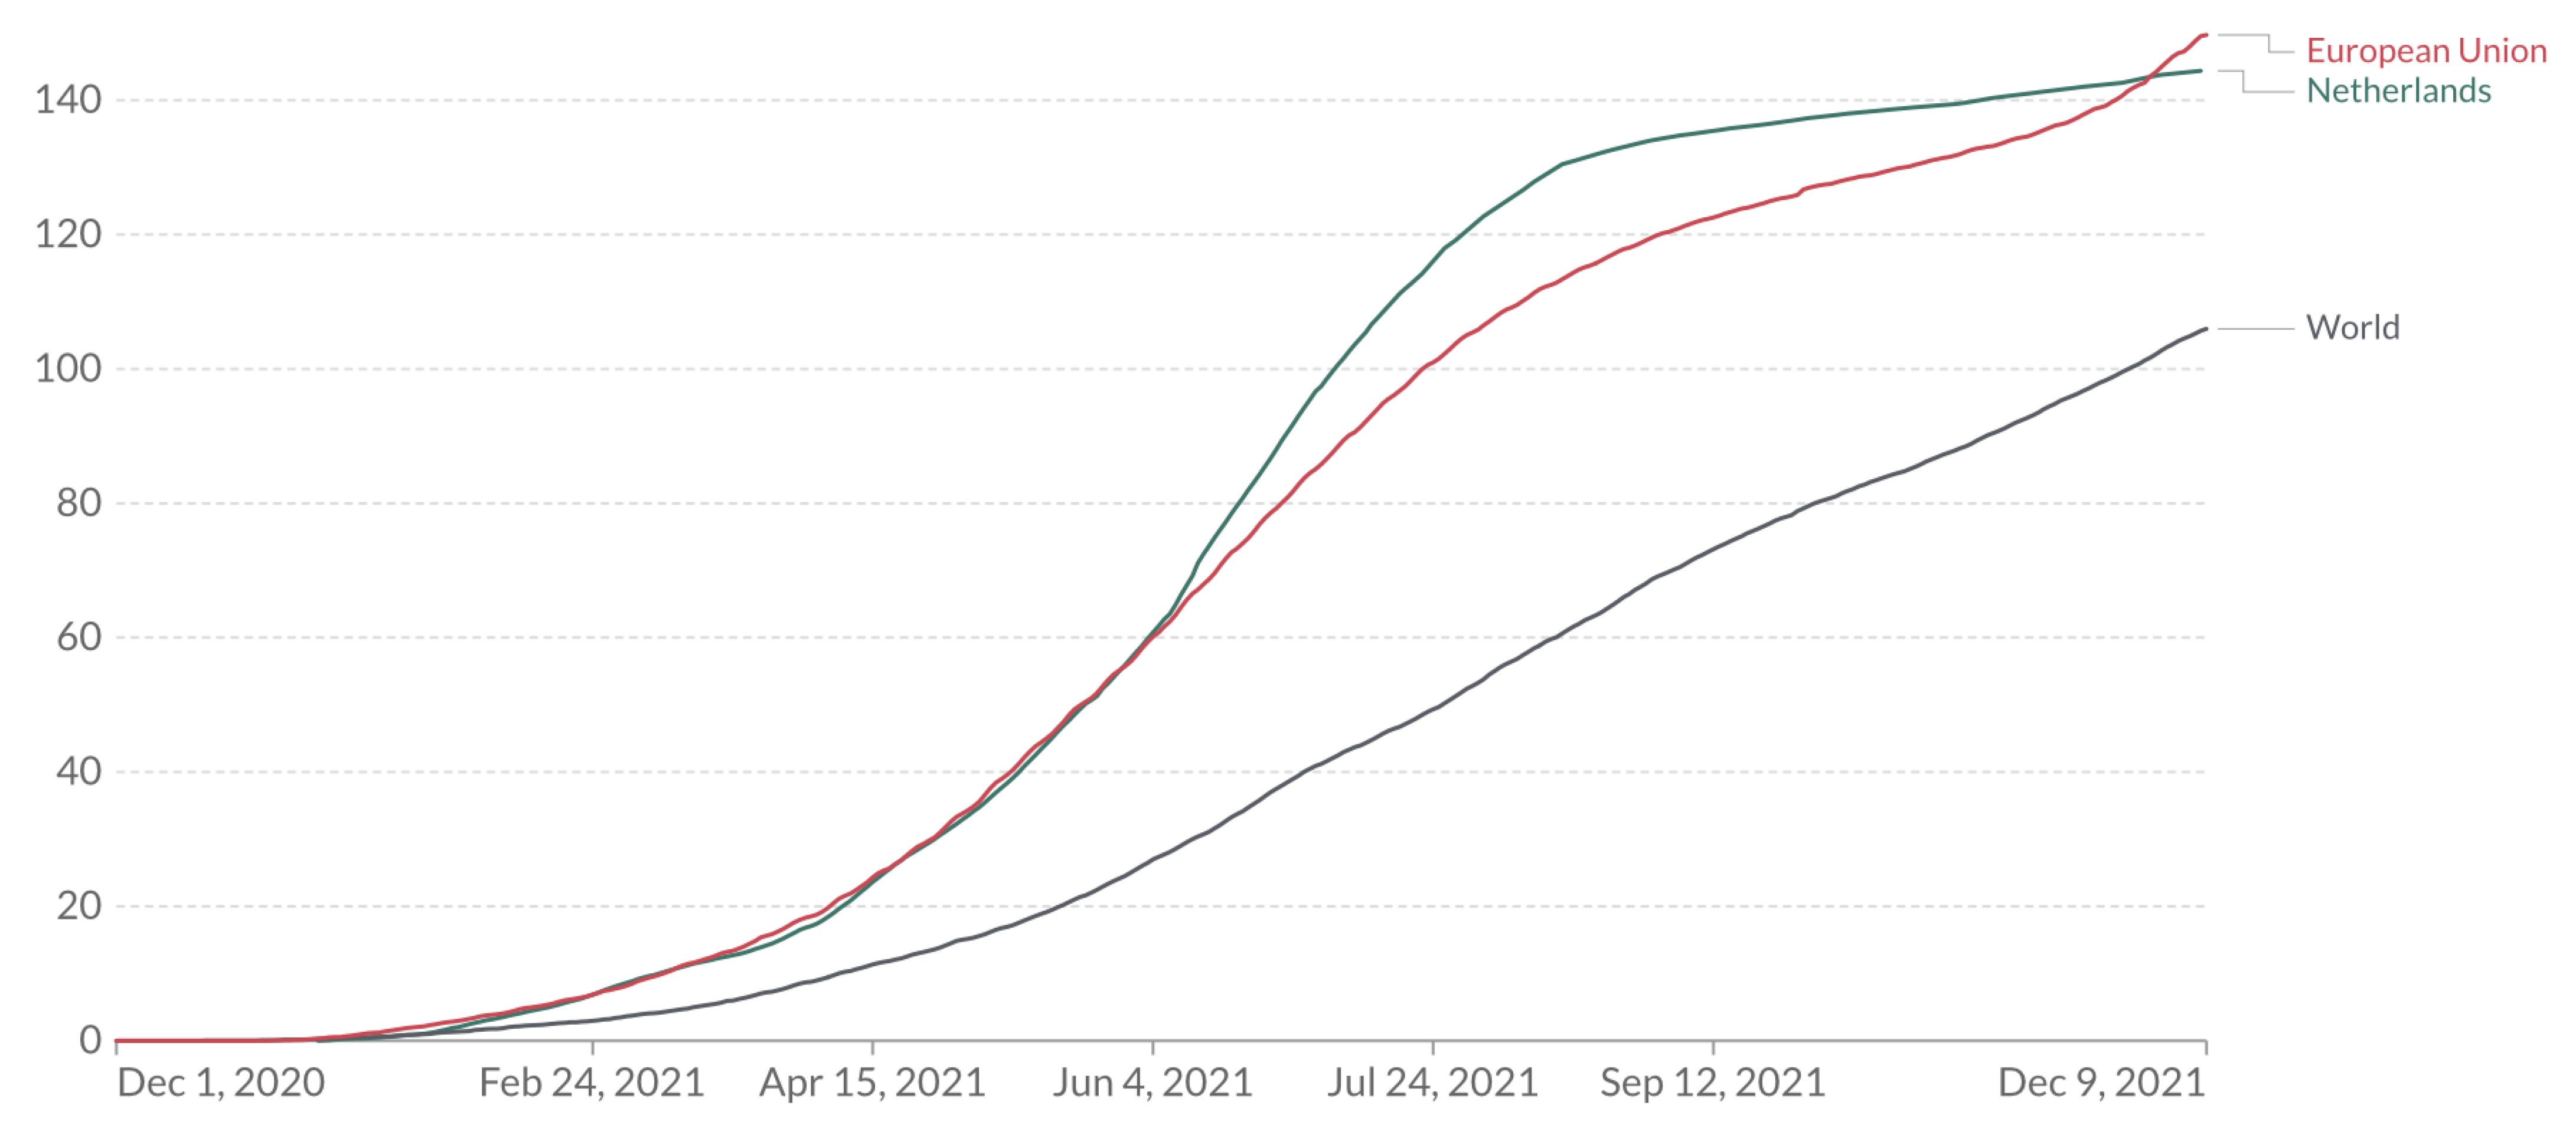
Figure 2. Illustration of COVID-19 vaccine doses administered per 100 people. Data source: Official data collection by Our World in Data (20 December 2021), Legend: For vaccines that require multiple doses, each individual dose is counted. As the same person may receive more than one dose, the number of doses per 100 people can be higher than 100.
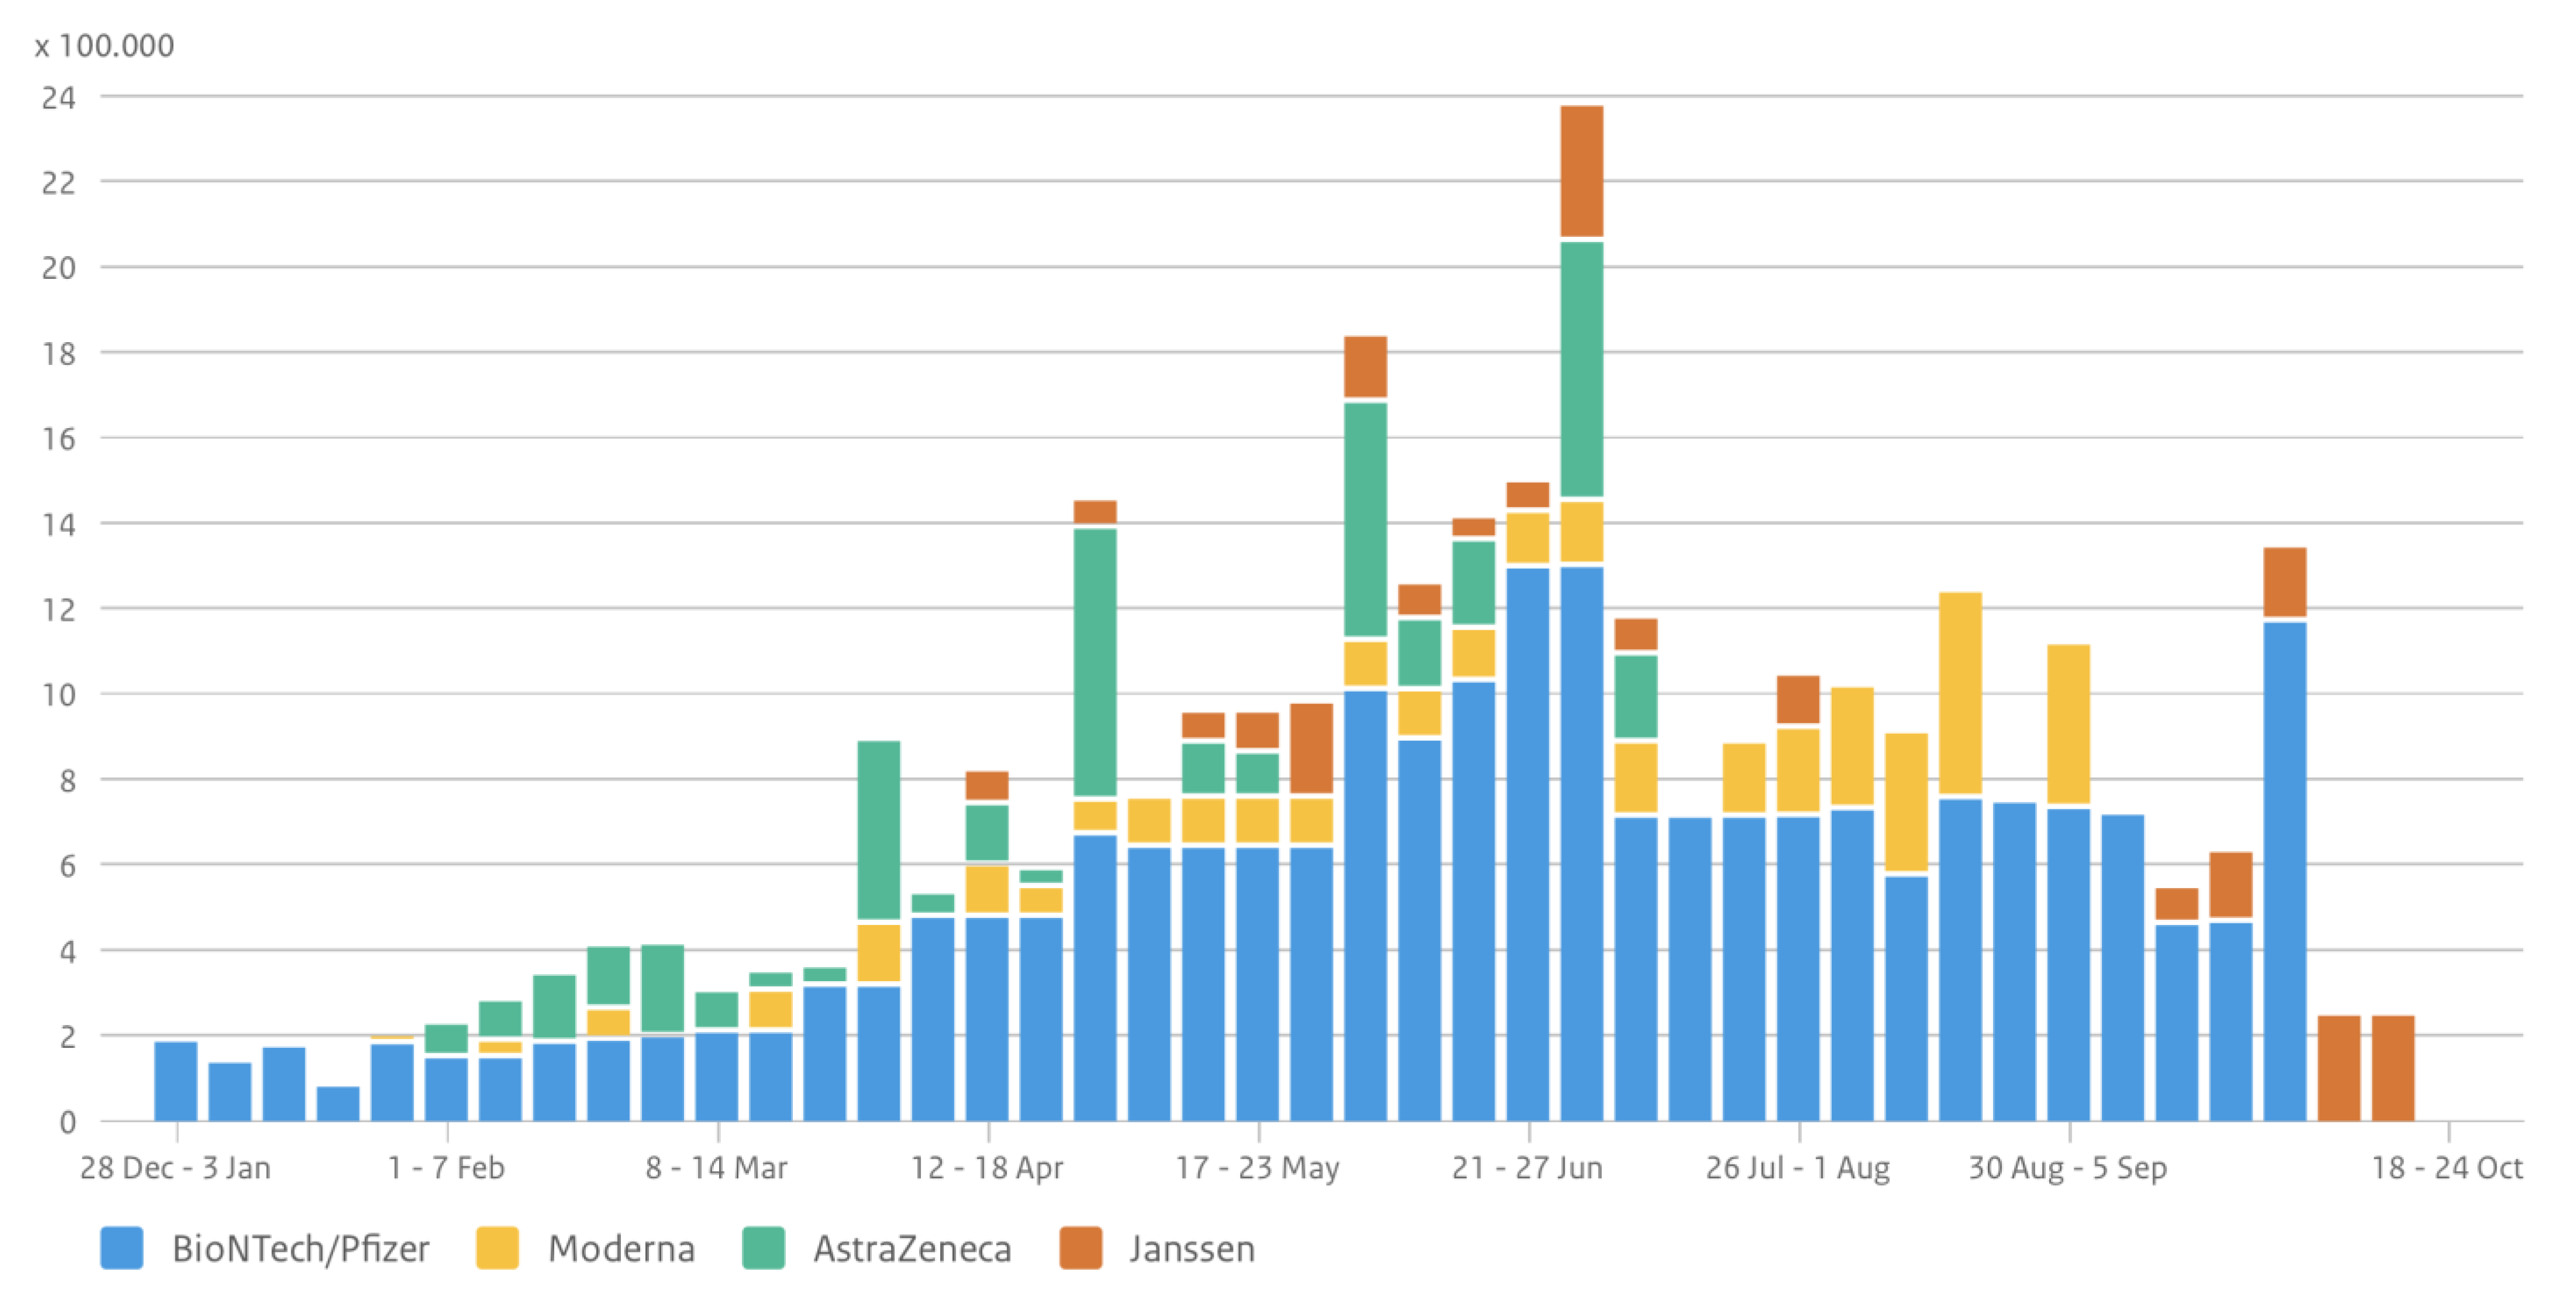
Figure 3. Illustration of different vaccines used in The Netherlands. Source: RIVM.
One might expect an increasing impact of the rising vaccinations curves over the first six months of 2021, but this is—in light of the fourth corona wave in the end of June and beginning of July (see Figure 5)—not a valid assumption, unless other intervening factors can be identified.
3. COVID-19 Policy Intensity
The unexpected sudden rise of the worldwide corona crisis has led to a variety of uncoordinated policy interventions in many countries, regions and cities. Three types of governmental interventions can be distinguished:
-
Health care responses, such as compulsory use of face masks, discouragement of handshaking contacts, social distancing, many test stations for COVID-19, network or contact tracing in case of positive corona tests, etc.;
-
Containment measures, so as to create restricted ‘social bubbles’, such as abandonment of family visits, school closures, prohibition of sports or cultural events, closure of bars, restaurants or hotels, discouragement of physical work presence, and stimulation of online activities (home office);
-
Economic support and incentive measures, so as to keep business alive or to support low-income groups, such as loans or tax reliefs for entrepreneurs or income transfers to vulnerable socio-economic groups.
Most of the policy intervention data are only available at the national level; given the small scale of the country, a locally or regionally differentiated policy has proven to be not very feasible. Since the COVID-19 policy interventions, the Global Oxford COVID-19 Government Response Tracker has been designed and put into operation with a view to a systematic information collection on a great variety of policy responses and measures regarding the pandemic, based on 23 indicators classified according to the above trichotomic categorisation. This is a rich open-access database that covers at present almost all countries. It has led to the definition and measurement of a policy stringency index measured on a scale from 1 to 100. Most policy stringency data are recorded on a national level and permanently updated, but do not display daily information, so that a straightforward comparison with the corona curves or the vaccination curves is not possible. Figure 4 depicts the development of the intensity of COVID-19 policy intervention schemes for The Netherlands. It is noteworthy that a straightforward correlation with the curve on corona cases is hard to find, although it should be mentioned that the sudden drop of lockdown and other measures in the second part of June 2021 is rather soon followed by a very sharp rise of the corona infection curve (mainly young people) in the first two weeks of July 2021, which is a plausible outcome.
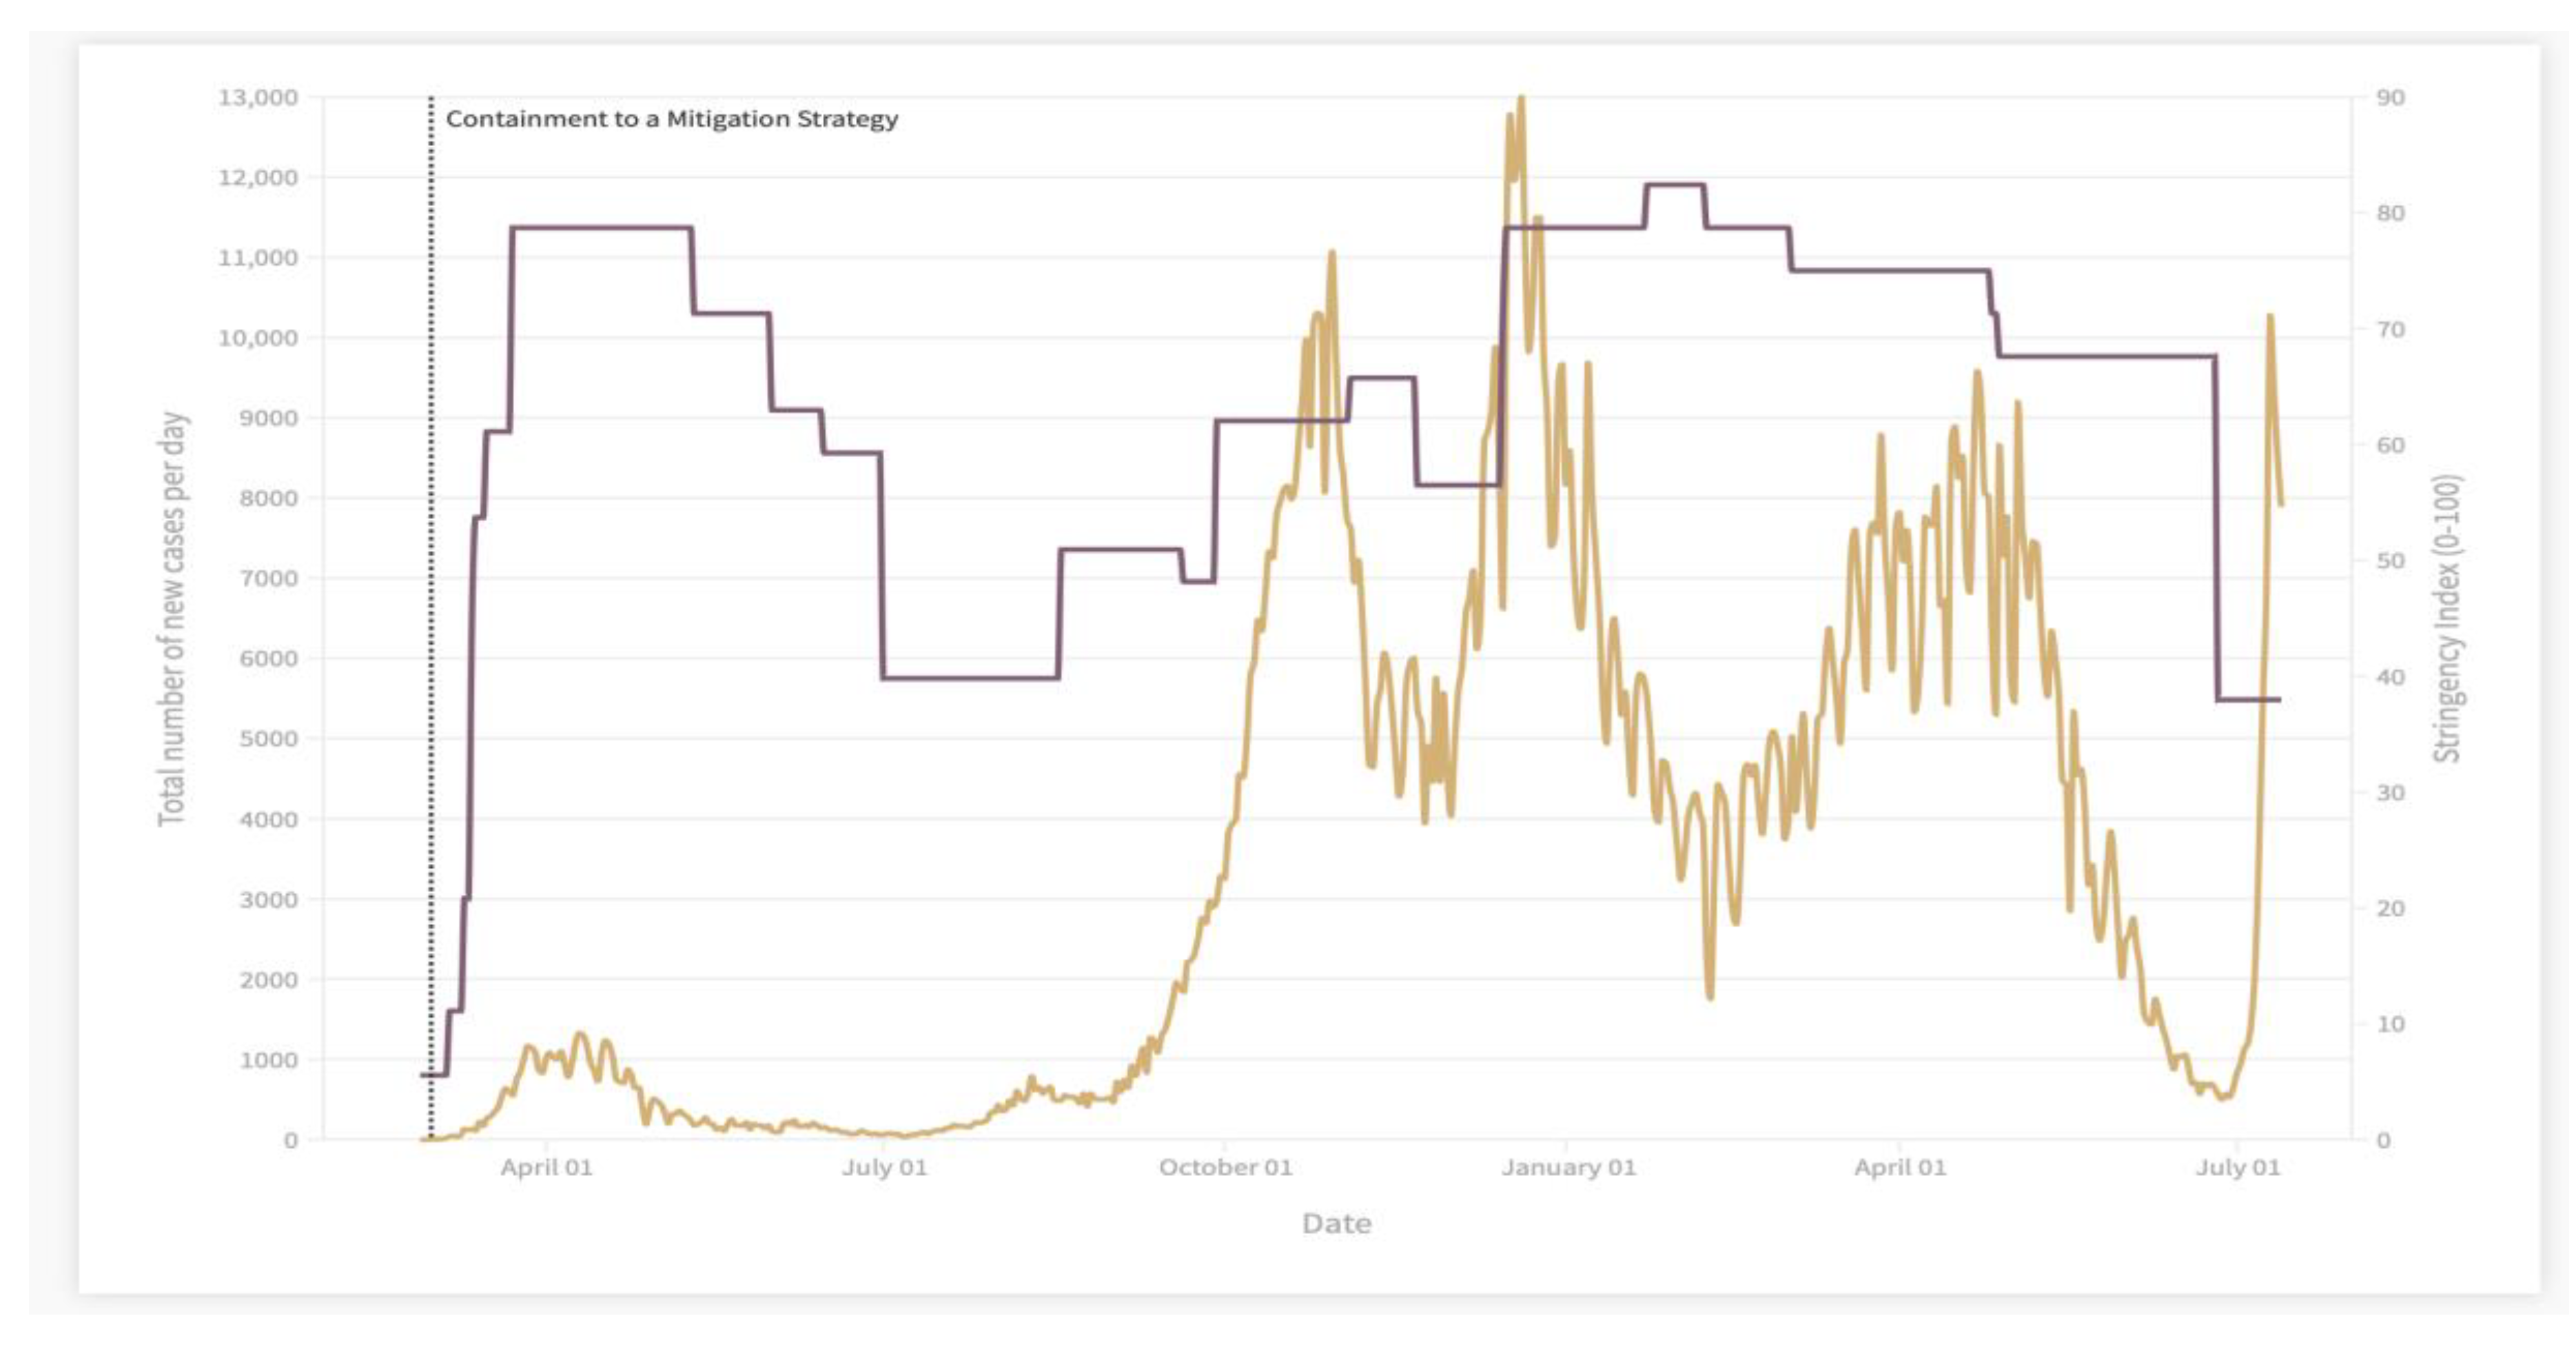
Figure 4. Illustration of policy stringency curve and number of cases in The Netherlands. Data sources: Official data collection by Our World in Data and RIVM. Authors’ own compilation.
In general, however, the amplitude, slope and curvature of the three curves depicted so far do not show a clear direct correspondence. Therefore, it is important to examine a fourth background factor for the COVID-19 spread, viz. physical social contact.
4. COVID-19 Contact and Mobility Patterns
The spread of COVID-19 is caused by close physical contact proximity and interaction [1][2][3]. Such data on the individual level hardly exist (with a few exceptions, such as data from a corona app). The intensity of human interaction can be approximated by disaggregate mobility data. Since spatial mobility is a derived demand, it is evident that mobile people travel for social contact, work, entertainment, shopping etc., and thus, detailed daily mobility data provide a proxy for the intensity of social interaction in an economy [4][5].
The advantage of this database is that it makes a distinction into different main classes of travel motives, such as: retailing, shopping, recreation, groceries, pharmacies, parks, workplaces, transit stations, residential social visits, etc. This is a rich source of information and may be used as a proxy for social contacts (or inversely, of ‘social distancing’). Figure 5 provides a visualisation of daily interaction or mobility patterns in The Netherlands—in relation to a baseline profile—since the beginning of the pandemic.
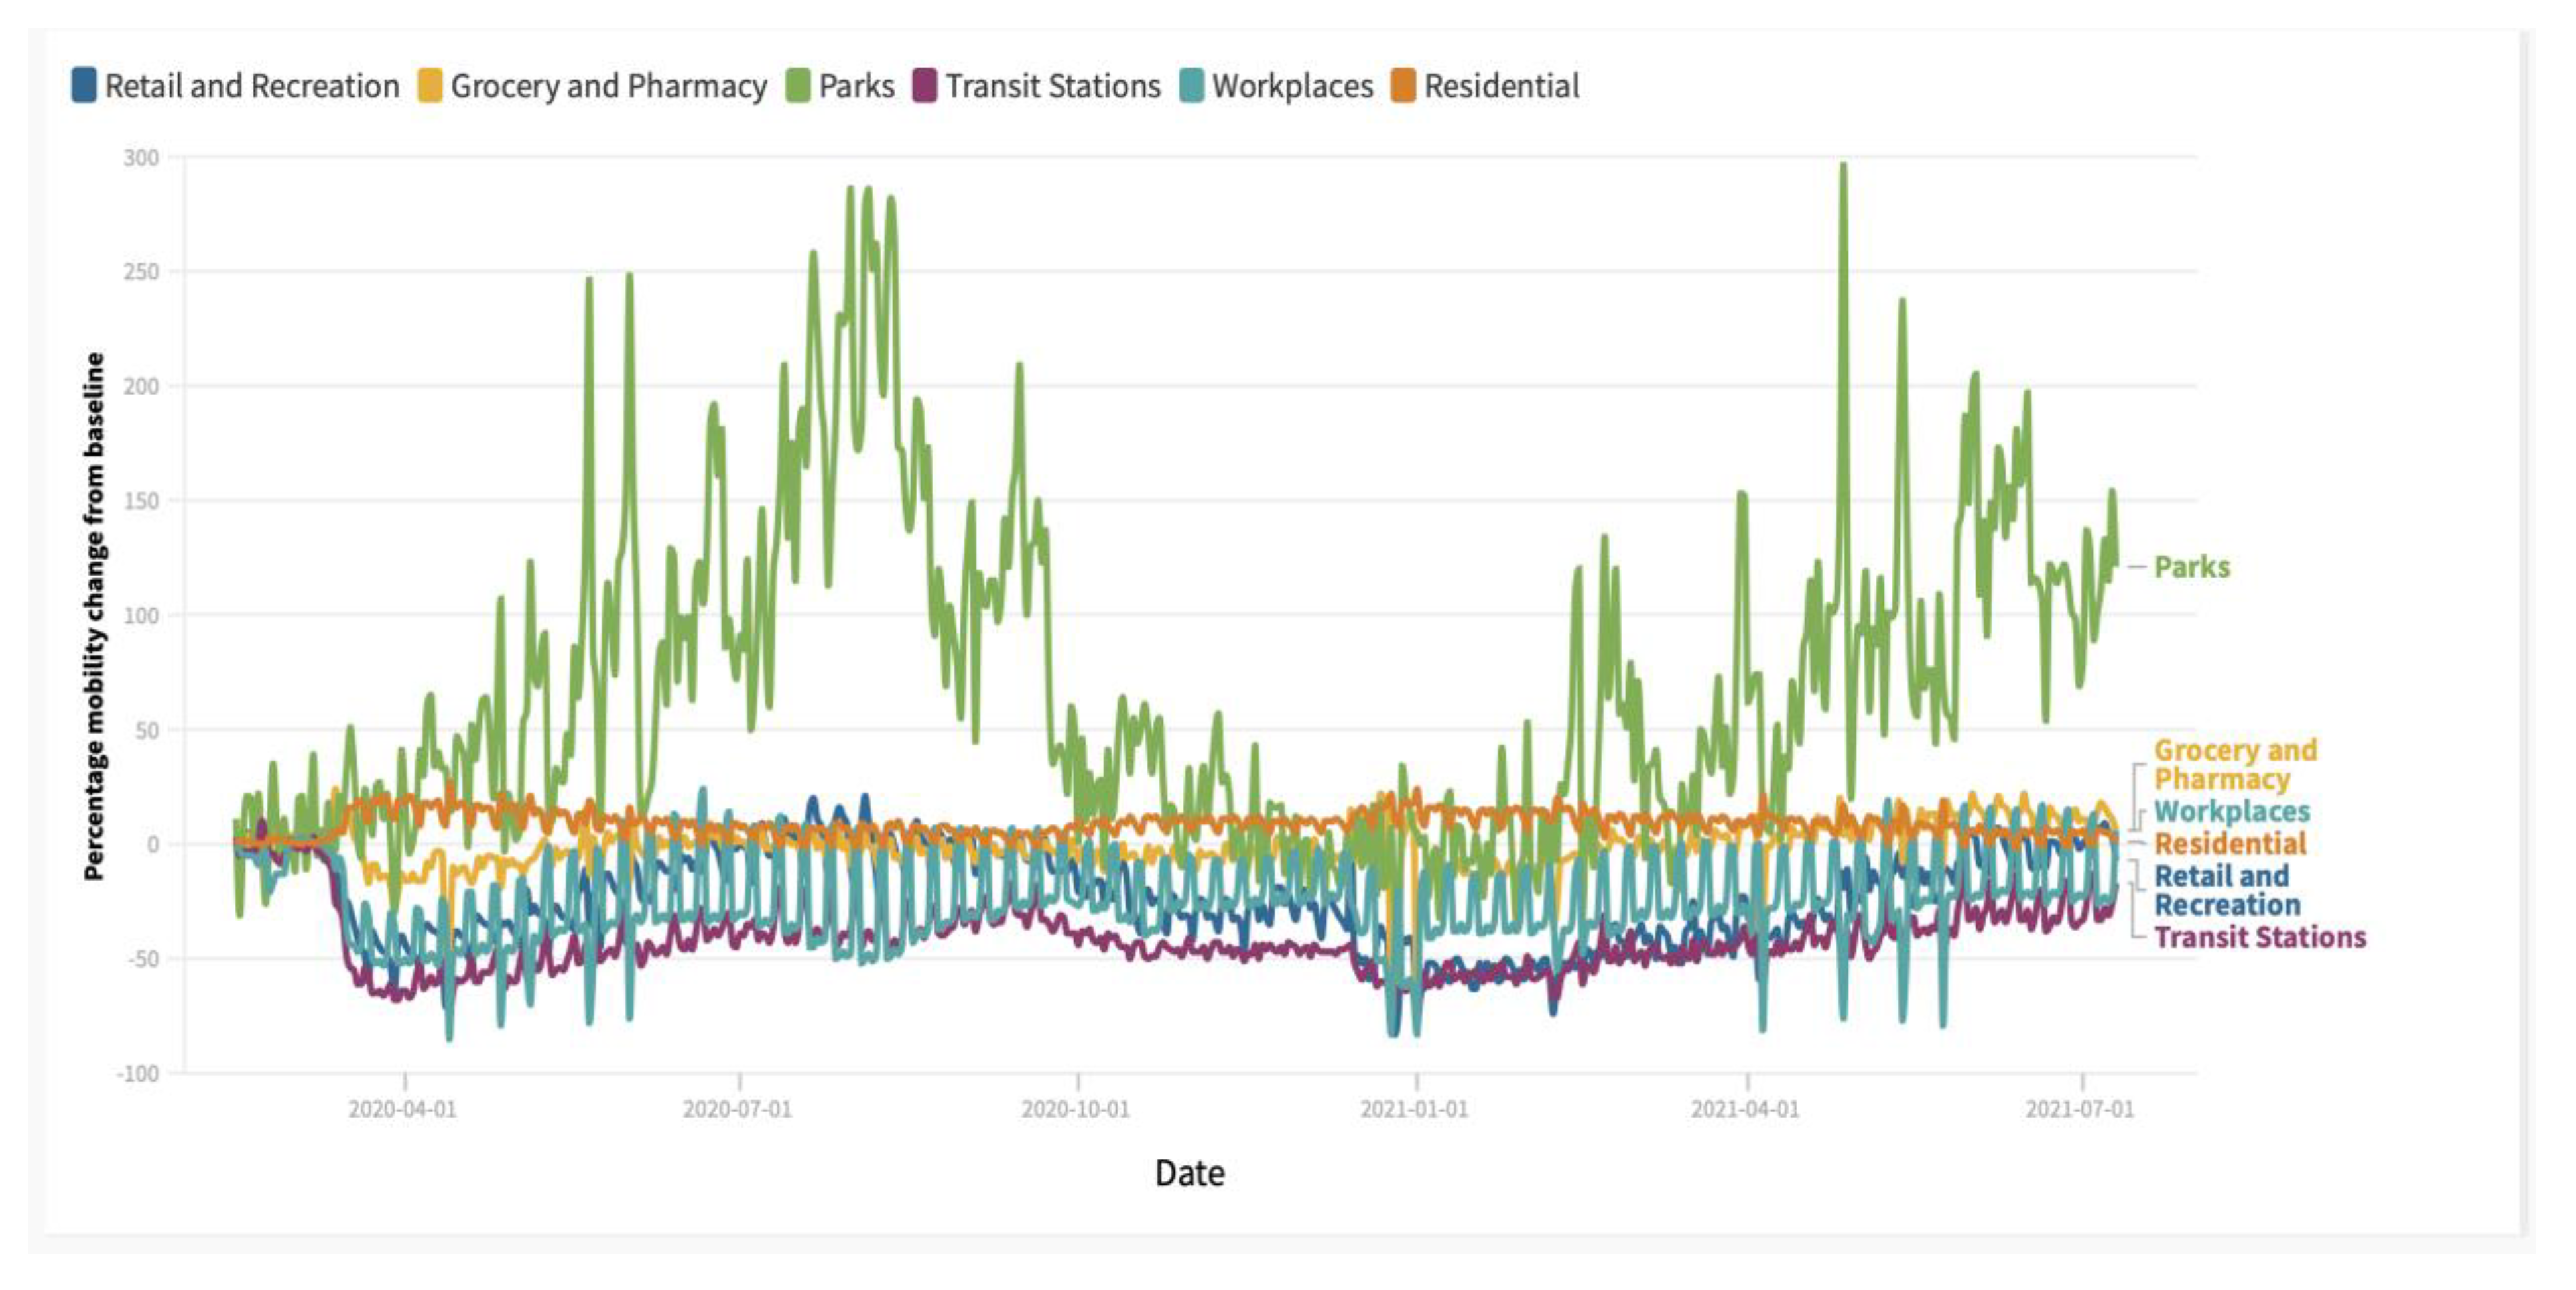
Figure 5. Illustration of evaluation of mobility patterns and motives during corona times in The Netherlands. Data source: Google COVID-19 Community Mobility Reports.
It is noteworthy from Figure 5 that visits to nature and parks are highly peaking in a period where lockdown measures were rather stringent (thus, a substitution effect). Most of the other mobility curves run more or less parallel, with sharp declines at the beginning of a new or more strict lockdown measure. Clearly, the mobility data have also a local or regional dimension.
Comparing now the three types of curves which form the contextual background for the corona dashboard information (and its trajectory over time) brings to light that individually these curves do not show a direct correlation with the corona curves. Apparently, the causal framework for understanding the complexity of the COVID-19 phenomenon is not yet fully developed. Therefore, here turn to another possibly important background factor, viz. the geographical pattern of the COVID-19 dispersion.
This entry is adapted from the peer-reviewed paper 10.3390/su14020836
References
- Nijkamp, P.; Rietveld, P.; Voogd, H. Multicriteria Evaluation in Physical Planning; Elsevier: Amsterdam, The Netherlands, 1990.
- Spronk, J. Interactive Multiple Goal Programming; Martinus Nijhoff: Boston, MA, USA, 1981.
- Thackara, J. In the Bubble: Designing in a Complex World; MIT Press: Cambridge, MA, USA, 2006.
- Theil, H. Optional Decision Rules for Government and Industry; North-Holland Publishing: Amsterdam, The Netherlands, 1964.
- Tinbergen, J. Economic Policy: Principles and Design; North-Holland Publishing: Amsterdam, The Netherlands, 1956.
This entry is offline, you can click here to edit this entry!