Your browser does not fully support modern features. Please upgrade for a smoother experience.
Please note this is an old version of this entry, which may differ significantly from the current revision.
Subjects:
Virology
Marek’s disease is an infectious disease in poultry that usually appears in neural and visceral tumors. This disease is caused by Gallid alphaherpesvirus 2 infection in lymphocytes, and its meq gene is commonly used in virulent studies for coding the key protein functional in oncogenic transformation of the lymphocytes. Although vaccines have been introduced in many countries to control its spread and are proven to be efficient, recent records show a decline of such efficiency due to viral evolution.
- Marek’s disease
- virus
- Asia
- pathology
- meq sequence
1. Overall MD Outbreaks in Asia between 2011 and 2021 and Associated Phylogeny Based on meq Gene
A total of 36 studies were recorded from 12 countries, namely, Bangladesh, China, India, Indonesia, Iran, Iraq, Japan, Malaysia, Pakistan, Saudi Arabia, South Korea, and Turkey (Figure 1). In detail, as shown in Table 1, a total of at least 289 farms were identified with MD outbreaks. Among 14 studies with pathological information, 4 studies reported a neural type while all studies reported some aspects of the visceral type. The lymphoma induced by MDV occured most frequently in the liver (11 studies), followed by spleen (9 studies), bursa of Fabricius (5 studies), kidney (4 studies), skin (4 studies), heart (4 studies), gizzard (4 studies), intestine (3 studies), and lung (2 studies), as shown in Table 2. In the four recorded neural types, lymphoma was detected in the sciatic nerves. MD incidence rates ranged from 0.1% to 40%, and MD mortality rates were distributed from 1% to 80% depending on the specific viral strains and vaccination status. Considering MDV strains and vaccination, 31 studies successfully isolated 132 different strains with meq sequential information, and 14 studies described the use of vaccines in farms including CVI988/Rispens (13 studies), HVT (4 studies), FC126 (3 studies), and two unknown vaccines. By either looking at the information from farms or following experimental research, we found that 12 strains from China were able to bypass the protection of the CVI988 vaccine, leading to a mortality of more than 30%. In seven cases, mortality reached more than 50% (Figure 2).
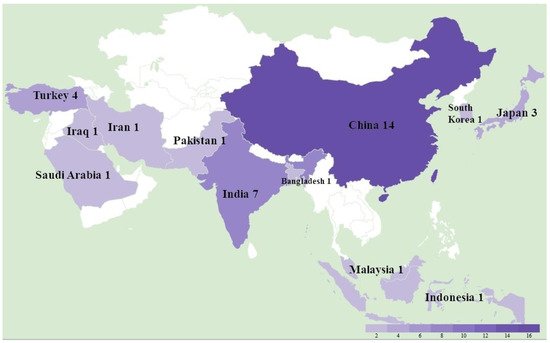
Figure 1. The study location and number of Marek’s disease outbreaks in Asia between 2011 and 2021.
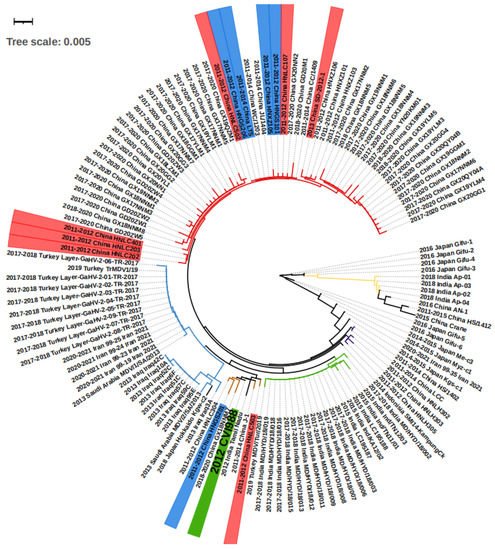
Figure 2. The phylogenetic tree of the isolated viruses according to meq sequences. On the strain names, green labels the vaccine strain CVI988, and blue and red label the strain that bypassed protection by the CVI988 vaccine, reaching a mortality of more than 30% and 50%, respectively. On the branches, red, brown, and purple label the China groups 1, 2, and 3, respectively. The blue, green, and yellow branches label the Middle East, India group 1, and India group 2, respectively. The meq consists of 1020 bp, and therefore 0.001 evolutionary distance can represent 1 different point mutation.
Table 1. Marek’s disease outbreak and its pathogenicity features in Asia between 2011 and 2021.
| Year of Study | Outbreak Year | Region | Number of Chicken Farms | MD Incidence Rate in Farm | Mortality Rate in Farm | Vaccine | Pathology Types | Number of Strains | Method | References |
|---|---|---|---|---|---|---|---|---|---|---|
| 2012 | * | India, | * | * | * | * | Visceral | 1 | PCR, pathology | [29] |
| 2013 | 2013 | China | 1 | * | 38.30% | FC126 | Visceral | 1 | PCR, pathology | [30] |
| 2013 | 2011–2012 | China | 18 | * | * | * | * | 17 | PCR | [31] |
| 2013 | * | India | 12 | * | * | unknown vaccine | Visceral | * | Pathology | [32] |
| 2013 | 2011 | Bangladesh | * | * | * | * | Visceral | * | Pathology | [33] |
| 2013 | 2013 | Iraq | * | * | 36.8% and 65% | * | * | 9 | PCR | [27] |
| 2015 | 2011 | China | * | * | * | * | * | * | PCR | [34] |
| 2015 | 2014 | China | 1 | 5% | 80% | CVI988/Rispens | Visceral | * | PCR, pathology | [35] |
| 2015 | 2012 | India | 5 | * | * | * | Visceral | * | PCR, pathology | [36] |
| 2016 | 2013 | China | 1 | * | 22.30% | CVI988/Rispens | * | * | PCR | [37] |
| 2016 | 2014 | Indonesia | 38.8%, 35%, and 20.8% | * | * | * | 1 | PCR | [38] | |
| 2016 | 2016 | Saudi Arabia | * | * | * | CVI988, HVT and FC126 | 2 | PCR | [39] | |
| 2017 | 2011–2014 | China | * | 20–40% | * | CVI988/Rispens | * | 6 | PCR | [21] |
| 2017 | 2015 | China | 1 | 36% | * | CVI988/Rispens | * | 1 | PCR | [40] |
| 2017 | 2014 | Japan | * | * | * | * | * | 3 | PCR, pathology | [28] |
| 2017 | * | Turkey | 11 | * | * | * | Neural, visceral | * | PCR, pathology | [41] |
| 2018 | 2015 | China | * | * | * | * | Visceral | 1 | PCR, pathology | [42] |
| 2018 | 2016 | China | 1 | 0.10% | * | CVI988/Rispens | 1 | PCR | [43] | |
| 2018 | * | India | * | * | * | * | * | * | PCR | [26] |
| 2018 | 2015 | India | 2 | * | 5.5% and 34% | unknown vaccine | Neural, visceral | 5 | PCR, pathology | [44] |
| 2018 | 2016 | Japan | 6 | * | * | CVI988 and HVT | Neural, visceral | 6 | PCR, pathology | [24] |
| 2019 | 2011–2015 | China | 165 | * | * | * | * | 1 | PCR | [45] |
| 2019 | 2017–2018 | Turkey | 49 | * | * | CVI988 and HVT | * | 9 | PCR | [25] |
| 2019 | 2018 | Malaysia | 4 | * | * | * | Visceral | * | PCR | [46] |
| 2020 | 2018–2019 | South Korea | * | * | * | * | * | * | PCR | [47] |
| 2021 | 2017–2020 | China | * | * | * | * | * | 37 | PCR | [48] |
| 2021 | 2018 | China | 3 | 20% | 10% | CVI988/Rispens | Visceral | 1 | PCR, pathology | [49] |
| 2021 | 2018–2020 | China | * | 5–20% | 2–10% | CVI988/Rispens | * | 5 | PCR | [50] |
| 2021 | 2017–2018 | India | 5 | * | * | * | * | 13 | PCR | [23] |
| 2021 | 2018 | India | 1 | * | * | * | * | 4 | PCR | [22] |
| 2021 | 2018 | Japan | 1 | * | * | * | * | 1 | PCR, pathology | [51] |
| 2021 | 2019 | Turkey | 1 | * | * | * | * | 1 | PCR | [52] |
| 2021 | 2019 | Turkey | 1 | * | 1–2% | CVI988, HVT and FC126 | Visceral | 1 | PCR, pathology | [53] |
| 2021 | 2019 | Pakistan | * | * | * | * | Neural, visceral | * | Pathology | [54] |
| 2021 | 2020–2021 | Iran | * | * | * | * | * | 5 | PCR | [55] |
Note: the ‘*’ represents no available data in the study.
Table 2. Organs in which tumors were found in visceral MD.
| References | Region | Species | Liver | Spleen | Bursa of Fabricius | Kidney | Skin | Heart | Gizzard | Intestine | Lung |
|---|---|---|---|---|---|---|---|---|---|---|---|
| [35] | China | layer | y | y | y | * | toe | * | * | * | * |
| [42] | China | Crane | y | * | * | * | leg | y | y | * | * |
| [30] | China | broiler | y | y | * | y | * | y | y | * | * |
| [49] | China | broiler | y | * | * | * | * | y | * | y | * |
| [29] | India | layer | y | * | y | * | * | * | * | * | * |
| [32] | India | layer | * | * | * | * | leg | * | * | * | y |
| [36] | India | layer | y | y | y | * | * | * | * | y | * |
| [44] | India | layer | y | y | * | y | * | * | * | * | y |
| [41] | Turkey | layer | y | y | * | y | * | * | y | * | * |
| [53] | Turkey | broiler | y | y | * | * | * | y | * | * | * |
| [24] | Japan | broiler | y | y | * | y | * | * | y | y | * |
| [33] | Bangladesh | broiler | * | * | y | * | y | * | * | * | * |
| [46] | Malaysia | broiler | y | y | y | * | * | * | * | * | * |
| [54] | Pakistan | broiler | * | y | * | * | * | * | * | * | * |
Note: * represents no available data in the study; “y” represents the tumor was identified in the organs.
We conducted a phylogenetic analysis on the basis of the meq sequence of the 132 viruses, together with the CVI1988 strain, which is shown in Figure 2. Altogether, the majority of the viruses isolated from Middle Eastern countries including Turkey, Iraq, Iran, and Saudi Arabia showed very short distances with no more than 10 different base pairs, suggesting they may originate in the same ancestor. The strains found in Turkey, Iran, and Saudi Arabia were almost identical, with fewer than three base pair differences (Figure 2, Table S1). As an exception, the strain “2019 Turkey MDV/Tur/2019” was very close (fewer than 3 bp differences) to the virus “India Group 1” (green branch in Figure 2), which may suggest virus transmission between the two countries. The viruses in China can be mainly divided in three groups on the basis of sequence (Figure 2). First, we find the “China Group 1” (red branch in Figure 2) that dominated the most recent outbreaks. Second, the “China Group 2” (brown branch in Figure 2) that displayed a short distance (less than 3 different point mutations) with the vaccine strain CVI988. Finally, the third group included “China Group 3” (purple branch in Figure 2), which is closely related to “2014–2015 Japan Kgs-C1” and “2014 Indonesia SMI14-KampungCk”. Additionally, there are some exceptions: “2015 China Crane”, a strain isolated from a wild crane, which showed more similarities with “2011–2015 China HS/1412”, “2016 China An-1”, and the “India Group 2” (yellow branch, Figure 2) when compared with China Groups 1, 2, and 3, indicating that there may have been two branches of MDV evolution in China. The strains in India can be divided into two groups, one for the “India Group 1” (green branch in Figure 2), and the second group “India Group 2” (yellow branch in Figure 2). The first group was found to be closer to the “2015 China Crane branch”, and the second was closer to the “2014 Indonesia SMI14-KampungCk”. In Japan, except for the strains mentioned above, there were also “2016 Japan Gifu1-6” and “2014–2015 Japan Me-C3” that were found to only be poorly related to other strains (more than 10 different point mutations). Overall, according to the groups and evolutionary distances, we were able to divide the regions into three internal connected parts, the Middle East (Turkey, Iraq, Iran, Saudi Arabia), South Asia (India, Indonesia), and East Asia (China Group 3 and 2014–2015 Japan kgs-c1). The strains within the countries in the part showed less than 10 different point mutations. However, there was an additional “China Group 1” and various highly mutated strains that have mainly been found in Japan (right part of Figure 2).
2. MD in Specific Asian Countries
2.1. China
In China, a total of at least 191 farms distributed in 17 provinces (8 in 14 China studies described the farm numbers) experienced a MD outbreak between 2011 and 2021 (Table 1). The deadliest cases came from the outbreak recorded in Shangdong (PRC) in 2013. It was described that the MD caused 38.3% mortality in a farm with 3000 chickens, even though they were vaccinated with FC126 at 1 day of age [30]. This study did not mention the overall MD incidence rate in the flock, but it is apparent that the rate would have been at least above 38.3%. The outbreak case reported in Jilin (PRC) in 2017 accounts for the most contagious case, with an MD incidence rate of 66.7%, despite protection with the vaccine CVI988 [40]. The best documented MD prevalence data, contributed by a continuous study between 2011 and 2015, described 165 MDV-positive farms in 12 provinces. In this study, the relatively low MD incidence and mortality rates of the HS/15 strain in unvaccinated conditions suggests that a group of infectious but not fatal MDVs are now spreading over China [45]. When considering pathological reports, tumor nodules are reported in all available four studies (Table 2). The most frequently found anatomic feature was the enlargement of the liver (four in four studies) associated with white nodules and infiltration of lymphocytes revealed by HE staining. This was associated with apparent diffused pleomorphic and neoplastic lymphocytes, leading to the destruction of the structure of the normal organs. In addition, similar tumor-associated changes were found in the heart (three in four studies), the spleen and gizzard (two in four studies), the kidney, the intestine, the muscles, and the bursa of Fabricius (one in four studies). It is interesting that in the case of the crane infection, the tumor invaded the trachea and may have caused respiratory issues.
Importantly, no study has described MD types with neural changes. One possible explanation is that all the detected samples came from dead chickens, which indicates that they would have suffered from the visceral type. In these studies, the behavioral changes usually shown in neural types were not continuously monitored. Thus, they may have missed the initial diagnosis time. However, we cannot exclude the possibility that now MDV strains have evolved to be more harmful and induce more visceral types than neural cases. When looking at MDV strains, a total of 71 strains with different meq sequences were isolated. Among them, most of the strains displayed similar meq mutations and strains isolated from the same province, and at similar times were closely related. According to the available data, the strain “SD-2012-1” should be the center of our attention, as it is close to recent 2017–2020 strains (Figure 2) and can induce MD with more than 50% of mortality under vaccine protection [30]. In addition, there are also six strains (HNLC202, 203, 401, 502, 503, 107) that have been reported to bypass the protection by the vaccine, leading to mortality levels of more than 50%, and five strains (LTS, HNGS101, 201, 206, HNXZ105) led to mortality levels ranging from 30% to 50% [31]. Compared with the CVI998 vaccine strain, the AN-1, HS/1412, and 2015 China Crane are highly mutated (Figure 2). More studies are needed for their epidemiological status and virulent studies. Overall, it is apparent that the most frequently used CVI988 and FC126 vaccines have started to be challenged over the last 10 years in China, especially in Henan and Shandong provinces. The renewal of vaccines could be an option for China, and the “SD-2012-1” strain may be helpful for the new vaccine development.
2.2. India
According to the data available from seven studies, there are at least 25 confirmed farms distributed in eight states that suffered from Marek’s disease in the last decade (Table 1). The 2018 study in Meghalaya, India, recorded two fatal outbreaks, one with 5.5% mortality and the other with 34% mortality, despite the protection of a vaccine not described in detail [44]. In an investigation of an area in Andhra Pradesh, India, where MD was suspected, a total of 27 chicken blood samples from live chickens and 84 tissue samples from dead chickens were analyzed, and all tested positive for MDV detection. However, the authors did not publish the exact incidence rate of MD [26]. When considering the pathological characteristics, we found the visceral type in almost every study that considered dead farm chickens. Liver lymphomas were found in three out of the four studies, followed by lung tumors in two studies. Other organs including kidney, spleen, heart, skin, and gizzard were also found with tumors each in one of the studies. It should be noted that sciatic nerve was also recorded with lymphoma in a study [44]. The detailed pathological changes included the enlargement of organs associated with abnormal structure and white nodules, as well as the identification by HE staining of lymphoblastic tumors. A study using field isolated viruses to infect experimental unvaccinated chickens showed an early paralysis of limbs, unilateral thickening of the sciatic nerve well before 12 weeks of age, followed by more serious visceral lesions and tumors [36]. Thus, it suggests that neural symptoms occur early in the outbreak, and monitoring the initial neural types in a farm might help in preventing a more serious outbreak. In these studies, a total of 23 strains with different meq sequences were isolated. The viruses within “India group 1” (green branch in Figure 2) showed no more than five point meq genetic mutations and were less closely related to “India group 2” (yellow branch in Figure 2) virus strains with more than 15 point mutations. The 2015 India “LC195187” and 2015 India “LC198188” are the two most deadly viruses according the data described. They induced a mortality of 34% MD in farms, although chickens were vaccinated with an unknown vaccine. The majority of strains (20 in 23) had no virulence data. The vaccine used in India was mainly HVT, which generated significant protection (decreasing the mortality rate from 40% to 10% and MD incidence rate from 100% to 57.5%) for 2015 India Ind/TN12/03 [36]. Therefore, it seems this vaccine is efficient. However, we still need more evidence for other groups, especially AP strain studies.
2.3. Japan
Four studies described the outbreak of Marek’s disease in seven farms, but none of them described prevalence or mortality data (Table 1). The chickens for the study performed in Gifu, Japan, in 2016 were vaccinated with CVI988, but this still did not prevent the outbreak [24]. Chickens infected with MD showed apparent visceral lesions with lymphomas in the liver, spleen, intestine, kidney, and gizzard. Neural changes were also found with oedema, loss of striation, and discoloration in their peripheral and sciatic nerves [24]. A total of 10 strains were isolated, and the analysis of meq mutations showed diversity according to their evolutionary distances. The 2016 Japan Gifu-1, -2, -3, and -4 were the most distantly related to the 2018 Japan Hokkaido kgw-c2. The remaining five strains are more similar to each other but also show a more distant relationship with the 2016 Japan Gifu1-4 and 2018 Japan Hokkaido kgw-c2 (Figure 2). Although the outbreak in farms is now frequently reported in Japan, the diversity may suggest that MDV has a long evolution history there.
2.4. Turkey
Turkey is among the countries that suffers from Marek’s disease outbreak. A total of 62 farms have been reported to have MD in four studies (Table 1). Two studies [25,41] isolated MDV in 206 from different chickens in 752 diseased spleen and blood samples. A study conducted in a farm with 10,000 chickens showed a mortality rate between 1% and 2%, despite the protection by vaccines CVI988, HVT, and FC-126 [53]. According to two studies [41,53] that investigated the pathological changes, the visceral lesions were described with liver and spleen swelling and lymphomas. In addition, the heart, kidney, and gizzard were also found in either one of the two studies, and one study recorded the neural type with sciatic nerve tumor [41]. Cases included 11 viral strains in the three studies, but most of them showed the same meq sequence, including the one with available mortality data, except for 2017–2018 Turkey Layer-GaHV-2-06-TR-2017 showing three point mutations (Figure 2, Table S1). Thus, the Marek’s disease situation may be protected well with the vaccines in Turkey, but the risk for potential transmission and evolution still exists.
2.5. Other Regions
In addition to the countries described above, there are also single reports for Bangladesh, Indonesia, Iraq, Iran, Malaysia, Pakistan, Saudi Arabia, and South Korea in the last decade. In the Iraqi study, researchers bought chickens from farms and markets and found an overall prevalence of 49.5% MDV, although they did not mention whether these chickens were selected on the basis of behavioral performance [27]. In Bangladesh, among the country-wide collection of dead chickens, 4710 chickens were analyzed, and 6.69% of them died with MD [33]. It is surprising that MDV was successfully isolated from 2 out of 16 Dermanyssus gallinae mites, suggesting that parasites may be able to transmit this virus [47]. Studies in Saudi Arabia showed that the vaccines CVI998, HVT, and FC-126 failed to prevent the transmission of MD in farms, although with a low mortality around 10% [39]. There are three studies recording the pathological types, and all of them documented a visceral type, except for the study in Bangladesh, which also showed neural changes. As shown in Table 2., two studies describe tumors in the bursa of Fabricius and spleen, while each of the three studies showed lymphomas in the liver, skin, and gizzard. Specifically, 110 birds had complete paralysis of wings and legs and diarrhea, and 52 had partial paralysis of wings in the farms found in Bangladesh [33]. For the viruses, nine strains in Iraq, five in Iran, two in Saudi Arabia, and one in Indonesia were isolated. The strains within the same studies are similar in meq mutations in Iraq and Iran, except for 2013 Iraq3A, which has more mutations when compared with others in Iraq (Figure 2).
This entry is adapted from the peer-reviewed paper 10.3390/ani12050540
This entry is offline, you can click here to edit this entry!