Your browser does not fully support modern features. Please upgrade for a smoother experience.
Please note this is an old version of this entry, which may differ significantly from the current revision.
Subjects:
Health Care Sciences & Services
The potential role of selenium in preventing chronic liver diseases remains controversial. This meta-analysis aimed to summarize the available evidence from observational studies and intervention trials that had evaluated the associations between body selenium status and chronic liver diseases. Both body selenium status and selenium intake were negatively associated with hepatitis, cirrhosis, and liver cancer. However, the associations for fatty liver diseases were conflicting and need to be established in prospective trials.
- Chronic Liver Diseases
- Selenium
- Meta-analysis
1. Introduction
Selenium has been recognized as an essential trace element in humans for decades, which exerts its biological functions in antioxidant defense, redox signaling, thyroid hormone metabolism, and immune response through various selenoproteins [1]. Currently, 25 selenoproteins have been identified in humans and most of them serve as oxidoreductases, with selenocysteine being the catalytic redox-active site. The intake of selenium varies greatly and ranges from deficient to toxic concentrations worldwide. With an insufficient intake of selenium in the body, the amount of selenoproteins decreases and can, therefore, affect the immune system by decreasing the development and functions of the thymus responsible for the production of macrophages and lymphocytes [1,2]. Extensive studies have indicated that selenium deficiency is an important contributing factor to the pathogenesis of numerous chronic diseases, such as cancer [3,4], cardiovascular diseases, diabetes, and liver diseases [5,6], as well as other disorders [3,7]. On the contrary, the excessive intake of selenium may cause oxidative damage, cytotoxicity, and increase DNA damage, often leading to nail fragility and hair loss [1,2].
Chronic liver diseases, including fatty liver diseases, hepatitis, fibrosis, cirrhosis, and cancer, are major global health burdens and account for approximately 2 million deaths per year worldwide [8]. The reason for liver damage is mainly related to extensive inflammation and oxidative stress, generated by excessive reactive oxygen species (ROS) production, which promotes liver diseases. Se deficiency induces a systematic redox imbalance and inflammation in the blood and causes pathological changes in the liver [9]. Due to the unique chemical reactivity of selenocysteines, several selenoproteins have been reported to mitigate and repair liver damage caused by ROS, including thioredoxin reductases (TXNRD), glutathione peroxidases 1 (GPX1), selenoproteins P (SELENOP), SELENOS, and SELENOK [10,11]. The normal range of selenium in serum of healthy individuals is 0.8–2 µmol/L (or 70–150 µg/L) [3,12]. Recently, substantial epidemiological studies have been performed to explore the link between selenium levels and chronic liver diseases risk. Plenty of studies have reported that, compared with healthy individuals, selenium levels in patients with chronic liver disease are lower when the selenium status is at the optimal level, especially in patients with advanced chronic liver disease such as hepatitis, cirrhosis, and liver cancer [13,14,15]. However, the results are not always consistent and its relationship with different severities of chronic liver diseases has been controversial. In the early stage of chronic liver diseases, some evidence linked lower blood selenium levels to fatty liver diseases compared to controls [5,16], while other studies found no or even a positive association of selenium levels and non-alcoholic fatty liver disease (NAFLD) [17]. In addition, some of the studies have investigated the association between selenium intake and the risk of chronic liver diseases but came out with inconsistent results. Furthermore, studies implied that maintaining an adequate amount of body selenium or selenium supplementation for deficiency could possibly benefit patients with chronic liver disease, compared with the controls in the same region [18,19,20].
2. Association between Selenium Level and Chronic Liver Diseases
First, we included all the individuals to calculate the average selenium status in patients and healthy controls using random-effects models. We found an adverse association between body selenium status and chronic liver diseases (SMD = −1.70, 95% CI: −2.30 to −1.11, n = 137), but the heterogeneity was high (I2 = 99.5%, p < 0.001). Due to discrepancies in the literature, we performed subgroup analysis based on the severity of chronic liver diseases. We found that fatty liver disease patients had an equivalent level of selenium to healthy controls (SMD = 1.06, 95% CI: −1.78 to 3.89, n = 11), whereas patients with hepatitis (SMD = −1.78, 95% CI: −2.22 to −1.34, n = 44), liver cirrhosis (SMD = −2.06, 95% CI: −2.48 to −1.63, n = 57), and liver cancer (SMD = −2.71, 95% CI: −3.31 to −2.11, n = 25) had a lower selenium level than healthy controls, regardless of the baseline of selenium level in the body. The funnel plot of hepatitis, liver cirrhosis, and liver cancer articles all appeared symmetric, and egger’s test detected no publication bias. Although the funnel plot of fatty liver diseases showed bias, no statistically significant publication bias was found by Egger’s test. There was no presence of publication bias for the studies.
Additionally, we performed a further subgroup analysis according to the types of diseases, sample sources, different regions, years of publication, and the reference blood selenium levels (optimal or suboptimal).
For fatty liver diseases, stratified analyses by types of diseases showed that, compared with the controls, alcoholic fatty liver disease patients (SMD = −1.29, 95% CI: −2.08 to −0.50, n = 3) had significantly lower selenium levels, while simple fatty liver disease patients had no difference (SMD = −0.51, 95% CI: −0.90 to −0.12, n = 4) and NAFLD patients had a higher level (SMD = 4.39, 95% CI: −0.55 to 9.34, n = 4), although not significantly. Stratified analyses by study regions showed that fatty liver patients had a significantly lower selenium level in Europe than controls, but no difference in the USA and a higher level in Asia. Stratified analyses by sample sources showed that fatty liver disease patients had a significantly lower hair selenium level than controls, but no difference in whole blood, serum, and plasma. Stratified analyses by study design showed that fatty liver disease patients had a significantly lower selenium level than controls in case-control studies, but no difference in cross-sectional studies. Stratified analyses by year of publication showed that fatty liver disease patients had a significantly lower selenium level than controls in studies carried out before 1990, but no difference in studies carried out after 1991. Subgroup analysis stratified by the mean baseline blood selenium level in the normal control group showed that, interestingly, when in an optimal selenium level (70–150 µg/L), fatty liver disease patients (3 in alcohol liver disease and 1 in NAFLD) had a significantly lower blood selenium level than controls (SMD = −0.92, 95% CI: −1.87 to 0.02, n = 4), but in a suboptimal selenium level (>150 µg/L), there was no significant difference between NAFLD patients and controls (SMD = 5.84, 95% CI: −3.29 to 14.97, n = 3).
For hepatitis, stratified analyses by types of diseases showed that, compared with controls, viral hepatitis patients (SMD = −1.88, 95% CI: −2.42 to −1.35, n = 34) and alcoholic hepatitis patients (SMD = −1.36, 95% CI: −1.94 to −0.77, n = 9) had a significantly lower selenium level. Stratified analyses by study regions showed that hepatitis patients had a significantly lower selenium level in Europe and Asia than controls, while no difference was found in Africa. Further subgroup analysis stratified by sample sources showed that hepatitis patients had a significantly lower selenium level than controls in each sample. Subgroup analysis stratified by study design showed that hepatitis patients had a significantly lower selenium level than controls in each type of study. Subgroup analysis stratified by year of publication showed that hepatitis patients had a significantly lower selenium level than controls in most studies, except for in studies carried out from 1991 to 2000. Subgroup analysis stratified by the mean baseline blood selenium level in the normal control group showed that whether in an optimal (70–150 µg/L (SMD = −1.22, 95% CI: −1.62 to −0.82, n = 24)) or suboptimal (<70 µg/L (SMD = −2.38, 95% CI: −3.57 to −1.19, n = 4) or >150 µg/L (SMD = −2.65, 95% CI: −4.04 to −1.26, n = 12)) selenium level, hepatitis patients had a significantly lower blood selenium level than controls.
For liver cirrhosis, stratified analyses by types of diseases showed that alcoholic cirrhosis patients (SMD = −2.45, 95% CI: −2.99 to −1.90, n = 21) and other cirrhosis patients (SMD = −2.41, 95% CI: −2.94 to −1.89, n = 27) had a significantly lower selenium level than controls, but no difference in primary liver cirrhosis (SMD = 0.90, 95% CI: −1.98 to 3.79, n = 9). Stratified analyses by study regions showed that liver cirrhosis patients had a significantly lower selenium level in Europe, the USA, and Asia than controls. Stratified analyses by sample sources showed that liver cirrhosis patients had a significantly lower selenium level than controls in most samples, except for the liver. Subgroup analysis stratified by study design showed that liver cirrhosis patients had a significantly lower selenium level than controls in each type of study. Stratified analyses by year of publication showed that liver cirrhosis patients had a significantly lower selenium level than controls in most studies, except for in studies carried out before 1990. Subgroup analysis stratified by the mean baseline blood selenium level in the normal control group showed that whether in an optimal (70–150 µg/L) or suboptimal (<70 µg/L or >150 µg/L) selenium level, liver cirrhosis patients had a significantly lower blood selenium level than controls.
For liver cancer, almost all studies of liver cancer have only included patients with hepatocellular carcinoma, so we did not perform subgroup analysis by the types of liver cancer. Stratified analyses by study regions showed that liver cancer patients had a significantly lower selenium level in Europe, the USA, and Asia than controls. Subgroup analysis stratified by sample sources showed that liver cancer patients had a significantly lower selenium level than controls in each sample. Subgroup analysis stratified by study design showed that liver cancer patients had a significantly lower selenium level than controls in each type of study. Subgroup analysis stratified by year of publication showed that liver cancer patients had a significantly lower selenium level than controls in each publication year. Subgroup analysis stratified by the mean baseline blood selenium level in the normal control group showed that whether in an optimal (70–150 µg/L) or suboptimal (<70 µg/L or >150 µg/L) selenium level, liver cancer patients had a significantly lower blood selenium level than controls.
3. Association between Body Selenium Status and Incidence of Advanced Chronic Liver Diseases
The multivariable-adjusted RRs for each study and comparison of the combined RR between the highest and lowest selenium levels are shown in Figure 1. A random-effects model was used to calculate the overall effect size. The incidence of advanced chronic liver diseases was significantly reduced in the individuals with high body selenium status compared to those with low baseline selenium status (RR = 0.59, 95% CI: 0.49 to 0.72, p = 0.415). No significant heterogeneity (I2 = 0.1%) was found. Begg’s test detected no publication bias (p = 0.452). Furthermore, we conducted a meta-regression analysis and revealed a statistically significant linear dose-response relationship between blood selenium level and chronic liver diseases incidence. However, no statistically significant dose-response relationship was found between blood selenium increment and the risk for chronic liver diseases incidence (RR = 1.01, 95% CI: 0.78 to 1.30, p = 0.663).
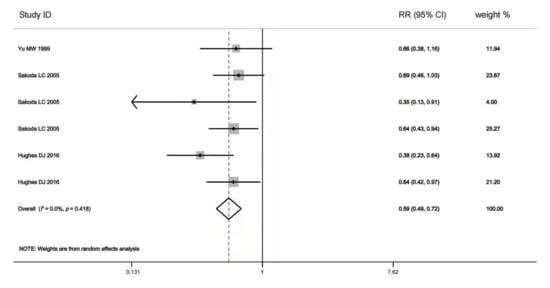
Figure 1. Forest plot of estimates comparing the elevated risk of advanced chronic liver diseases for the highest baseline selenium level compared to the lowest baseline selenium level [40,74,76]. The width of the black line represents 95% CI, which were obtained from a linear meta-regression without a constant using logarithmic RR for advanced chronic liver diseases as the dependent variable and the difference in selenium level to the study-specific reference group as the independent variable (either the highest baseline selenium level or the lowest baseline selenium level). The random-effects accounted for clustered variance in each study.
4. Association between Selenium Intake and Chronic Liver Diseases Risk
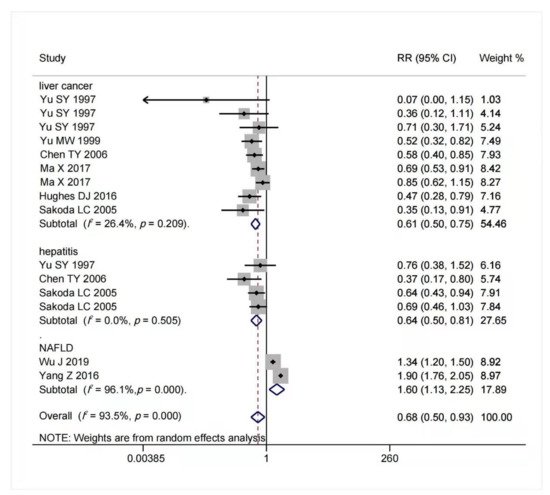
The result of multivariable-adjusted RRs for the association between selenium intake and risk of chronic liver diseases is shown in Figure 2. A tolerable upper intake level of selenium is 400 μg/day [40,77]. We found that within this safe dose range, as selenium intake or body status increased, the potential risk of advanced chronic liver diseases decreased. When selenium intake was high but below 400 μg/day, the risk of hepatitis (RR = 0.64, 95% CI: 0.50 to 0.81, n = 4; I2 = 0%, p = 0.505) and liver cancer (RR = 0.61, 95% CI: 0.50 to 0.75, n = 9; I2 = 26.4%, p = 0.209) reduced significantly without significant heterogeneity. On the contrary, increased selenium intake was associated with increased risk of NAFLD (RR = 1.60, 95% CI: 1.13 to 2.25, n = 2), but it had significant heterogeneity (I2 = 96.1%, p < 0.001). The funnel plot of included articles appears asymmetric.
This entry is adapted from the peer-reviewed paper 10.3390/nu14050952
This entry is offline, you can click here to edit this entry!