Your browser does not fully support modern features. Please upgrade for a smoother experience.
Please note this is an old version of this entry, which may differ significantly from the current revision.
Subjects:
Engineering, Biomedical
Breast cancer has the highest cancer incidence rate in women. Tumor markers are a kind of active substance that can indicate the existence and growth of the tumor. The detection of tumor markers can effectively assist the diagnosis and treatment of breast cancer. The conventional detection methods of tumor markers have some shortcomings, such as insufficient sensitivity, expensive equipment, and complicated operations. Compared with these methods, biosensors have the advantages of high sensitivity, simple operation, low equipment cost, and can quantitatively detect all kinds of tumor markers.
- tumor marker
- breast cancer
- biosensor
1. Introduction
Nowadays, cancer has become one of the main threats to human health and life [1]. Among all types of cancer, breast cancer has the highest incidence rate in women worldwide, and the incidence rate is still increasing [2]. Previous studies have suggested that early breast cancer detection with suitable treatment could reduce breast cancer death rates significantly in the long term. At present, the main diagnostic techniques available for the detection of breast cancer are mammography, breast ultrasound, and breast MRI examination [3,4]. However, these methods require the corresponding equipment, professional practitioners, and expert analysis, and the detection cost is high. As a result, these methods are difficult to generalize to the majority of people who need this screening, especially for those with early-stage breast cancer that has not yet been detected. Compared with the above methods, the detection of the tumor markers of breast cancer using a biosensor is a more efficient and less costly [5].
A biosensor is commonly defined as a self-contained small analytical device that combines biological recognition system and a physiochemical transducer for the detection of target molecules by converting the recognition signal into a detectable output signal [6,7,8,9,10]. It is able to meet the needs of this group of patients. On the one hand, breast tumor markers play an important role in the early diagnosis of breast cancer, the classification of molecular subtypes, the choice of treatment methods, and the prognosis evaluation [11,12,13]. On the other hand, biosensors offer significant advantages in terms of specificity, sensitivity, speed, and cost of detection compared to traditional tumor marker detection methods [14,15] such as chemiluminescence immunoassay [16], enzyme-linked immunosorbent assay [17], proteomics [16], molecular biology methods, liquid biopsy, etc.
2. Tumor Markers
Tumor markers are a class of active substances produced by the interaction between tumor tissue or host and tumor, which can indicate the existence and growth of the tumor. At any stage, the concentration of tumor markers is determined by several parameters of the tumor, such as the size, mass, expression degree, catabolic, excretion rates, tumor bloody supply, and drug resistance. As shown in Figure 1, tumor markers can be divided into nucleic acid, protein, tumor cell, and others such as the exosome.
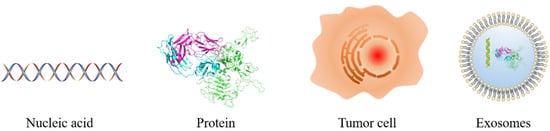
Figure 1. Schematic diagram of the different types of tumor markers.
The most commonly used breast tumor markers are estrogen receptor, progesterone receptor, and human epidermal growth factor receptor 2 [21]. In addition, the role and potential of emerging biomarkers in the diagnosis and treatment of breast cancer are also being studied and discovered.
2.1. Estrogen Receptor
Estrogen receptor (ER) is a protein molecule that specifically binds to estrogen in cells [22]. Estrogen receptors can be located in the cell membrane, cytoplasm, or nucleus. The classical nuclear receptor is located in the nucleus, and its protein is located in the cytoplasm temporarily after translation, so it can be detected in the cytoplasm [23]. Estrogen diffuses into the nucleus and binds to its nuclear receptor, which triggers gene regulation mechanism and regulates the transcription of downstream genes. The purpose of estrogen receptor detection is to determine whether patients are suitable for endocrine therapy, to assist in prognostication, and as a diagnostic aid in metastatic breast cancer [23,24]. Estrogen stimulates tumor growth in some breast cancer patients, and estrogen exerts its effect by binding to estrogen receptors. Therefore, the detection of patients with estrogen receptors is positive, and can determine whether the patient is suitable for endocrine therapy. Endocrine therapy for ER-positive patients can effectively inhibit tumor growth. The same treatment for ER-negative patients could not achieve the same effect [25]. There is unequivocal evidence that patients with cancers devoid of ER expression do not benefit from endocrine treatment [26].
2.2. Progesterone Receptor
Progesterone receptor (PR) is a hormone receptor such as ER. PR is activated by ER, and the activation of PR is the signal of ER activity [27]. The interaction between PR and chromatin will change the binding position of ER and chromatin and then lead to the change in cell gene regulation from proliferation to cell cycle arrest, apoptosis, and differentiation [23]. PR-positive patients account for about 65–70% of breast cancer patients, and PR-positive patients rarely appear ER-negative at the same time [27]. Therefore, for those patients that are strongly PR positive and ER negative, detection of ER again is needed to eliminate the possibility of a false negative [25,27]. The main purpose of PR detection is to judge the prognosis of ER-positive patients [23].
2.3. Human Epidermal Growth Factor Receptor 2
The human epidermal growth factor receptor 2 (HER2) gene is one of the most widely studied proto-oncogenes of breast cancer [28]. HER2 drives tumor growth by activating the MAPK and PI3K/AKT signaling pathways, which in turn enhances cell proliferation, invasion, and metastasis [23]. In the absence of systemic therapy, HER2 gene amplification or protein expression is associated with poor prognosis [29]. It was found that the HER2 level was negatively correlated with the ER and PR levels [23]. HER2-positive patients account for about 15–20% of breast cancer patients [28]. In clinical practice, targeted therapy for HER2 is adopted in HER2-positive patients and HER2 is used as a prognostic indicator [30,31]. Similar to ER, targeted therapy for HER2 has an obvious effect only on HER2-positive patients, but not on HER2-negative patients [23].
2.4. The Biomarker of Triple Negative Breast Cancer (TNBC)
Within the spectrum of breast cancer, TNBC is known as a type of breast cancer in which there is a lack of expression of ER, PR, and HER2 [32]. TNBC accounts for approximately 15–20% of breast cancer patients and is a more aggressive and heterogeneous subtype than other subtypes, with a poorer prognosis and less survival rates after treatment. Currently, cytotoxic chemotherapy is still the main way for the treatment of TNBC. Therefore, further classification of TNBC is needed for a more targeted and effective treatment plan [29,33]. Current research on TNBC-related biomarkers has identified a number of biomarkers that can be used to further classify patients with TNBC for molecular therapy [33,34]. In addition to this, there are also some biomarkers that indicate the prognosis and treatment status of the TNBC patients.
The signaling of angiogenesis, mediated by vascular endothelial growth factor (VEGF), is crucial in the process of growth and tumor spreading [32]. VEGF is highly expressed in around 30–60% of patients with TNBC [33], with significantly higher levels of VEGF and shorter survival times for patients with primary operable triple-negative breast cancer. Clinical trials have found that adding targeted anti-VEGF therapy to patients with TNBC improves treatment outcomes [34].
Androgen receptor (AR) is also a hormone receptor that specifically binds to androgen in cells, which modulates the transcription factors and controls gene expression [27,35]. AR can both stimulate proliferation and dedifferentiation and induce apoptosis and cell death, depending on the simultaneously activated signaling pathways [33]. The expression of AR is related to the biological behaviors of triple-negative breast cancer, and plays a role in endocrinotherapy and prognostic prediction [36].
2.5. Emerging Tumor Markers
In addition to the three common clinical breast cancer tumor markers mentioned above, there are many emerging tumor markers that are receiving increasing attention from researchers. These emerging tumor markers can be classified as nucleic acids, proteins, tumor cells, and others [37].
2.5.1. Nucleic Acids
Nucleic acid tumor markers include BRCA1, BRCA2, microRNA, circulating tumor DNA (ctDNA), circulating cell-free DNA (ccfDNA), circulating RNA (circRNA), long noncoding RNAs(lncRNA), etc. [38]. BRCA1 and BRCA2 are the tumor-suppressor genes in breast cancer [39]. Research shows that their mutations will increase the risk of breast cancer [39,40,41].
MicroRNA is a kind of noncoding single-stranded RNA molecule with a length of about 22 nucleotides encoded by endogenous genes, which plays an important role in controlling gene expression [42]. MicroRNAs have emerged as key regulators of breast cancer pathogenesis, progression, and treatment response [43]. Studies have found that microRNA is related to the clinical and pathological characteristics of patients, and can target different genes and affect different pathways. The plasma microRNA-21 in breast cancer patients is about four times that of normal people; also, a significant negative correlation between its basal expression, expression levels after treatment, and time to progression in HER2-positive patients was found with the progression time [44].
Circulating cell-free DNA is extracellular DNA in plasma or serum and ctDNA is ccfDNA released from tumor cells into blood [45,46]. There is a significant correlation between the amount of ccfDNA and the clinical manifestations and prognosis of metastatic breast cancer patients [45]. It can serve as a tumor marker to assist the treatment of breast cancer. Primary tumor cells, circulating tumor cells, and occult and dominant metastatic tumor cells release DNA at a higher rate than normal cells, and ctDNA displays mutations characteristic of the progenitor tumor [37]. Therefore, ctDNA has the potential as a tumor marker for the prediction, diagnosis, and prognosis of breast cancer [37,46]. However, the amount of ctDNA is very low; the total amount of ctDNA may represent as low as 0.01% of the total cfDNA. It needs a more sensitive and specific detection method [37].
Different from common RNA, circRNA is a kind of double-stranded closed RNA, which is not affected by RNA exonuclease, stable expression, and is difficult to decompose. The results showed that circRNA expression was related to the proliferation, migration, invasion, and drug resistance of tumor cells; the level of hsa_circ_103110, hsa_circ_104689, hsa_circ_0058514, hsa_circ_0001982, hsa_circ_104821, hsa_circ_0001785, circKIF4A, and cirs-7 rose in the tissue of breast cancer patients, and the level of hsa_circ_406697, hsa_circ_100219, hsa_circ_006054, circTADA2As, circ_Foxo3, and circRNA _000911 declined [47,48]. LncRNA is a kind of noncoding RNA with a length over 200nt, and it is a transcription product of RNA polymerase II. LncRNA not only can be used as a marker for prediction, prognosis, and progression but also can stimulate tumor growth and increase drug resistance [49,50]. However, further research is needed to apply it to clinical diagnosis and treatment [49].
2.5.2. Proteins
There are a lot of emerging protein tumor markers, such as CD24, CD44, MUC1, etc. CD24 is a glycosylphosphatidylinositol-binding glycoprotein with a large number of n- and o-type glycochains [11,51]. At present, a large number of CD24 expressions have been found in a variety of cancers [52]. It was found that CD24 is an anti-phagocytic signal, which protects cancer cells from macrophage attacks expressing Siglec-10. The blocking treatment of CD24 can effectively improve the therapeutic effect of CD24-positive tumors [51]. The expression of CD24 is also associated with the grading and staging of breast cancer [52]. CD44 is a complex transmembrane-binding glycoprotein [53,54], which can be involved in the regulation of many important signaling pathways such as tumor proliferation, invasion, metastasis, and treatment resistance, and was related to the adverse prognosis of patients [52,53].
MUC1 (CA15-3) is a transmembrane mucin glycoprotein, which is expressed in most epithelial tissues [55]. In 90% of breast cancer cases, abnormal expression and abnormal glycosylation were found in MUC1 [56]. At the same time, MUC1 is also an important marker for monitoring metastatic breast cancer [57]. In addition, the commonly used serum tumor markers, such as CEA, CA19-9, CA125, CA15-3, and TPS, play an important role in breast cancer diagnosis and treatment. In metastatic breast cancer, CEA and CA15-3 can be used to differentiate bone metastases and other metastases. CA15-3 and TPS were significantly increased in patients with liver metastasis. When the TPS level was normal and other tumor markers were increased, patients may be suspected of lung metastasis [58].
2.5.3. Tumor Cells
In addition to nucleic acids and proteins, which are biomolecules, tumor cells themselves are also tumor markers. When breast cancer cells fall off from the tumor and enter into the blood system, it would be called the circulating tumor cells (CTC). CTC has the ability to form new tumor tissues. By detecting the level of CTC cells, metastatic breast cancer patients could be staged and graded to carry out targeted treatment [59]. CTC cells can also be used to evaluate the prognosis of breast cancer patients, and to determine whether patients are suitable for postoperative additional radiation therapy [37,60].
2.5.4. Others
In addition to nucleic acids, proteins, and cellular tumor markers, other tumor markers, such as exosomes, are also present. Exosomes are 40–180 nm extracellular vesicles containing RNA and protein [61]. These proteins and RNA are involved in the pathogenesis of breast cancer [62]. Studies have found that tumor cells release more exosomes than normal cells, and miRNA-21 and miRNA-1246 in exosomes are upregulated in patients’ plasma [4]. Therefore, exosomes have potential and value as a tumor marker for breast cancer.
ER, PR, and HER2 are the most widely used tumor markers in the diagnosis and treatment of breast cancer. The three markers are used to classify the luminal subtypes of breast cancer in breast cancer patients, to determine the treatment of patients, and is also an important indicator for prognosis monitoring [13,27]. There are many new kinds of tumor markers. They have rich functions in the diagnosis and treatment of breast cancer. These functions include the early diagnosis of breast cancer, the choice of treatment methods, the targets of targeted therapy to cancer progression, prognosis evaluation, and drug resistance. However, whether they can be used in clinical diagnosis and treatment still needs to be further studied. At present, the current and emerging markers of breast cancer are not able to predict breast cancer effectively before the onset of clinical symptoms [39]. High specificity and high sensitivity tumor markers still need further study on breast cancer.
3. Biosensor
Biosensors can be divided into electrochemical biosensors, optical biosensors, and other types according to the detection principle and detection signal [6,7,8,9,10]. In recent years, researchers have developed many biosensors for detecting breast tumor markers. The research progress in electrochemical biosensors, optical biosensors, and other types for breast tumor markers is reviewed in this paper.
3.1. Electrochemical Biosensor
An electrochemical biosensor realizes the quantitative detection of the target by detecting the electrochemical reaction on the surface of the electrode. The signal of the electrochemical reaction is related to the target concentration [63,64,65]. The main methods of electrochemical detection are cyclic voltammetry (CV), differential pulse voltammetry (DPV), square wave voltammetry (SWV), linear sweep voltammetry (LSV), electrochemical impedance spectroscopy (EIS), field-effect biosensor (FET), and other methods [6,7,18].
3.1.1. Cyclic Voltammetry
The principle of cyclic voltammetry is to apply a triangle wave voltage in the form of fast linear scanning; complete a cycle of the reduction process and oxidation process with one triangle wave scanning; and then analyze according to the current–potential curve [66].
For example, Hong et al. [67] modified ferrocenecarboxylic (Fc-COOH)-doped silica nanoparticles (SNPs) on the surface of the Au electrode to connect with glutaraldehyde that could bind with the CA15-3 antibody. The CV method monitored changes in the current signal of the biosensor. The detection linear range was 2.0–240 U mL−1, and the detection limit was 0.64 U mL−1.
In addition, Vasudev et al. [68] developed a label-free electrochemical biosensor for the detection of epidermal growth factor receptor (EGFR). The self-assemble monolayer (SAM) of dithiobissuccinimidyl propionate (DTSP) was modified on the surface of the gold electrode. By binding the NH2 group of the DTSP-SAM with the carboxylic group of the EGFR antibody, the antibody was immobilized on the electrode to achieve specific capture of the EGFR and the charge transfer onto the modified electrode was enhanced. The changes in the electrical signal during detection of EGFR were monitored by the CV method. The linear range was 1 pg mL−1–100 ng mL−1. The detection limit of the biosensor was 1 pg mL−1.
The typical idea of an electrochemical biosensor for detecting DNA is to capture the target by DNA probe, amplify the signal with the material that can bind with double-stranded DNA. As shown in Figure 2, Hakimian et al. [69] modified the thiolated DNA probe to the gold electrode surface by a gold sulfur bond. Then, the detection target miRNA-155 would specifically bind with the probe to form the double-stranded body. Polyvinylimine silver nanoparticles (Ag-PEI NP) were added to specifically bind with the double-stranded body to amplify the peak current of the biosensor. The detection range of the biosensor was 2 × 10⁻²⁰–2 × 10⁻¹² M, and the detection limit was 2 × 10⁻²⁰ M.
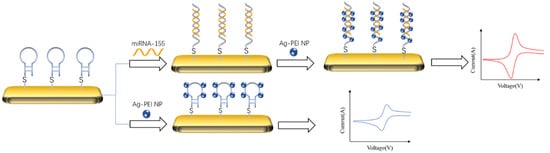
Figure 2. Schematic diagram of detecting miRNA-155 by cyclic voltammetry and signal amplification with Ag-PEI-NP [69]. The nanoparticles could bind to the target captured by the probe to amplify its CV signal.
3.1.2. Differential Pulse Voltammetry
Differential pulse voltammetry (DPV) is a voltametric technique that combines the potential step technique with the linear potential sweep technique to detect trace target compounds with high sensitivity. The peak height of the DPV curve is related to the concentration of the analyte [7,70].
At present, various DPV biosensors have been reported to detect different breast tumor markers. As shown in Figure 3, Wang et al. [70] reported a low fouling DPV biosensor for the detection of BRCA1. They modified the DNA probe onto the electrode surface by polypeptide doped poly(3,4-ethylenedioxythiophene) (PEDOT) to capture the BRCA1. Before the introduction of BRCA1, methylene blue was added to connect with the DNA probe to enlarge the DPV signal. When BRCA1 was captured by the DNA probe, methylene blue (MB) would be released from the DNA probe, there would be a large change in the DPV signal. The degree of change in the DPV signal was directly correlated with the concentration of BRCA1. The linear range of the biosensor was 0.01 pM–1 nM. The detection limit was 0.0034 pM.
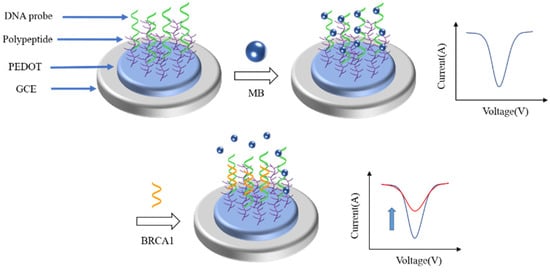
Figure 3. Schematic illustration of the fabrication process of the antifouling BRCA1 biosensor based on PEDOT/PEP and signal amplification with MB [70]. When the target binds to the probe, the MB would fall off the probe, resulting in a significant change in the DPV signal of the biosensor.
Han et al. [71] similarly constructed an electrochemical biosensor for the detection of CA15-3 using PEDOT and peptides. PEDOT doped with peptides was modified on the electrode surface to give the biosensor high sensitivity and long-term stability. The biosensor was able to detect CA15-3 in serum without suffering from biofouling. The linear range was 0.01–1000 U mL−1. The detection limit was 3.34 mU mL−1.
Similarly, another DPV biosensor was reported to detect BRCA1. Xia et al. [72] modified 3D reduced graphene oxide and polyaniline nanocomposites (3D-rGO-PANI) on the surface of a glassy carbon electrode as a sensing layer to improve the conductivity and electrochemical activity of the biosensor. After the target DNA BRCA1 was captured by the DNA probe that was modified on the surface of the 3D-rGO-PANI, the methylene blue would be used to further amplify the DPV signal of the biosensor. The linear range of detection was 1.0 × 10⁻¹⁵–1.0 × 10⁻⁷ M and the detection limit was 3.01 × 10⁻¹⁶ M.
For detecting different targets simultaneously, Chang et al. [73] synthesized two different metal–organic frameworks (MOFs) to detect two different RNA. MOFs were packed with different electrochemical dyes with different peak currents. The surface of the MOFs was modified with two different RNA (let-7a and miRNA-21) probes. Specific targets would stimulate specific MOFs to release organic molecules to produce specific peak currents. The linear ranges of detection were 0.01–10 pM (let-7a) and 0.02–10 pM (miRNA-21), respectively. The detection limit was 3.6 fM (let-7a) and 8.2 fM (miRNA-21), respectively.
3.1.3. Square Wave Voltammetry
The waveform of square wave voltammetry can be regarded as a special case of DPV, which is an asymmetrical ladder type. The duration of the pre-electrolysis and pulse cycle is equal. At the end of each pulse, the current is sampled twice in each cycle [74].
Various sensitive biosensor-based on SWV techniques were reported for detecting breast tumor markers. Different from the common detection strategy, Wang et al. [75] used competitive recognition to let the target trigger competitive recognition, which made the previously bound molecules fall off, resulting in a change in the current detected by the biosensor. The DNA probe that was modified with ferrocene at one end was modified on the surface of MXene (Ti3C2) to connect with the MUC1 aptamer that was modified on the surface of the glassy carbon electrode. After the addition of MUC1, competitive recognition was triggered to change the conformation of the aptamer. The complementary DNA probe was separated from the aptamer, resulting in the combination of MUC1 and the aptamer. The current change in this process was detected by SWV. The linear range of the biosensor was 1.0 pM–10 μM, and the detection limit was 0.33 pM.
To detect multiple microRNAs at the same time, Xu et al. [76] designed a circular DNA probe that can simultaneously detect miRNA-21 and miRNA-155. The probe was fixed on the top of the DNA tetrahedron that was modified on the surface of the electrode to simultaneously recognize miRNA-21 and miRNA-155 through multiple target recognition domains under the assistance of Helper strands, which could trigger mimetic proximity ligation assay (mPLA) for capturing the beacons ferrocene (Fc)-A1 and methylene blue (MB)-A2 to achieve multiple miRNAs detection. The linear range of the biosensor detection was 0.1 fM–10 nM. The detection limits were 18.9 aM (miRNA-21) and 39.6 aM (miRNA-155), respectively.
3.1.4. Linear Sweep Voltammetry
Linear sweep voltammetry is to apply a linearly varying voltage on the electrode and record the current at different electrode potentials. When the electrode potential reaches the potential of the redox reaction, a current peak will be generated. At other potentials, the current changes slowly. This peak is used to quantify the reactant concentration.
For example, Marques et al. [77] developed a biosensor for the detection of the HER2 extracellular domain (ECD) in human serum based on the gold nanoparticle-modified screen-printed carbon electrode. HER2-ECD antibodies were modified on the electrode surface to capture the target. After the target had been captured, the antibody modified with biotin was added to bind with the target to form a sandwich structure. Then, a streptavidin–alkaline phosphatase conjugate was used to connect with the biotin to label the detection antibody. Finally, the enzyme substrate and silver ions were added to enhance the signal. The detection of the target was achieved by linear scanning voltammetry, which detects the electrical signal of the reduction of silver ions to metallic silver during the enzymatic reaction. The linear range was 15 to 100 ng mL−1. The detection limit was 4.4 ng mL−1.
Due to the direct signal being weak, Freitas et al. [78] designed an LSV biosensor to detect the indirect signal. The screen-printed electrode was modified with multi-walled carbon nanotubes (MWCN), AuNPs, and HER2 antibodies, step by step. The alkaline phosphatase was introduced into the electrode surface by a secondary antibody and biotin-streptavidin. The 3-indoloxyphosphate and Ag+ were added as substrates for the enzymatic reaction. The electrochemical signals of silver produced by enzymatic reaction were recorded by LSV as the signal of the biosensor. The signal was directly related to the concentration of HER2. The total assay time was 2 h and 20 min. The linear calibration plots were obtained between 7.5 and 50 ng mL−1. The detection limit was 0.16 ng mL−1.
In order to improve the detection performance of a sensor, a variety of methods are sometimes used to amplify the signal. Zhao et al. [79] proposed self-assembled supramolecular nanocomposites assisted by a multiple signal amplification strategy to recognize the breast cancer stem cell by the CD44 protein on the cell surface. Firstly, thiol-functionalized peptides were immobilized onto the Au electrode surface to selectively capture the CD44 protein on the cell surface. Lysis of cells occurred after they had been captured, leaving only the captured peptide. Then, trypsin was introduced for the decomposition of peptides that did not capture CD44 and the captured CD44. Then the cucurbit [8] urils were added to bind with the peptides and subsequent addition of AuNPs. Finally, silver deposition was carried out to achieve the final signal amplification. It could also be used to detect the CD44 protein. The detection limit toward CD44 protein was 2.17 pg mL−1. The linear range toward CD44 protein was 0.01 ng mL−1–100 ng mL−1. The linear range toward CD44-positive cells was 10 cells mL−1–106 cells mL−1. The detection limit toward CD44-positive cells was 8 cells mL−1.
3.1.5. Electrochemical Impedance Spectroscopy
The principle of electrochemical impedance spectroscopy is to apply a small amplitude alternating current potential wave with different frequencies to the electrochemical system and measure the ratio of alternating current potential to the current signal, which is the system impedance.
For the EIS biosensor, the detection was based on the impedance change of the electrode. So, the main idea to improve the detection limit was increasing the conductivity or impedance. For instance, Gu et al. [80] fabricated ZrHf-MOFs to amplify the impedance change. The ZrHf-MOFs were coupled with carbon dots to improve the electrochemical activity. The surface of the electrodes was modified with ZrHf-MOFs and aptamers, step by step. Aptamers were modified on the carbon dots to specifically capture the HER2 and HER2-overexpressed living cancer cells MCF-7. The linear range of HER2 detection was 0.001–10 ng mL−1. The detection limit was 19 fg mL−1. The linear range of MCF-7 cell detection was 1 × 10²–1 × 10⁵ cells mL−1 and the detection limit was 23 cells mL−1.
To amplify the signal, Paimard et al. [81] modified the electrode surface with nanofibers, MWCN, and AuNPs. Nanofibers are inherently large surface area and could increase conductivity and high porosity. MWCN improved the electron transfer rate and catalytic rate in the electrochemical reaction. AuNPs were used to modify the aptamer to capture MUC1 and perform signal amplification. The linear range of the biosensor was 5–115 nM. The detection limit was 2.7 nM.
Shahrokhian et al. [82] combined redox graphene and a conductive polymer to make a DNA biosensor for the detection of BRCA1. The surface of the redox graphene covered with a conductive polymer had more reactive sites for immobilization of the DNA probe, increasing the detection limit of the sensor. The linear range was 10 fM–0.1 µM, and the detection limit was 3 fM.
3.1.6. Field-Effect Sensor
The principle of the FET biosensor is that the gate of the FET is replaced by an ion-selective membrane, reference electrode, and electrolyte. When a fixed voltage is applied to the reference electrode, different ion concentrations and different selective films in the electrolyte result in different interface potentials at the gate insulating layer (equivalent to applying a gate voltage to the gate), which further leads to the changes in carrier distribution in the channel and source leakage current, and the change of current is proportional to the amount of target [83,84].
For FET biosensors, choosing different materials as conductive channels will directly affect the construction of biosensors and the design of detection strategies. At present, many nanomaterials have been selected as conductive channels for FET due to their excellent conductivity and biocompatibility. As shown in Figure 4, Majd et al. [85] used molybdenum disulfide (MoS2) as the conductive channel of FET. The DNA probe of miRNA-155 was fixed on the surface of MoS2 by physical adsorption. After the probe and DNA combine to form double-stranded DNA, it would fall off from molybdenum disulfide, resulting in a change in the biosensor signal. The detection limit of miRNA-155 was 0.03 fM, and the linear range of detection was 0.1 fM–10 nM. Bao et al. [86] used silicon nanowires as the conductive channel of FET. APTES with glutamic acid (Glu) is used as the connector to connect silicon nanowires and CEA antibodies. The current of FET decreased when the CEA antibody captured the CEA. The decrease part was used to calculate the concentration of CEA. The linear range of detection was 0.1–100 ng mL−1, and the detection limit was 10 pg mL−1.
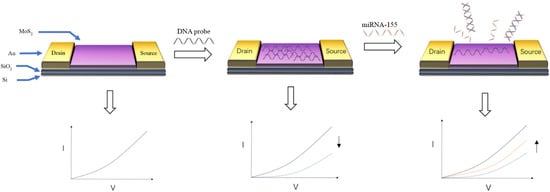
Figure 4. Schematic diagram of detecting miRNA-155 by MoS2 FET [85]. Hybridization of the target DNA and the DNA probe causes the DNA probe to be detached from the MoS2, causing a change in the target signal.
The specific detection of the target can be realized through the modification of specific receptors onto the sensing layer. By this method, the influence of other substances in the sample can be reduced and the sample can be detected directly without pretreatment, but the lower detection limit of the sensor will be somewhat increased. Secondary antibodies and nanomaterials can be used to amplify the change in the electrical signal of the biosensor. When the direct signal is weak, target detection can also be achieved by detecting the indirect signal.
3.2. Optical Biosensor
The optical biosensor realizes quantitative detection of targets by detecting the optical change on the surface of the sensing layer. Different optical biosensors detect the different optical signals, such as refractive index, resonance, wavelength, intensity, etc. [15,87,88]. In recent years, a number of optical biosensors have been reported for the detection of breast cancer tumor markers, which are classified into fluorescent biosensors, colorimetric biosensors, surface plasmon resonance biosensors, surface Raman scattering sensors, and electrochemiluminescent biosensors, based on the detection method [14,15,87,88].
3.2.1. Fluorescence Biosensor
The principle of the fluorescent biosensor is based on the fluorescence characteristics of molecules, such as the inherent fluorescence characteristics of many proteins and other biological molecules (nucleic acids, NADH, flavin nucleotides, green fluorescent protein). Once the ligands are combined with these proteins, the fluorescence behavior of the molecules will change, thereby realizing the detection of the target.
In contrast, most analytes are nonfluorescent. Therefore, it is necessary to use different fluorescent labels or probes to perform fluorescence spectroscopy detection [9]. The key to using fluorescence to detect the target lies in the change in fluorescence behavior before and after capturing the target, such as fluorescence excitation, quenching, or fluorescence intensity change.
As shown in Figure 5, Wang et al. [89] designed an ultra-sensitive homogeneous aptamer biosensor for CEA detection based on the fluorescence resonance energy transfer (FRET) between the upconversion nanoparticles (UCNPs) and graphene oxide (GO). UCNPs modified with a CEA aptamer were immobilized on the GO surface by π–π stacking. Due to the FRET between UCNPs and GO, the 546 nm fluorescence of UCNPs that was excited by the 980 nm laser was quenched. The binding of CEA to the aptamer blocked the π–π stacking. The UCNPs separated from GO. The 546 nm fluorescence recovered. The degree of fluorescence recovery was related to the concentration of CEA. The linear range of the biosensor was 0.03–6 ng mL−1. The detection limit was 7.9 pg mL−1. The linear range of detection in human serum samples was 0.03–6 ng mL−1, and the detection limit was 10.7 pg mL−1.
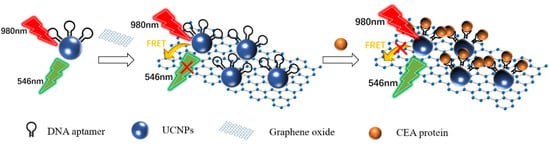
Figure 5. Schematic diagram of detecting the CEA protein using fluorescence biosensor-based UCNPs and FRET [89]. The presence of the target blocked the FRET between the UCNPs and the GO, resulting in the recovery of fluorescence at 546 nm.
Not only the fluorescence excitation and quenching, but the intensities of fluorescence could also be used to detect the target. For instance, Mohammadi et al. [90] fabricated carbon dots–chitosan nanocomposite hydrogels which functionalized with the ssDNA probe to detect microRNA-21 in MCF-7 cancer cells. After miRNA-21 were captured, the intensity of the excited fluorescence would decrease. There was a proportional relationship between the change degree in fluorescence intensity and the logarithm of the target concentration. The detection linear range of the biosensor was 0.1–125 fM, with a detection limit of 0.03 fM.
3.2.2. Colorimetric Biosensor
The colorimetric biosensor is based on the characteristic that there is a functional relationship between the color and concentration of the colored substance solution. After the target with different concentrations is captured, it will produce different degrees of color changes. Then the detection of the target concentration is realized.
However, as a result of the small concentration of the target, the direct signal of the colorimetric biosensor is not obvious enough. There were many ways that had been reported, such as detecting the indirect signal and amplifying the direct signal. Bai et al. [91] developed a colorimetric biosensor that detected the indirect signal. The biosensor was divided into two parts: a signal unit and capture unit. The signal unit was responsible for providing detection signals and the capture unit was used to capture the target DNA BRCA1. The capture probe was modified on the surface of the gold-plated silicon wafer to form the capture unit. The signal unit was a two-dimensional nanomaterial Bi2Se3 nanosheet with AuNPs modified on the surface. The surface of the AuNPs was modified with a signal probe to combine with the BRCA1 that had been captured by the capture probe. The capture unit, signal unit, and target DNA form a sandwich construction. The signal unit could catalyze the reduction in the colorimetric substrate 4-nitrophenol (4-NP). The dynamic constant of the reaction had a good linear relationship with the concentration of BRCA1 between 10−12 and 10−18 M, and the detection limit was 10−18 M.
There were various methods that could be used to amplify the signal of the colorimetric biosensor, such as metal-enhanced fluorescence. Choi et al. [92] developed a CRISPR–CAS12a-based nucleic acid amplification-free fluorescent biosensor to detect cfDNA via AuNPs-assisted MEF and colorimetric analysis. A special double-stranded DNA with a length of 7 nm was prepared to connect AuNPs with a diameter of 20 nm and AuNPs with a diameter of 60 nm. One end of the double-stranded DNA was directly connected to AuNPs with a diameter of 20 nm. The other end was modified with a single-stranded DNA with a length of 2 nm and fluorescein isothiocyanate (FITC). The single-stranded DNA was used to connect AuNPs with a diameter of 60 nm. FITC was used for the fluorescent indicator. Because FITC was too close to AuNPs with a diameter of 60 nm, FITC fluorescence quenching occurs. In the absence of BRCA1, CRISPR–CAS12a had no effect on the fluorescence behavior of FITC. When BRCA1 appeared, CRISPR–CAS12a would combine with BRCA1 to form a CRISPR–CAS12a complex to degrade the single-stranded DNA. The FITC would be far away from the 60 nm AuNPs. Then, the fluorescence of FITC would recover and the color of the solution changed from purple to red-purple. Without any DNA amplification, the biosensor could complete the detection within 30 min with a detection limit of 0.34 fM. The linear range was 1 fM–100 pM.
3.2.3. Surface Plasmon Resonance Imaging
A surface plasmon resonance imaging (SPRi) biosensor is based on the change in the refractive index near the metal–dielectric interface caused by the specific reaction of biomolecules at the metal–dielectric interface. The change in the propagation constant of surface plasmon would lead to the change in the coupling condition between the light wave and surface plasmon. The final measurement object is the change in the characteristic of the light wave interacting with the surface plasma [93].
The typical idea of the SPRi biosensor is modifying the surface of the chip with the specific receptor to capture the target directly, which would bring about the change in the signal, such as the intensities of the light. As shown in Figure 6, Szymanska et al. [94] developed a SPRi biosensor to detect the CEA. The cysteamine was modified on the surface of the gold chip as the connector. The EDC/NHS was used to modify the other end of cysteamine with the antibody to capture the CEA specifically. The linear range of the biosensor was 0.40–20 ng mL−1. The detection limit was 0.12 ng mL−1. The required sample size was only 3 µL.
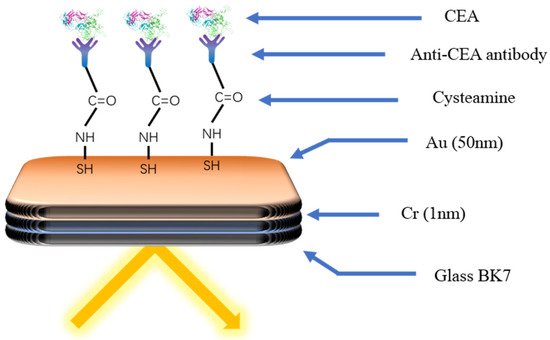
Figure 6. Schematic diagram of the immune biosensor for CEA detection [94]. The specific antibody was modified onto the gold surface through cysteamine. Capture of the target by the antibody causes a change in the light signal.
Besides proteins, SPRi can also detect other targets, such as exosomes. Sina et al. [95] used biotin-streptavidin to modify the HER2 antibody on the chip surface to detect HER2-positive exosomes. The linear range of the biosensor was 8280 exosomes μL−1–33,100 exosomes μL−1. The detection limit was 8280 exosomes μL−1. In order to improve the detection sensitivity, it is necessary to use signal amplification technology. Moreover, secondary amplification is required while the signal is still small after the first amplification. Wang et al. [96] modified the DNA probe on the surface of the gold electrode to capture exosomes. After the DNA probe captured the exosome, AuNPs were modified with exosome aptamer and the nucleic acid sequence T30 that could bind with nucleic acid sequence A30. Other AuNPs modified with nucleic acid sequence A30 were used for secondary amplification. After the secondary amplification, the detection limit of the exosomes reached 5000 exosomes mL−1.
3.2.4. Surface-Enhanced Raman Spectroscopy
Surface-enhanced Raman spectroscopy (SERS) is a kind of surface plasmon resonance effect produced by the analyte and metal plasma adsorbed on the substrate surface under the irradiation of a specific frequency incident laser, which leads to the obvious enhancement of the Raman scattering signal. The reaction between the probe and target would affect the Raman spectra. The change degree of the absorption peak reflects the concentration of the target.
The SERS biosensor is facing the same problem as other biosensors, such as a low primary signal and detecting multiple targets. For amplifying the primary signal of the biosensor, Han et al. [97] prepared a Au/Ag hybrid porous GaN and used it as the substrate of the SERS chip. The DNA probe with one end sulfhydrylated was modified on the chip surface to capture mir-k12-5-5p. With the amplification of the substrate, the detection limit of the biosensor got to 884 pM.
In order to detect multiple microRNAs simultaneously, Wang et al. [98] developed a SERS biosensor based on plasma coupling interference (PCI). PCI depends on the formation of the nano network. The nanoparticles modified with single-stranded capture DNA and Raman-labeled single-stranded receptor DNA, respectively, could form the nano network through the interconnection of DNA. After the formation of the nano network, the PCI effect would cause the Raman label to produce a strong SERS signal in the absence of the target DNA. The target DNA would affect the formation of the nano network through the competitive binding, resulting in the weakening of the SERS signal. By adjusting the DNA sequence used to form the nano network, the detection of different targets can be realized. By using different Raman labels for different detection targets, the biosensor can detect multiple microRNAs simultaneously.
3.2.5. Electrochemiluminescence Biosensor
The principle of electrochemiluminescence is to use the specific luminescence reaction induced by electrochemistry on the surface of the electrode. There is a functional relationship between the luminous intensity and the amount of the target [8].
In order to improve the detection limit of the ECL biosensor, a variety of detection strategies and appropriate signal amplification methods had been reported. Wang et al. [99] developed a super-sensitive biosensor for BRCA1 detection through ZnMOF (Ru) to amplify the ECL signal. The DNA probe with biotin, BRCA1, and ZnMOF (Ru) formed a sandwich construction. The linear range of biosensor detection was 1.0 fM–0.1 nM. The detection limit was 0.71 fM.
Similarly, in the case that the direct signal was too small to detect, the strategy of detecting indirect signals was also used in the ECL biosensor. Qiao et al. [100] developed an ECL biosensor to detect the EXO by the indirect signal. Mercaptopropionic acid-modified Eu3+-doped CdS nanocrystals (MPA-CdS: Eu NCs) and H2O2 were used as the ECL emitters and co-reactant. The surface of the electrode was modified with MPA-CdS: Eu NCs and the CD63 aptamer to capture the EXO secreted by the MCF-7 cells. The second DNA sequence, which had the CD63 aptamer sequence and could fold into G-tetrahedron/heme deoxyribozyme, would capture the EXO that had been captured on the surface of the electrode, and the ECL signal hardly changed. With adding the heme and K+, the second DNA sequence would fold into the G-tetrahedron/heme deoxyribozyme to catalyze the decomposition of H2O2, resulting in a significant reduction in the ECL signal. The degree of ECL signal reduction was linear to the logarithm of the exosome concentration. The linear range of the test is 3.4 × 10⁵–1.7 × 10⁸ exosomes mL−1. The detection limit was 7.41 × 10⁴ exosomes mL−1.
For improving the detection limit of the ECL biosensor, Cui et al. [101] amplified indirect signals with signal amplification techniques. This ECL biosensor was based on the double signal amplification of an isotherstranded display polymerase reaction (ISDPR) and bridge DNA–AuNPs nanocomposites. The detection strategy was to decompose the target RNA into a large amount of auxiliary DNA by ISDPR reaction and then detect it and amplify the signal. The electrode surface was modified with the DNA probe to capture the auxiliary DNA. The bridge DNA–AuNPs nanocomposites were added to bind to the captured auxiliary DNA for primary signal amplification. Afterward, the streptavidin-modified Ru(dcbpy)32+ complex would bind to biotin-labeled single-stranded DNA on AuNPs to achieve secondary amplification. The linear range of biosensor detection was 0.01–10,000 fM. The detection limit was 3.2 aM.
In summary, optical biosensors are also capable of detecting the full class of breast tumor markers. The surface of the chip is functionalized by the receptor to achieve the specific capture of the target. The signal amplification could be realized by carbon dots, graphene quantum dots, AuNPs, MOF, enzymatic reaction, MWCN, nanocrystals, etc. The sensitivity of the optical biosensor is equivalent to the electrochemical biosensor.
3.3. Other Types of Biosensors
In addition to electrochemical and optical biosensors, there are also quartz crystal microbalance (QCM) biosensor and photoelectrochemical biosensor. QCM is used to detect the mass change of the target. The photoelectrochemical (PEC) biosensor is used to detect the effect of the targets on the photoelectric characteristics of materials.
3.3.1. QCM Biosensor
The sensing principle of QCM is based on the effect of the target on the frequencies of the bulk acoustic waves generated in the piezoelectric quartz crystal. The frequency change of the acoustic wave is related to the mass change on the chip surface, so as to realize the concentration detection of the target. QCM is able to detect nanogram-level mass changes on the chip surface [102].
By modifying different receptors on the surface of QCM chip, QCM can detect different kinds of tumor markers. For instance, Yang et al. [103] modified the polydopamine and polyethyleneimine composite membrane and hyaluronic acid on the QCM chip surface to capture the CD44 protein on the surface of breast cancer cells. The detection limits of MDA-MB-231 (M231) cells and MCF-7 cells were 300 cells mL−1 and 1000 cells mL−1, respectively. In contrast to capturing the target DNA with a DNA probe, as shown in Figure 7, Park et al. [104] chose to capture the double-stranded body formed by the binding of the target and the probe. Considering the mass of DNA was too small, the DNA probe was modified on the surface of the AuNPs to increase the weight of the double-stranded DNA. The detection time was 105 min. The detection limit was 3.6 pM. The detection linear range was 2.5 pM–2.5 μM.
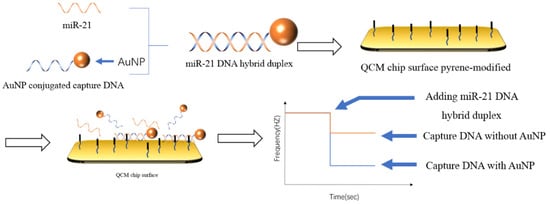
Figure 7. Schematic illustration of the QCM biosensor for miRNA detection [104]. The DNA that had formed a double strand was captured by the DNA embedding agent modified on the surface of the chip, and the AuNPs modified at the end of the probe were used to amplify the mass change on the chip surface.
The use of the second antibody could also amplify the mass change on the QCM chip surface. Lin et al. [105] used a sandwich detection strategy to realize the detection and signal amplification of CA15-3. First, a two-dimensional nanomaterial MoS2 film was coated on the surface of the QCM chip, and the first antibody of CA15-3 was modified on the MoS2 film by physical adsorption. Then the CA15-3 was added and captured by the first antibody. Subsequently colloidal gold with the second antibody of CA15-3 modified was added to combine with the captured CA15-3 for signal amplification. The linear range of the biosensor was 0.5–100 U mL−1, and the detection limit was 0.5 U mL−1.
In addition, considering the antibody capture efficiency, it is important to increase the quantity of the antibody that was modified on the surface of the QCM chip. Bakhshpour et al. [106] modified 2-hydroxyethyl methacrylate-PHEMA nanoparticles on the surface of QCM chip to increase the surface area of the chip to increase the quantity of the antibody. Then, the Notch-4 receptor antibody was modified on the chip surface by carbodiimide to capture the MDA MB 231 cancer cells specifically. The detection limit of the biosensor was 12 cells mL−1.
3.3.2. Photoelectrochemical Biosensor
The principle of the PEC sensor is that when the light irradiates the photoelectric active material, the electrons in the material are excited, leading to a photocurrent or photovoltage. The recognition probe on the surface of the photoelectric active material captures the target, which would cause the change in the photocurrent or photovoltage. When the concentration of the target changes, the photoelectric signal changes accordingly. There is a relationship between the concentration of the target and the photoelectric signal. Various PEC biosensors had been reported to detect tumor markers.
Guo et al. [107] developed a dual-signal amplification HER2 PEC biosensor. The biosensor was prepared based on the tungsten sulfide nanowire array on Ti mesh (WS2 NW/TM). The HER2 aptamer was wrapped onto the WS2 NW/TM surface for specific capture of the HER2 molecules. The signal amplification was achieved by the AuNPs that were modified with glucose oxidase (GOx) and HER2-binding peptides. The AuNPs would directly amplify the photocurrent. The GOx catalyzed the decomposition of glucose into hydrogen peroxide would increase the photocurrent. The linear range of the biosensor was 0.5–10 ng mL−1. The detection limit was 0.36 ng mL−1.
In addition, Fu et al. [108] developed a PEC detection platform for vascular endothelial growth factor 165 (VEGF165) based on the characteristic of the porous Cu2O-CuO flowers that could cause photocurrent polarity conversion of CdS quantum dots modified ITO electrode. CdS quantum dots were modified on the surface of the ITO electrode to generate a large anodic current. Then, the hairpin DNA1 (HP1) was modified to capture the DNA S1. The DNA S1 bound with the VEGF165 aptamer. When VEGF165 was captured, the DNA S1 would be released and captured by the HP1. Then, biotin-labeled hairpin DNA2 (bio-hp2) was added to catalyze the hairpin assembly process. A large amount of HP1/bio-hp2 double-stranded DNA would be formed on the electrode surface. The peak value of the photocurrent was linear with the concentration of VEGF165 in the range of 1–3000 fM. The detection limit was 0.3 fM.
In conclusion, QCM and PEC are also capable of detecting all types of tumor markers. The signal amplification of the QCM biosensor is mainly to amplify the mass change of chip surface. The signal amplification of the PEC biosensor is to amplify the change of photocurrent and photovoltage caused by the target. While it is possible to improve the detection limits of QCM and PEC sensors for detecting a single target through signal amplification techniques, they have difficulty detecting multiple targets simultaneously.
This entry is adapted from the peer-reviewed paper 10.3390/life12030342
This entry is offline, you can click here to edit this entry!