Your browser does not fully support modern features. Please upgrade for a smoother experience.
Please note this is an old version of this entry, which may differ significantly from the current revision.
When planning a travel or an adventure, sightseers increasingly rely on opinions posted on the Internet tourism related websites, such as TripAdvisor, Booking.com or Expedia. Unfortunately, beautiful, yet less-known places and rarely visited sightspots often do not accumulate sufficient number of valuable opinions on such websites. An approach is developed consisting of a system (PSRS) for wildlife sightspots and propose a method for verifying collected geotagged tweets and using them as on-spot reviews.
- Park Supplementary Review System
- less-known tourist spots
- on-spot reviews
1. Introduction
Recently, there has been a rapidly increasing demand for the application of information technologies in the field of tourism (defined with a blanket term of Tourism Informatics). Diverse Big Data have been applied to tourism research and have made considerable improvements, for example, in the development of recommendation systems (Masui et al. [1]), navigation systems (Yoshida et al. [2]), and regional content tourism support systems (Masui et al. [3]). The main goal is to promote tourism of a specific place and to provide personalized information as per specific search. Apart from the developed systems, the task of analyzing tourism information is of great importance. It enables the collection of large amounts of data to supplement the developed systems. By data sources, tourism-related Big Data generally fall into a few broad categories, which include the following.
-
User Generated Contents (UGC), defined as data generated by users which includes online textual and photo data, etc.;
-
Device Data (generated by devices), which includes GPS data, roaming data from mobile devices, Bluetooth data, etc.;
-
Transaction Data (generated by operations), with the likes of Web search data, Web page visiting data, or online booking data.
These carry different information and different data types which may address different tourism issues as explained by Ling et al. [4].
The Internet today has vastly altered the data landscape, by accumulating a lot of information. People, businesses, and devices have all become data factories that are pumping out large amounts of information to the Web each day, Askitasklaus et al. [5]. This huge amount of data shared on the Internet can be utilized to foster tourism activities in a given specific area. Internet users can easily express their opinions about a product, service or a place they have recently visited using popular Social Networking Services (SNS), such as Twitter, Facebook, or Instagram and reach millions of other potential visitors. In this way, people tend to transmit their daily events in the form of diaries and textual messages using online social services such as blogs, online posts, microblogs, and other SNS. Among many SNS, the one that has been greatly popular for people to express their opinions, share their thoughts, and report real-time events has been Twitter (https://twitter.com/, accessed on 15 January 2022). Many companies and organizations have been interested in utilizing the data appearing on Twitter to study the opinions of people towards different products, services, facilities, and events taking place around the world. Through Twitter, a great number of messages (known as “tweets”) are posted daily because of its simplicity. Moreover, with GPS technology implemented in mobile phones and computers, sightseers as well share their views and pictures regarding their tour experiences on Twitter. This type of information is valuable and important in facilitating tourism activities of the specific area tagged with GPS information. Online opinions thus can have a great impact on brand, product or place reputation. For this reason, some potential visitors make informed decisions based on online opinions. Primarily, there is a number of online review sites for tourism related activities, such as TripAdvisor (https://tripadvisor.com/, accessed on 15 January 2022), Booking.com, or Expedia (https://www.expedia.com, accessed on 15 January 2022).
Unfortunately, less-known and rarely visited sightspots often do not accumulate sufficient number of valuable opinions. Therefore, to address this, we introduce the concept of using on-spot reviews (on-spot tweets with contents verified to contain visitor opinions). These are Internet opinions about the target spot extracted from geotagged tweets. To prove the adequateness of the extracted information we propose our classification method that uses a fine-tuned BERT model. Previously, Shimada et al. [6] introduced a method to identify on-site likelihood of tweets using a two-stage method, a rule based and contextual approach. Unlike them, in our proposed method we prove adequateness using a fine-tuned BERT model.
Approved geotagged tweets are mapped as on-spot reviews in the designed system (PSRS). This is realized as efforts to cultivate newly Point Of Interest (POI) and to supplement additional information to the less-known places in the target spot (Serengeti and Ngorongoro) National Park (NP), which are famous and largest NP in northern Tanzania. Serengeti’s annual great wildebeest migration is an iconic feature of the park which is happening around the end of year. The two parks are in the list of UNESCO World Heritage Sites with Serengeti NP property changing seamlessly to Ngorongoro Conservation Unit (see Figure 1 for details). The plains of Serengeti NP, comprising 1.5 million hectares of savanna, while the annual migration of two million wildebeests, with thousands of other ungulates in search of pasture and water, engage in a 1000 km long annual circular trek spanning the two adjacent countries of Kenya and Tanzania. It is known to be one of the nature’s most impressive spectacles (https://whc.unesco.org/en/list/156/,accessed on 15 January 2022). The two spots together cover the area of more than twenty thousand square kilometers with many sightspots scattered around the area. Because of its wide area, some spots are less-known among sightseers than others and therefore rarely visited, thus accumulating few reviews.
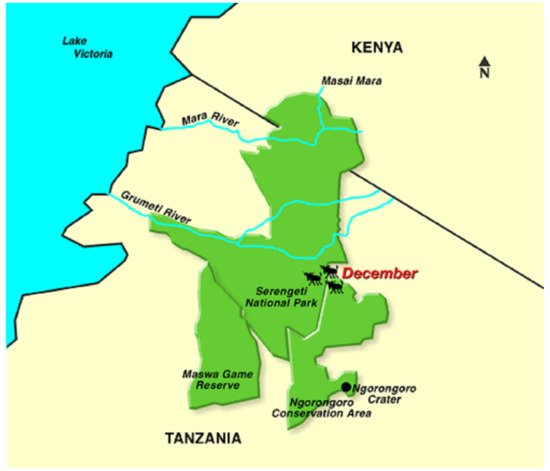
Figure 1. A map and a bird’s eye view on the target sightseeing spots analyzed in this study—Ngorongoro and Serengeti NP.
Additionally, the wildebeest migration is a famous but seasonal scenery across the target spot. Precise timing is entirely dependent upon the rainfall patterns each year. Hence, POI also differ periodically. Despite the fact that the migration and animal spot can be predicted, in this study, we take extra efforts to cultivate new POI pointed out in tweets by tourists. This is an important task as it can improve tourism activities of those target spots. Moreover, if the method is verified as effective, it can be applied also to other such attractive, yet not often visited sightseeing spots, all around the globe, in any country.
2. Related Work
Extraction and Presentation of Tourism Information
In recent years, various studies have been conducted on the provision and analysis of tourism-related information on the Web.
Okamura et al. [14], proposed an automatic score generation method in favor of the least reviewed local restaurants by analyzing the reviews posted on the Internet. They proposed a decision model using a convolution neural network with two hidden layers under a back propagation algorithm.
Lee et al. [15] proposed a geo-social event detection system by monitoring crowd behaviors indirectly through Twitter. Their proposed method focuses on temporal features within the target spot as an important factor for extracting geo-social events.
On the other hand, Cheng et al. [16] proposed a method of predicting a user’s location by focusing on the content of the tweet. Their method relies on the approach of the three key features which are (a) reliance purely on tweet content; (b) classification of words in tweets with a strong local geo-scope; and (c) a lattice-based neighborhood smoothing model.
Sakaki et al. [17] studied event detection from Twitter data, by applying Kalman filtering and particle filtering, which are widely used for location estimation in pervasive computing.
In summary, these studies show that User-Generated Content has become a popular medium for expressing opinions and sharing knowledge about items such as products and travel entities while on the other hand, an essential tool for researchers to extract information.
Tourist Information Recommendation
Several studies propose recommendations of POI by suggesting suitable locations based on user preferences.
Oku et al. [18] proposed a method of mapping geotagged tweets to sightspots based on the substantial activity regions of the spots. Their method learns from One-Class Support Vector Machines-based classifier which first extracts temporal and phrasal features of the pattern sentences for classification and further maps the tweets into respective regions. Location-based SNS such as Foursquare were useful in this study by providing geotagged post data.
Shimada et al. [6] suggested a method that identifies on-site likelihood adequateness of posted tweets with a two-stage method, which includes rule-based filtering, and a machine learning (ML) technique. In their method, a previous and next tweet was taken into consideration as a potential target defining context information. The analysis of the experimental results shows the effectiveness of the combined applied techniques.
Overall, as discussed above, there have been some studies attempting to extract characteristics of the target regions based on geotagged contents.
However, while many of the above-mentioned studies, focus on the extraction of information using either rule-based approaches or simple ML classifiers (e.g., SVM), we focus on extraction of online opinions and assigning scores by adopting a state-of-the-art neural network-based architecture (BERT).
3. Park Supplementary Review System
- (i) classifies on-spot tweets from Twitter data by incorporating clustering and BERT
- (ii) adds rating information to on-spot judged tweets
In this section, we firstly, introduce the procedures involved in realization of the proposed method and further discuss its inner processes at each stage.
The proposed method incorporates location clustering and classification techniques. The outline of the procedures involved, consists of a series of stages as observed in Figure 1.
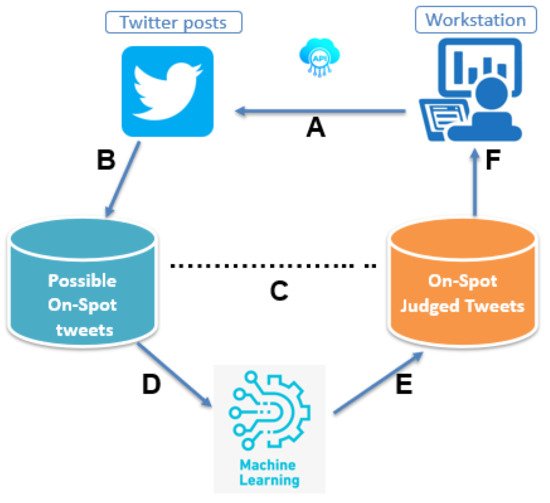
Figure 1. Outline of procedures constituting the proposed method.
Figure 1 outlines the procedures involved in the realization of the proposed method. In stage A, tweets are collected from the Internet by specifying the keywords “ngorongoro” and “serengeti”, which may appear anywhere in the tweet, by using an accredited Twitter API (https://developer.twitter.com/en/products/twitter-api, accessed on 15 January 2022). In stage B, we cluster the collected tweets by location. A K-means algorithm, which is a vector quantization algorithm introduced by Hartigan et al. [19] is applied to tweets’ location information to automatically partition them into clusters K, by calculating the nearest mean from cluster centroid. Tweets located within the target spot estimated boundaries are retained. Since the target spot boundaries are not explicitly specified, we decide our target spot boundaries with the help of Google maps (https://maps.google.com/, accessed on 15 January 2022) which highlights the East, West, North and South boundaries of the target spot as follows;
-
East = 2°24'13.5''S 35°16'03.4''E
-
West = 2°11'27.2''S 34°07'58.8''E
-
North = 1°26'33.6''S 34°48'45.0''E
-
South = 3°11'02.6''S 34°38'08.2''E
In stage C, we manual annotate location clustered tweets as either on-spot or not. We also assign sentiment score to the tweets. To accomplish this task, we use three annotators. The details of annotation task is discussed in details in later part of this article.
In stage D and E, we trained our classifier to predict tweets and the sentiment score assigned to them and further evaluate the model performance. We adopt a pre-trained BERT neural network model for this task. In stage F, we map selected and rated tweets as touristic information in the designed system (PSRS).
3.1. Location Clustering of Tweets
Clustering is the task of grouping a set of objects in such a way that objects in the same group (called a cluster) are more similar (in some sense) to each other than to those in other groups (clusters).
Using K-means clustering, the number of clusters must be decided beforehand. Based on collected tweets data distribution, we adopt a technical approach method to identify the optimal number of clusters using an Elbow method, Average Silhouette method, and Gap statistics method, respectively. Figure 2 shows the results of the most optimal number of cluster groups as obtained from an Elbow method.We can further observe a 2D representation of the obtained clusters with the distribution of extracted tweets as shown in Figure 3.
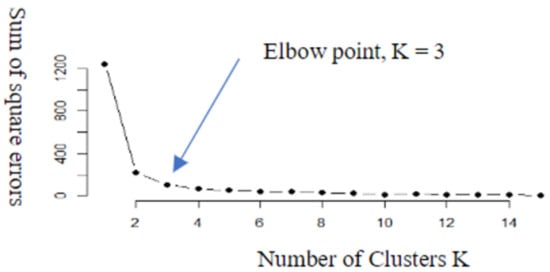
Figure 2. Number of clusters (K).
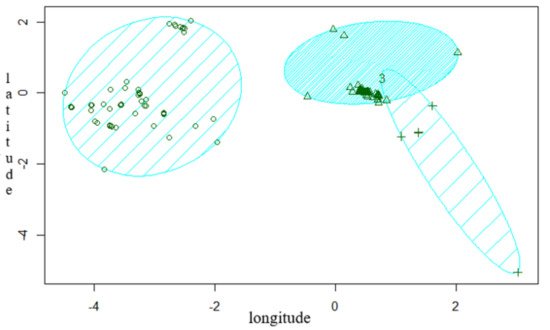
Figure 3. Clusters of geotagged tweets.
We analyze the results of location clustering and consider tweets within the target spot boundaries as potential on-spot reviews. We use filtering approach to distinguish tweets beyond target spot boundaries.
3.2. Corpus Annotation
Annotation is a methodology for adding information to a document at some level, such as a word, a phrase, paragraph, section, or the entire document. Manual text annotation is an essential part of text analytics. Although annotators (workers performing the manual annotation) work with limited parts of data sets, their results are applied to further train automated text classification techniques and thus affect the final classification results. Automated text analytics methods rely on manually annotated data by building their heuristic, or statistical rules, or neural networks on such annotated data (Bobicev et al. [20]). In the annotation process, we define the text to annotate, set labels to put in tweets, and we discard tweets with a certain degree of ambiguity so as to reduce noise when classifying.
To accomplish this task, we asked three annotators to carefully assign the clustered 1273 tweets. Additionally, annotators also assigned sentiment score of tweets as either positive, neutral or negative.
3.3. Inter-Rater Agreement
The reliability of annotations and adequacy of assigned labels are especially important in the case of sentiment annotations. In particular, Plaban et al. [21], addressed the importance of evaluating the reliability between annotators for statistical accuracy. To measure the agreement between three raters, we use Cohen’s kappa coefficient, Cohen et al. [22].
Kappa coefficient between two or more annotators can be computed by using the following formula:

In this above equation, Po is the relative observed agreement among raters, and Ph is the hypothetical probability of chance agreement, using the observed tweets data to calculate the probabilities of each observer randomly seeing each category.
When kappa = 1, the annotators are in complete agreement. When the score is negative, it shows that there is no effective agreement between annotators, or the agreement is worse than random.
In addition, the hypothetical probability of the chance of agreement can be computed using the following formula:

where k represents categories, and N being the number of observations to categorize. In this study, the degree of agreement between the three annotators was calculated as 0.37. Kappa’s have specific interpretations, and 0.37 can be interpreted as “substantial”, “fair”, “medium” or “somewhat good” depending on the interpretation (Landis and Koch et al. [23]). This value, however, is not high to say annotators have an agreement on the annotation results. From this observation, we can assume that the final results of our proposed model was also affected by the low level of agreement between annotators. One way to improve this is by carefully removing ambiguous tweets, which will be our improvement consideration in our future work.
3.4. Feature Selection
Many tourism-related tweets on Twitter do not contain on-spot information. One of the solutions to extract on-spot tweets is by classifying them as such by using a machine learning-based classifier. In collecting tourists’ tweets, it is necessary to determine the conditions of considering which tweets are tourists’ tweets. Therefore, we introduce a set of tweets classification features to be used for the automatic classification as follows:
Tweet location: We observed that tweets tweeted within the radius of the target spot’s boundaries (latitude and longitude) introduced in the previous section which was acquired using Google’s Geocoding API (https://developers.google.com/maps/documentation/geocoding/overview, accessed on 15 January 2022) often had a high chance of becoming a valuable on-spot review.
Presence of “NOW”: The word “now” is a characteristic keyword on Twitter. Although the presence of the word does not always indicate on-spot information, it is considered to suggest a high probability of the tweet containing on-spot information. We, therefore, retain tweets with this word.
Presence of a mention “@ Target spot”: In many cases, tourists’ tweets about places they are sightseeing are accompanied with images the users attach to tweets by using mobile camera functions. At that time, expressions such as “@ Serengeti national park” frequently indicate places visited after “@”.
Bag of Words (BOW): All words from the whole corpus with the term frequency for the BOW language model, which contains 1273 sentences.
3.5. BERT for Classification
We adopted a BERT model for the training and evaluation of our classifier. BERT architecture is defined as follows; “BERT stands for Bidirectional Encoder Representations from Transformers. It is designed to pre-train deep bidirectional representations from an unlabeled text by jointly conditioning on both the left and right context. As a result, the pre-trained BERT model can be fine-tuned with just one additional output layer to create state-of-the-art models for a wide range of NLP tasks” [24]. The Transformers architecture is the main block in BERT. Transformers is a deep learning model used primarily in the field of NLP. It is deeply bidirectional which means it learns from both sides during the training phase. Its token input representation is constructed by summing the token, segment, and position embeddings [25]. One of the biggest challenges in NLP is the shortage of training data. However, by adopting a fine-tuned BERT model that takes into account the context orientation of the token in the sentence, it is in theory possible to obtain high results with only a limited amount of training data. This is the main reason behind adopting this approach. This advantage is due to the impact of the pre-training mechanism, which established the formula of transfer learning in NLP. The transfer learning process in NLP can be achieved with two major processes, namely, a pre-training process and a fine-tuning process.
This entry is adapted from the peer-reviewed paper 10.3390/app12052321
This entry is offline, you can click here to edit this entry!