Spring wheat is an important crop in Russia, with an annual cropping area of 11–12 Mha. The main spring wheat-production belt stretches from the mid-Volga region across the southern Ural mountains to Western Siberia. This is a short-season crop grown from May to August in an extensive, rainfed cropping system dominated by cereals, and occasionally rotated with oilseed and legume crops.
1. Introduction
Spring wheat is an important crop in Russia, with an annual cropping area of 11–12 Mha. The main spring wheat-production belt stretches from the mid-Volga region across the southern Ural mountains to Western Siberia. This is a short-season crop grown from May to August in an extensive, rainfed cropping system dominated by cereals, and occasionally rotated with oilseed and legume crops. Morgounov et al.
[1] compared the effects of climate change on spring wheat production in Eurasia (Russia and Kazakhstan) and North America. The grain yields and production gains in North America were almost twice that in Eurasia, owing to better environmental conditions, including precipitation, as well as application of more advanced and diverse production technologies based on conservation agriculture. Wheat produced in Russia is traded both regionally and internationally. According to the FAO (
www.fao.org/faostat, accessed on 1 January 2019), Russia exported 43.9 Mt of wheat grain in 2018. Therefore, grain quality, including health benefits or hazards, is important for global food security and safety.
The ionome has been defined as the mineral element composition of an organism, and represents the inorganic component of cellular and organismal systems
[2]. Therefore, ionomics involves the quantitative measurement of the element composition of living organisms, and of changes in this composition in response to environment, growth stage, and genotype. Minerals comprising wheat grain can be divided into three groups: macroelements (Ca, K, Mg, P, Cl, and S) that are important for starch and protein formation; toxic heavy metals (arsenic (As), cadmium (Cd), chromium (Cr), and lead (Pb)), normally regulated not to exceed certain concentrations; and microelements essential for plants and humans (selenium (Se), boron (B), Mn, Cu, Fe, Mo, and Zn), which can also be harmful when exceeding certain concentrations. All five microelements, along with Ca and iodine, were selected as candidates for biofortification to improve nutritional value of crops, including wheat
[3].
Wheat biofortification has been successfully applied for increasing Zn content in grain with commercial cultivars being grown in India and Pakistan
[4][5]. A nutrition study with preschool children and women showed that consumption of high Zn-biofortified wheat prevented morbidity
[6]. The concept of biofortification has not been applied in wheat breeding in Russia, and only a few studies have assessed the mineral composition of wheat cultivars grown in Russia. Bityutskii et al.
[7] studied around 30 registered wheat cultivars and found variation in the microelement concentrations of grains (µg/g), Fe 15–22, Zn 14–21, and Mn 2.4–4.1. Morgounov et al.
[8] determined 15 macro- and microelement concentrations in 49 genotypes grown across six sites in Russia and Kazakhstan in two years. Several cultivars (Element-22, Lutescens-3-04-21-11, and Silach) were identified as having high grain yields, relatively high protein content, and high concentrations of P, S, Mn, Cu, and Zn, singly or in combination. The above studies suggest that it could be possible to develop a varietal development program for improving mineral nutrients. In particular, the presence of multiple elements in combination in the same genotype indicates a positive association among them. A positive correlation between two elements could be exploited in a breeding program more efficiently, and could simultaneously improve them, using a selection index
[9].
The success of wheat biofortification at CIMMYT was largely based on the utilization of genetic resources with high concentrations of nutritionally valuable elements
[10]. Significant genetic variation for grain Zn and Fe was found in landraces and ancestors of common wheat, such as
Aegilops tauschii,
Triticum turgidum ssp.
dicoccoides,
T. turgidum ssp.
Dicoccum, and
T. aestivum ssp.
spelta. Einkorn (
Triticum monococcum) was later added to this list
[11]. This variation has been introduced into high-yielding germplasm through conventional breeding and marker-assisted breeding
[5].
Western Siberia (Kurgan, Tuymen, Omsk, Novovsibirsk, and Altai regions) grows around 7 Mha of spring wheat with an average grain yield of 2 t/ha. Drought is the most common abiotic stress, and leaf and stem rust are the main diseases affecting the crop. Spring wheat breeding programs in the region are united through the Kazakhstan–Siberian Network on Spring Wheat Improvement (KASIB). This network was established in 2000 with the objective of exchanging germplasm and conducting cooperative multilocational testing to characterize advanced breeding lines and new cultivars. The majority of the cultivars grown in the region represent tall, daylength-sensitive material with good drought tolerance and suitable bread-making quality
[12]. The studies of KASIB germplasm demonstrated limited genetic diversity for resistance to stem
[13] and leaf rust
[14]. Overall, cultivars grown in the region have similar genetic makeup and high phenotypic similarity.
In order to expand spring wheat’s diversity, a panel of genetic resources (OMON-GAI (Omsk Observation Nursery–Genetically Associated Improvement)) was assembled at Omsk State Agrarian University, the KASIB network coordinator for Russia. The panel included primary synthetics from CIMMYT and Japan, cultivars from USA, Omsk cultivars developed by the university, and Omsk Agrarian Research Center and the KASIB network’s germplasm. The panel was phenotyped for common agronomic traits in 2017–2020 and genotyped using the genotyping-by-sequencing method, resulting in over 46,000 SNPs (single nucleotide polymorphism). The genetic diversity study clearly separated all material into three groups: CIMMYT synthetics, Japanese synthetics, and a combined group of bread wheat germplasm from KASIB and the USA
[15]. A genome-wide association study (GWAS) was conducted on yield and 26 yield-related traits, disease resistance, and grain quality traits
[16]. The study identified 243 significant marker–trait associations for 35 traits that explained up to 25% of the phenotypic variance, with the most significant of these having already been used in the marker-assisted breeding at the university.
Ionome phenotyping of the OMON-GAI panel for 23 elements was performed using grain from the 2017 and 2018 seasons. The objective of the study was to evaluate the variation of macro- and microelements, and trace metals in the different groups of genetic resources, identify the relationship between the agronomic and quality traits and element concentrations, select superior genotypes, and develop approaches to be used for breeding to enhance the element composition of wheat cultivars.
2. Variation for Agronomic Traits
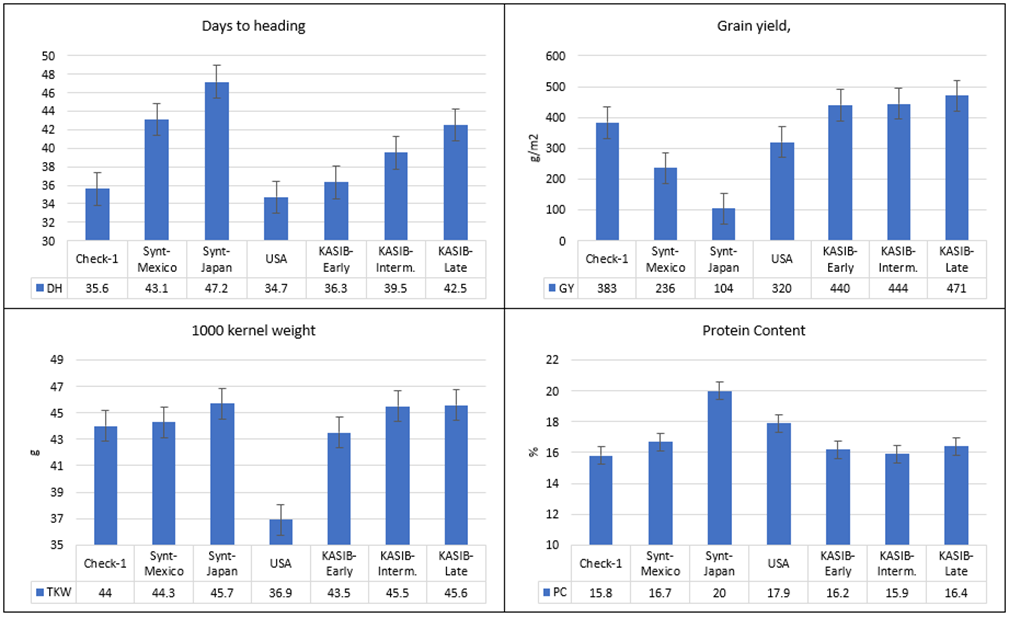
The analysis of variance of the number of days to heading, TKW, grain yield, and protein content data demonstrated the high significance of genotypes, years, and their interaction, except for the effect of years on TKW. The weather conditions during the spring wheat growing season in 2017 were characterized by air temperatures close to the long-term average (17.3 °C in May–August versus 17.0 °C) and a moderate moisture stress, with precipitation of 163 mm during May–August, compared to the 238 mm long-term average. The 2018 growing season was cooler (15.2 °C in May–August) with 270 mm of rainfall. Leaf and stem rust affected susceptible genotypes with up to 30–40% severity in 2017 and up to 60–80% in 2018. These pathogens certainly affected the grain yield. The average yield of the whole panel was 320 g/m2 in 2017 and 395 g/m2 in 2018.
The relative performance of the different groups of genetic resources across the two years is presented in Figure 1. The number of days to heading varied from 35 (USA group) to 47 days (Japanese synthetics). The differences between the three KASIB groups were 36.3 days for the early group, 39.5 for the intermediate, and 42.5 for the late group. The highest grain yield was recorded for the three KASIB groups (440–471 g/m2), followed by the US cultivars (320 g/m2), the CIMMYT synthetics (236 g/m2), and the Japanese synthetics (104 g/m2). The early maturing check Pamyati Azieva demonstrated a grain yield of 399 g/m2, and the intermediate-maturing check Serebristaya, 470 g/m2. TKW was in a range of 44.0–45.7 g for all groups, though the US cultivars had smaller grain (36.9 g). The highest protein content was recorded for the Japan synthetics (20%), followed by the US cultivars (17.9%), the CIMMYT synthetics (16.7%), and the KASIB groups (15.9–16.4%). Overall, the research panel used in the study was highly heterogeneous and contrasting, especially for vegetative period and grain yield.
Figure 1. Variation for agronomic traits in different groups of genetic resources, average values for 2017–2018, and bars representing standard error.
3. Adjustment of Grain Element Concentration
The correlation analysis was conducted to find the relationship between the concentrations of the 15 elements and agronomic traits (grain yield, protein content, and TKW) (Table 1). The analysis was performed separately for each year. Protein content was found to be positively correlated with the concentrations of 11 of the elements in one or both years. Only Ca, K, Co, and Rb were not correlated with protein content. However, the correlation coefficients between protein content and the elements ranged from 0.2 to 0.4, indicating weak relationships. Mg concentration was significantly correlated with 10 of the elements, with correlation coefficients exceeding 0.6 for P, S, Cu, and Mn. P and S concentrations were also positively correlated with microelements (Cu, Mn, and Zn) and toxic trace elements (Cd, Ni, and Mo). Among the macroelements, variation in Ca and K concentrations was the least correlated with any agronomic trait or other element. Co, Rb, and Fe (2018) concentrations were not correlated with any trait.
Table 1. Correlation coefficients between agronomic traits and element concentrations in grain, 2017–2018.
| Element |
Year |
Yield |
PC |
TKW |
Ca |
K |
Mg |
P |
S |
| Ca |
2017 |
−0.11 |
0.06 |
−0.14 |
- |
0.16 |
0.15 |
0.01 |
0.09 |
| 2018 |
−0.14 |
0.06 |
−0.15 |
- |
−0.03 |
0.22 * |
0.03 |
0.11 |
| K |
2017 |
−0.13 |
0.03 |
0.10 |
0.16 |
- |
−0.07 |
−0.07 |
0.30 * |
| 2018 |
−0.19 |
0.16 |
0.17 |
−0.03 |
- |
0.07 |
0.07 |
0.09 |
| Mg |
2017 |
−0.24 * |
0.43 * |
−0.07 |
0.15 |
−0.07 |
- |
0.79 * |
0.60 * |
| 2018 |
−0.19 |
0.29 * |
−0.06 |
0.22 * |
0.07 |
- |
0.76 * |
0.55 * |
| P |
2017 |
−0.14 |
0.32 * |
0.08 |
0.01 |
0.20 * |
0.79 * |
- |
0.68 * |
| 2018 |
−0.22 * |
0.30 * |
0.05 |
0.03 |
0.48 * |
0.76 * |
- |
0.20 * |
| S |
2017 |
−0.23 * |
0.45 * |
0.13 |
0.09 |
0.30 * |
0.60 * |
0.68 * |
- |
| 2018 |
−0.34 * |
0.47 * |
0.12 |
0.11 |
0.09 |
0.55 * |
0.20 * |
- |
| Cu |
2017 |
−0.14 |
0.28 * |
−0.02 |
−0.03 |
0.10 |
0.62 * |
0.68 * |
0.54 * |
| 2018 |
−0.21 * |
0.25 * |
0.01 |
0.08 |
0.21 * |
0.60 * |
0.60 * |
0.47 * |
| Fe |
2017 |
−0.10 |
0.23 * |
0.29 * |
−0.01 |
−0.14 |
0.23 * |
−0.06 |
−0.09 |
| 2018 |
−0.13 |
0.17 |
−0.14 |
−0.03 |
−0.12 |
0.05 |
−0.04 |
−0.10 |
| Mn |
2017 |
−0.13 |
0.35 * |
−0.02 |
0.11 |
−0.10 |
0.68 * |
0.57 * |
0.49 * |
| 2018 |
−0.09 |
0.05 |
0.09 |
0.22 * |
−0.10 |
0.63 * |
0.46 * |
0.38 * |
| Zn |
2017 |
−0.03 |
0.20 * |
0.04 |
−0.08 |
0.02 |
0.53 * |
0.73 * |
0.48 * |
| 2018 |
−0.30 * |
0.26 * |
0.02 |
0.09 |
0.27 * |
0.49 * |
0.63 * |
0.50 * |
| Cd |
2017 |
−0.20 * |
0.29 * |
0.01 |
0.00 |
−0.02 |
0.46 * |
0.44 * |
0.49 * |
| 2018 |
−0.22 * |
0.38 * |
0.10 |
0.09 |
0.05 |
0.37 * |
0.32 * |
0.40 * |
| Co |
2017 |
0.01 |
0.07 |
−0.19 |
0.12 |
0.14 |
0.17 |
0.14 |
0.04 |
| 2018 |
0.01 |
0.05 |
0.04 |
0.19 |
0.12 |
0.11 |
0.15 |
0.15 |
| Ni |
2017 |
−0.08 |
0.15 |
−0.01 |
−0.01 |
0.09 |
0.25 * |
0.25 * |
0.23 * |
| 2018 |
−0.24 * |
0.36 * |
0.01 |
−0.03 |
0.14 |
0.23 * |
0.28 * |
0.31 * |
| Mo |
2017 |
−0.07 |
0.20 * |
0.05 |
0.01 |
0.17 |
0.12 |
0.20 * |
0.24 * |
| 2018 |
−0.02 |
0.15 |
0.18 |
0.05 |
0.27 * |
0.21 * |
0.33 * |
0.26 * |
| Rb |
2017 |
−0.05 |
0.06 |
0.16 |
−0.02 |
0.12 |
0.04 |
0.08 |
0.07 |
| 2018 |
−0.18 |
0.12 |
0.01 |
0.07 |
0.18 |
−0.01 |
0.00 |
0.16 |
| Sr |
2017 |
−0.34 * |
0.22 * |
−0,08 |
0.60 * |
0.11 |
0.17 |
−0.00 |
0.16 |
| 2018 |
−0.34 * |
0.31 * |
−0.22 * |
0.65 * |
0.04 |
0.17 |
0.04 |
0.16 |
| Number of significant correlations |
11 |
18 |
3 |
4 |
6 |
16 |
14 |
15 |
*—significant at p > 0.05.
All significant correlations presented in Table 1 were used for adjustment of element concentrations through multiple regression. The basic statistical parameters of the original and adjusted values are presented in Table 2. The adjusted data had the same means, but the differences between the minimum and maximum values were reduced. This resulted in the reduction of the coefficient of variation (CV) for all elements by 0.2–6.4%. A factorial ANOVA (genotype x year) was performed for each element, using original and adjusted data. The level of significance of the main factors (genotype and year), using original and adjusted values, was identical. However, for five of the elements (Ca, Mg, P, S, and Cu) the interaction of genotypes x year was not significant (p > 0.05) using the original values, although it was significant when adjusted values were used in the ANOVA. This indicates that adjustment contributed to the higher capacity to distinguish significance of these important interactions. Overall, the adjustment of element concentrations using multiple regression was well justified and provided a more balanced approach for comparison of genetic resources and individual genotypes.
Table 2. Statistical parameters for original and adjusted values across all germplasm in 2017–18.
| Element-Year |
Data |
Adjustment Variables 1 |
Mean |
Min |
Max |
CV, % |
H2 |
r (Original–Adjusted) |
| Macroelements |
| Ca-2017 |
Original |
- |
362 |
237 |
518 |
15.1 |
0.59 |
- |
| Ca-2018 |
Original |
- |
397 |
266 |
531 |
13.8 |
0.49 |
0.98 |
| Adjusted |
Mg |
273 |
523 |
13.6 |
0.50 |
| K-2017 |
Original |
- |
3652 |
2654 |
5453 |
10.2 |
0.67 |
0.99 |
| Adjusted |
S |
2715 |
5314 |
10.1 |
0.69 |
| K-2018 |
Original |
- |
3642 |
2298 |
4992 |
15.7 |
0.79 |
- |
| Mg-2017 |
Original |
- |
1208 |
922 |
1532 |
9.1 |
0.60 |
0.56 |
| Adjusted |
YLD, PC, P, S |
997 |
1400 |
5.4 |
0.62 |
| Mg-2018 |
Original |
- |
1225 |
926 |
1524 |
8.5 |
0.58 |
0.66 |
| Adjusted |
PC, Ca, P, S |
1007 |
1461 |
5.6 |
0.69 |
| P-2017 |
Original |
- |
5180 |
3906 |
6701 |
10.2 |
0.43 |
0.54 |
| Adjusted |
PC, K, Mg, S |
4401 |
5995 |
5.6 |
0.62 |
| P-2018 |
Original |
- |
4699 |
3428 |
6993 |
12.3 |
0.57 |
0.48 |
| Adjusted |
YLD, PC, K, Mg, S |
3835 |
5500 |
5.8 |
0.68 |
| S-2017 |
Original |
- |
2059 |
1710 |
2682 |
9.5 |
0.69 |
0.60 |
| Adjusted |
YLD, PC, K, Mg, P |
1768 |
2386 |
5.8 |
0.59 |
| S-2018 |
Original |
- |
2050 |
1572 |
2698 |
9.6 |
0.71 |
0.64 |
| Adjusted |
YLD, PC, Mg, P |
1762 |
2433 |
6.1 |
0.66 |
| Microelements |
| Cu-2017 |
Original |
- |
4.66 |
3.09 |
7.08 |
13.8 |
0.54 |
0.76 |
| Adjusted |
PC, Mg, P, S |
3.53 |
6.29 |
10.4 |
0.63 |
| Cu-2018 |
Original |
- |
3.72 |
2.30 |
6.06 |
15.3 |
0.57 |
0.74 |
| Adjusted |
YLD, PC, Mg, P, S |
2.67 |
5.22 |
11.3 |
0.55 |
| Fe-2017 |
Original |
- |
37.7 |
21.1 |
53.6 |
14.2 |
0.50 |
0.90 |
| Adjusted |
PC, Mg |
21.4 |
51.8 |
12.9 |
0.40 |
| Fe-2018 |
Original |
- |
35.8 |
22.5 |
47.2 |
12.9 |
0.25 |
- |
| Mn-2017 |
Original |
- |
43.1 |
31.9 |
60.0 |
11.2 |
0.58 |
0.72 |
| Adjusted |
PC, Mg, P, S |
31.0 |
52.4 |
8.2 |
0.58 |
| Mn-2018 |
Original |
- |
44.8 |
31.9 |
59.1 |
11.7 |
0.63 |
0.81 |
| Adjusted |
Mg, P, S |
32.6 |
52.4 |
8,2 |
0.70 |
| Zn-2017 |
Original |
- |
53.3 |
31.1 |
77.7 |
15.6 |
0.16 |
0.74 |
| Adjusted |
PC, Mg, P, S |
40.0 |
69.3 |
10.9 |
0.27 |
| Zn-2018 |
Original |
- |
41.8 |
23.9 |
76.3 |
19.1 |
0.42 |
0.67 |
| Adjusted |
PC, K, Mg, P, S |
26.4 |
62.0 |
13.1 |
0.39 |
| Toxic trace elements |
| Cd-2017 |
Original |
- |
0.044 |
0.019 |
0.117 |
35.8 |
0.66 |
0.75 |
| Adjusted |
YLD, PC, Mg, P, S |
0.024 |
0.099 |
27.7 |
0.57 |
| Cd-2018 |
Original |
- |
0.031 |
0.011 |
0.088 |
35.6 |
0.68 |
0.77 |
| Adjusted |
YLD, PC, Mg, P, S |
0.013 |
0.071 |
27.7 |
0.55 |
| Co-2017 |
Original |
- |
0.010 |
0.006 |
0.021 |
27.0 |
0.72 |
- |
| Co-2018 |
Original |
- |
0.009 |
0.006 |
0.017 |
17.1 |
0.27 |
- |
| Ni-2017 |
Original |
- |
0.212 |
0.113 |
0.356 |
23.6 |
0.44 |
0.94 |
| Adjusted |
Mg, P, S |
0.113 |
0.360 |
22.4 |
0.44 |
| Ni-2018 |
Original |
- |
0.148 |
0.078 |
0.312 |
26.6 |
0.57 |
0.85 |
| Adjusted |
YLD, PC, Mg, P, S |
0.075 |
0.224 |
22.6 |
0.47 |
| Trace elements |
| Mo-2017 |
Original |
- |
0.347 |
0.209 |
0.579 |
22.4 |
0.71 |
0.94 |
| Adjusted |
PC, P, S |
0.208 |
0.554 |
22.6 |
0.69 |
| Mo-2018 |
Original |
- |
0.308 |
0.195 |
0.592 |
24.0 |
0.78 |
0.91 |
| Adjusted |
K, Mg, P, S |
0.183 |
0.554 |
21.4 |
0.74 |
| Rb-2017 |
Original |
- |
4.35 |
2.29 |
6.75 |
21.7 |
0.25 |
- |
| Rb-2018 |
Original |
- |
3.51 |
2.20 |
5.34 |
18.9 |
0.25 |
- |
| Sr-2017 |
Original |
- |
2.09 |
0.914 |
3.627 |
30.3 |
0.81 |
0.91 |
| Adjusted |
YLD, PC, TKW |
0.909 |
3628 |
27.7 |
0.77 |
| Sr-2018 |
Original |
- |
2.42 |
1.175 |
4.307 |
27.2 |
0.75 |
0.82 |
| Adjusted |
YLD, PC, TKW |
1.366 |
4.053 |
22.2 |
0.63 |
The broad sense H2 was calculated for each year using original and adjusted values (Table 2). The adjustment slightly increased H2 for Mg and P and decreased for S and Cu, in both years. The average H2 across all elements was 0.59 for the original data and 0.58 for the adjusted data. The H2 calculated based on a factorial ANOVA was similar for K, Mg, P, Cu, Mn, Ni, and Mo for original and adjusted values. Slightly different H2 estimates were found for Ca (0.73 for the original data vs. 0.62 for the adjusted), S (0.81 vs. 0.62), Fe (0.58 vs. 0.47), Zn (0.27 vs. 0.37), Cd (0.76 vs. 0.67), and Sr (0.87 vs. 0.77).
4. Variation for Element Concentrations
Phosphorus had the highest concentration of all the elements in wheat grain, at 5180 and 4699 µg/g in 2017 and 2018, respectively (Table 2). The other macroelement concentrations (µg/g) in decreasing order were K (3642–3652), followed by S (2050–2059), Mg (1208–1225), and Ca (362–397). The variation between years was limited for K, S, and Mg, but exceeded 10% for P and Ca. The ranking of the macroelements for grain concentration coefficient of phenotypic variation, based on the original values, was Ca (14.4%), followed by K (12.9%), P (11.3%), S (9.5%), and Mg (8.8%). Among the microelements, Zn had the highest concentration (µg/g) in the grain (48.8–53.3 over the two years), followed by Mn (43.1–44.8), Fe (35.8–37.7), and Cu (3.72–4.66). The ranking of the microelements for grain concentration coefficient of phenotypic variation, based on the original values, was Zn (17.3%) followed by Cu (14.5%), Fe (13.6%), and Mn (11.5%).
Among the three toxic trace elements, Ni had the highest concentrations, at 0.212 and 0.148 µg/g in 2017 and 2018, respectively. Ni was also a highly variable element, both within and between years, with CV exceeding 23.6%. Cd and Co had only low concentrations (<0.044 µg/g) that were highly variable (CV 17.1–35.8%). The three remaining trace elements (Mo, Rb, and Sr) were also characterized by low concentrations (0.31–4.35 µg/g) and high variability (CV 18.9–30.3%).
5. Elements’ Suitability for Genetic Enhancement
The progress for wheat genetic enhancement to increase or decrease the concentration of a certain element depends on several factors: the degree of phenotypic variation within the germplasm, the share of the genetic component in this variation, as well as the dependence of the element concentration on other traits. Table 3 summarizes three main criteria characterizing suitability of elements for genetic enhancement. The coefficient of phenotypic variation varied from 8.8% (Mg) to 35.7% (Cd). It is assumed that higher variation provides the opportunity for selection. Therefore, the element with the highest variation was ranked 1 and the lowest, 15. H2 calculated based on a factorial ANOVA (genotype x year) of the original data varied from 0.27 (Zn) to 0.87 (Sr). Similar to CV, the highest value of H2 was ranked 1 and the lowest, 15. The ideal breeding trait may have a variation independent of other traits.
Table 3. Parameters characterizing elements’ suitability for genetic enhancement.
| Element |
Coefficient of Phenotypic Variation for 2017–2018 Means |
Number of Significant Correlations with Agronomic Traits and Other Elements |
H2 Based on ANOVA of Original Data |
Overall Sum of Ranks |
| % |
Rank |
Value |
Rank |
Value |
Rank |
Value |
Rank |
| Ca |
14.5 |
9 |
1 |
3.5 |
0.73 |
5 |
17.5 |
4 |
| K |
13.0 |
11 |
1 |
3.5 |
0.61 |
8 |
22.5 |
7 |
| Mg |
8.8 |
15 |
8 |
9.5 |
0.67 |
6 |
30.5 |
12 |
| P |
11.3 |
13 |
9 |
12.5 |
0.60 |
10 |
34.5 |
14 |
| S |
9.6 |
14 |
9 |
12.5 |
0.81 |
3 |
28.5 |
11 |
| Cu |
14.6 |
8 |
10 |
11 |
0.61 |
9 |
28.0 |
10 |
| Fe |
13.6 |
10 |
2 |
5 |
0.58 |
11 |
26.0 |
9 |
| Mn |
11.5 |
12 |
7 |
7 |
0.55 |
12 |
31.0 |
13 |
| Zn |
17.4 |
7 |
10 |
14 |
0.27 |
15 |
36.0 |
15 |
| Cd |
35.7 |
1 |
10 |
14 |
0.76 |
4 |
19.0 |
5 |
| Co |
22.1 |
5 |
0 |
1.5 |
0.65 |
7 |
13.5 |
3 |
| Ni |
25.1 |
3 |
8 |
9.5 |
0.49 |
13 |
25.5 |
8 |
| Mo |
23.2 |
4 |
7 |
7 |
0.84 |
2 |
13.0 |
2 |
| Rb |
20.3 |
6 |
0 |
1.5 |
0.48 |
14 |
21.5 |
6 |
| Sr |
28.8 |
2 |
7 |
7 |
0.87 |
1 |
10.0 |
1 |
For each element, Table 3 provides the number of significant correlation coefficients with three agronomic traits (grain yield, protein content, and TKW) and macroelements, based on the data in Table 1. The concentrations of Co and Rb did not correlate with any trait or element. They were ranked the highest (rank 1.5), while Cu, Zn, and Cd had 10 significant correlations, being ranked the lowest (rank 14). The last column in Table 3 presents the sum of three ranks, which were again ranked from lowest (better suited for genetic enhancement) to highest. Three trace elements (Sr, Mo, and Co) were the highest ranked, representing breeding traits that are relatively easy to improve through breeding. These were followed by Ca, Cd, Rb, and K. The important biofortification elements Fe and Cu were ranked 9 and 10, respectively. Mn and Zn were among the lowest ranked, representing traits that are difficult to improve genetically.
6. Genetic Resources Characterization for Grain Ionome
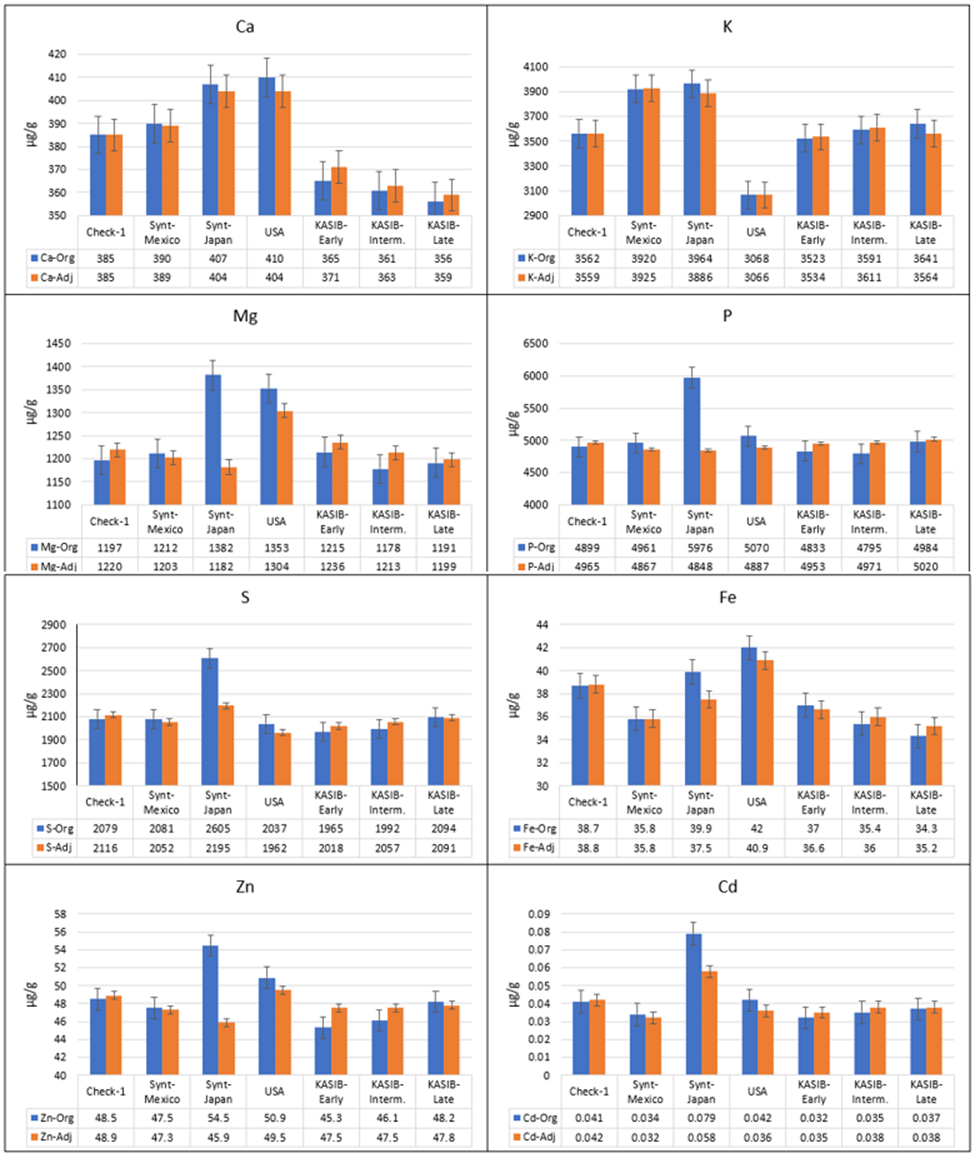
The original and adjusted average concentrations across 2017 and 2018 for different groups of genetic resources for the macroelements Fe, Zn, and Cd, are presented in Figure 2. There is a clear difference between the original and adjusted values. For Mg, P, S, and Zn, the Japanese synthetics were clearly superior when the original data were used. However, the adjusted means demonstrated different performance, comparable to other groups of genetic resources.
Figure 2. Average grain element concentrations for the genetic resource groups across 2017 and 2018 (blue, original values, and orange, adjusted values), bars represent standard error.
Taking into account the adjusted values, the CIMMYT and Japanese synthetics had significantly higher concentrations of K (9.2–10.1% higher) and Sr (9.4–16.4% higher), compared to local Check-1 (Pamyati Azieva). The Japanese synthetics also had the highest concentrations of Ca (4.9% higher, compared to local Check-1), S (3.7%), Cd (38.1%), and Mo (4.7%). The US cultivars had concentrations of Ca as high as the Japanese synthetics, and the highest concentrations of Mg (6.9% higher than Check-1) and Fe (5.4% higher). This group was also characterized by low concentrations of K (13.8% lower, compared to Check-1) and Mo 11.8% lower. The KASIB germplasm had near-average values for most elements. However, there were differences between the early, intermediate, and late maturity groups. For Mg and Fe, there were decreasing concentrations from early to intermediate to late material of 1.5–2%. For S and Zn, concentrations increased in the later-maturing germplasm, also by 1.5–2%.
7. Superior Germplasm
All of the germplasm was ranked for concentration of each element, based on mean adjusted values for 2017–2018. Superior genotype performance was defined as being in the top 15 entries, based on the highest concentration of macro- and microelements. For the trace elements, including toxic metals, favorable performance was considered as being in the bottom 15 entries, based on the lowest concentrations. The germplasm was also ranked for grain yield and protein content. Table 4 presents the 10 highest-yielding genotypes and 20 entries with favorable concentrations for at least three elements. The five highest-yielding genotypes had high concentrations of Ca, including cv. Silach, with a high concentration of Mg and low Rb; Element 22, with high concentrations of P and S, but low Ni; and breeding line Lutestsens 1296, with high K and low Cd concentrations. The second-highest yielding genotype Lutestsens 15-14 was characterized by high concentrations of the essential microelements Mn and Zn. As expected, all top-yielding genotypes belonged to the KASIB group of germplasm.
Table 4. Genotypes with the highest grain yield, highest concentrations of macro- and microelements, and lowest concentrations of trace elements.
| Entry |
Genotype |
Group * |
Highest/Lowest Elements |
Grain Yield |
Protein Content |
| g/m2 |
Rank |
% |
Rank |
| - |
Pamyati Azieva (Check-1) |
|
- |
399 |
- |
16.5 |
- |
| - |
Serebristaya (Check-2) |
|
- |
471 |
- |
14.9 |
- |
| 151 |
Lutestsens KS 963 |
K-E |
Ca, Mg |
572 |
1 |
17.2 |
66 |
| 112 |
Lutestsens 15-14 |
K-L |
Mn, Zn |
557 |
2 |
16.5 |
101 |
| 91 |
Lutestsens 7-04-4 |
K-I |
- |
541 |
3 |
17.5 |
54 |
| 164 |
Silach |
K-L |
Ca, Mg, Rb |
541 |
4 |
16.7 |
95 |
| 94 |
Element 22 |
K-L |
Ca, P, S, Ni |
535 |
5 |
17.0 |
75 |
| 152 |
Lutestsens 1296 |
K-I |
Ca, K, Cd |
521 |
6 |
15.6 |
125 |
| 157 |
OmGAU-100 |
K-L |
Ca, P, Cu |
518 |
7 |
16.4 |
103 |
| 116 |
Uralosibirskaya |
K-I |
- |
515 |
8 |
17.6 |
52 |
| 85 |
Lutescens 310-00-1 |
K-I |
P, Rb |
514 |
9 |
17.5 |
54 |
| 89 |
Aestivum 947 |
K-I |
Ni |
514 |
10 |
15.8 |
119 |
| 156 |
Novosibirskaya 41 |
K-E |
P, Cu, Cd, Ni |
482 |
23 |
19.0 |
16 |
| 143 |
Lutestsens 1103 |
K-I |
Ca, Mg, Mn, Ni, Mo |
469 |
30 |
16.1 |
111 |
| 125 |
Stepnaya 253 |
K-I |
Ca, Fe, Zn |
468 |
31 |
14.1 |
133 |
| 114 |
OmGAU-90 |
K-I |
Ca, Mg, S |
466 |
33 |
15.7 |
121 |
| 132 |
Lutestsens 248-01 |
K-I |
Mn, Zn, Mo, Sr |
394 |
58 |
15.9 |
117 |
| 66 |
RBOT |
USA |
Cu, Fe, Rb |
386 |
63 |
18.4 |
28 |
| 87 |
L 485 |
K-E |
Ca, P, Mn |
378 |
66 |
17.0 |
73 |
| 103 |
Lutestsens 15-12 |
K-I |
Cu, Co, Ni |
372 |
71 |
17.6 |
51 |
| 73 |
Freyr |
USA |
Mg, Zn, Ni, Mo, Rb |
354 |
75 |
19.0 |
15 |
| 61 |
Pandur/Ae. Squarrosa(409) |
S-M |
K, S, Cu, Co |
330 |
79 |
17.4 |
57 |
| 78 |
Alpine |
USA |
Mg, Fe, Zn, Rb |
321 |
81 |
17.9 |
43 |
| 13 |
Ukr-Od 1530.94/Ae. Squarrosa(392) |
S-M |
Fe, Mn, Sr |
313 |
82 |
17.2 |
71 |
| 77 |
Brennan |
USA |
Mg, Fe, Mn |
297 |
87 |
18.7 |
19 |
| 36 |
Aisberg/Ae. Squarrosa (369)//Demir |
S-M |
Cu, Zn, Cd, Co, Mo |
273 |
94 |
16.3 |
107 |
| 3 |
Ukr-Od 952.92/Ae. Squarrosa(1031) |
S-M |
Cd, Co, Rb |
255 |
100 |
17.0 |
76 |
| 12 |
Aisberg/Ae. Squarrosa(511) |
S-M |
Ca, S, Cu, Mo |
245 |
103 |
16.8 |
87 |
| 6 |
Ukr-Od 1530.94/Ae. Squarrosa(458) |
S-M |
P, Cd, Co |
213 |
115 |
17.7 |
47 |
| 57 |
Ukr-Od 1530.94/Ae. Squarrosa(392) |
S-M |
K, P, S, Zn, Cd, Mo |
209 |
116 |
18.2 |
34 |
| 16 |
Ukr-Od 1530.94/Ae. Squarrosa(458) |
S-M |
Ca, Cd, Rb |
206 |
118 |
17.2 |
69 |
| 22 |
Langdon/IG 48042 |
S-J |
Ca, S, Fe |
141 |
125 |
20.7 |
6 |
| 51 |
Langdon/IG 131606 |
S-J |
Ca, Co, Ni |
97 |
130 |
20.6 |
7 |
| |
LSD 0.05 |
|
|
15 |
- |
0.3 |
- |
The genotype with favorable concentrations of six elements was Ukr-Od 1530.94/Aegilops squarrosa(392) (high K, P, S, and Zn, and low Cd and Mo). Superior performance for five elements was found for Lutestsens 1103 (Ca, Mg, Mn, Ni, and Mo), Freyr, USA (Mg, Zn, Ni, Mo, and Rb), and Aisberg/Ae. squarrosa(369)//Demir (Cu, Zn, Cd, Co, and Mo). High Fe and Zn were found for cvs Stepnaya 253 and Alpine. Several genotypes demonstrated low concentrations of at least two trace elements: Novosibirskaya 41 (Cd and Ni), Lutestsens 1103 (Ni and Mo), Lutestsens 248-01 (Mo and Sr), Lutestsens 15-12 and Langdon/IG 131606 (Co and Ni), Freyr (Ni, Mo, and Rb), Aisberg/Ae. squarrosa(369)//Demir and Ukr-Od 952.92/Ae. squarrosa(1031) (Cd, Co, and Rb), Ukr-Od 1530.94/Ae. squarrosa(458) (Cd and Co), Ukr-Od 1530.94/Ae. squarrosa(392) (Cd and Mo), and Ukr-Od 1530.94/Ae. squarrosa(458) (Cd and Rb). Overall, there was a diversity of germplasm with high macro- and microelement concentrations and low trace element concentrations within the material studied. The superior genotypes were found in all groups of material, including KASIB, US cultivars, and primary synthetics.
This entry is adapted from the peer-reviewed paper 10.3390/plants11020149