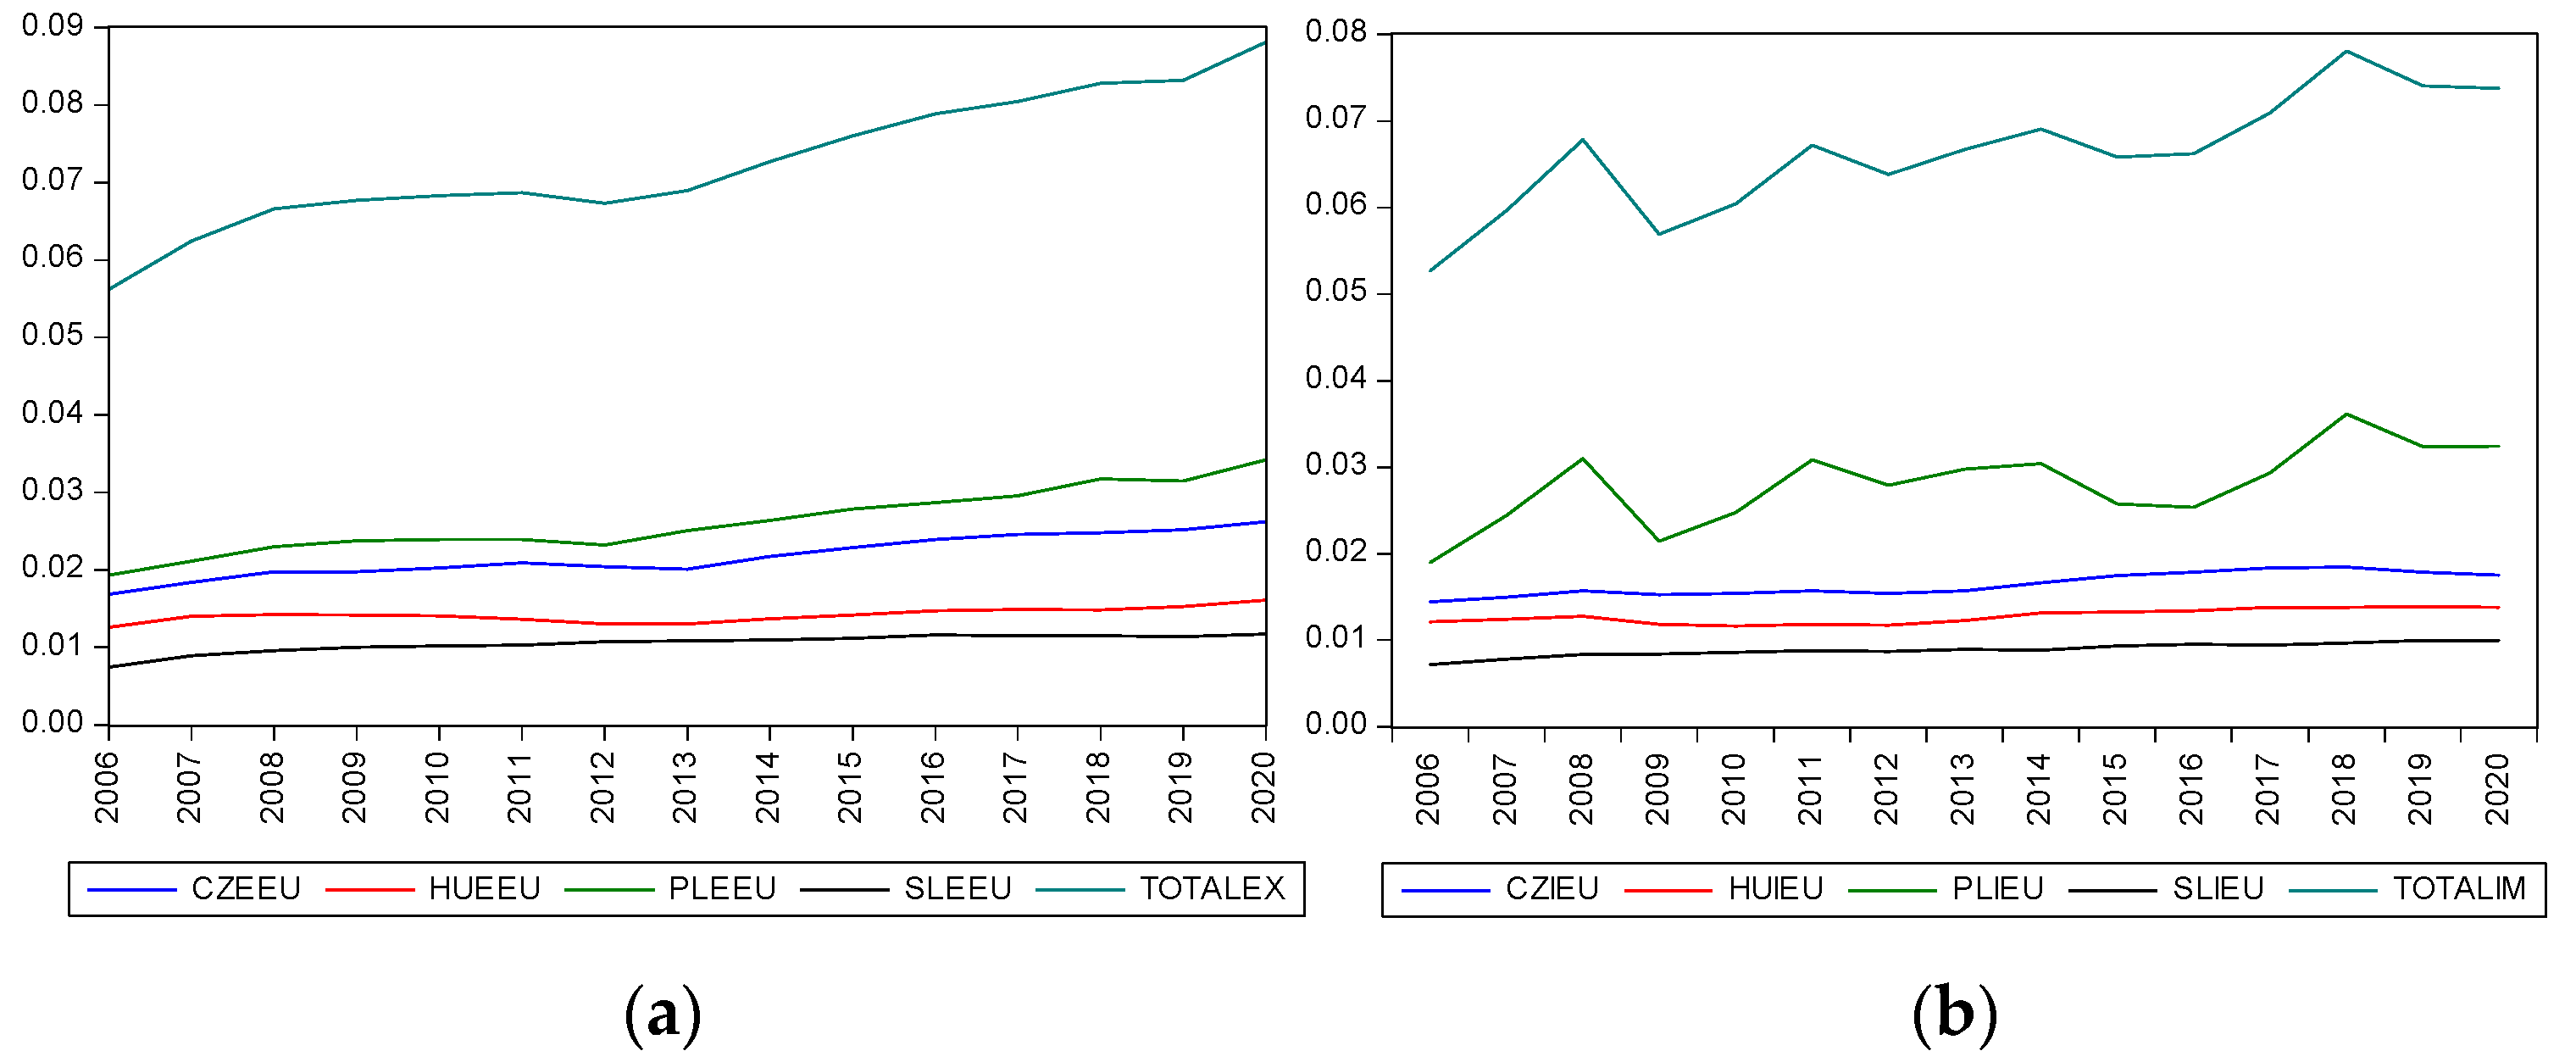
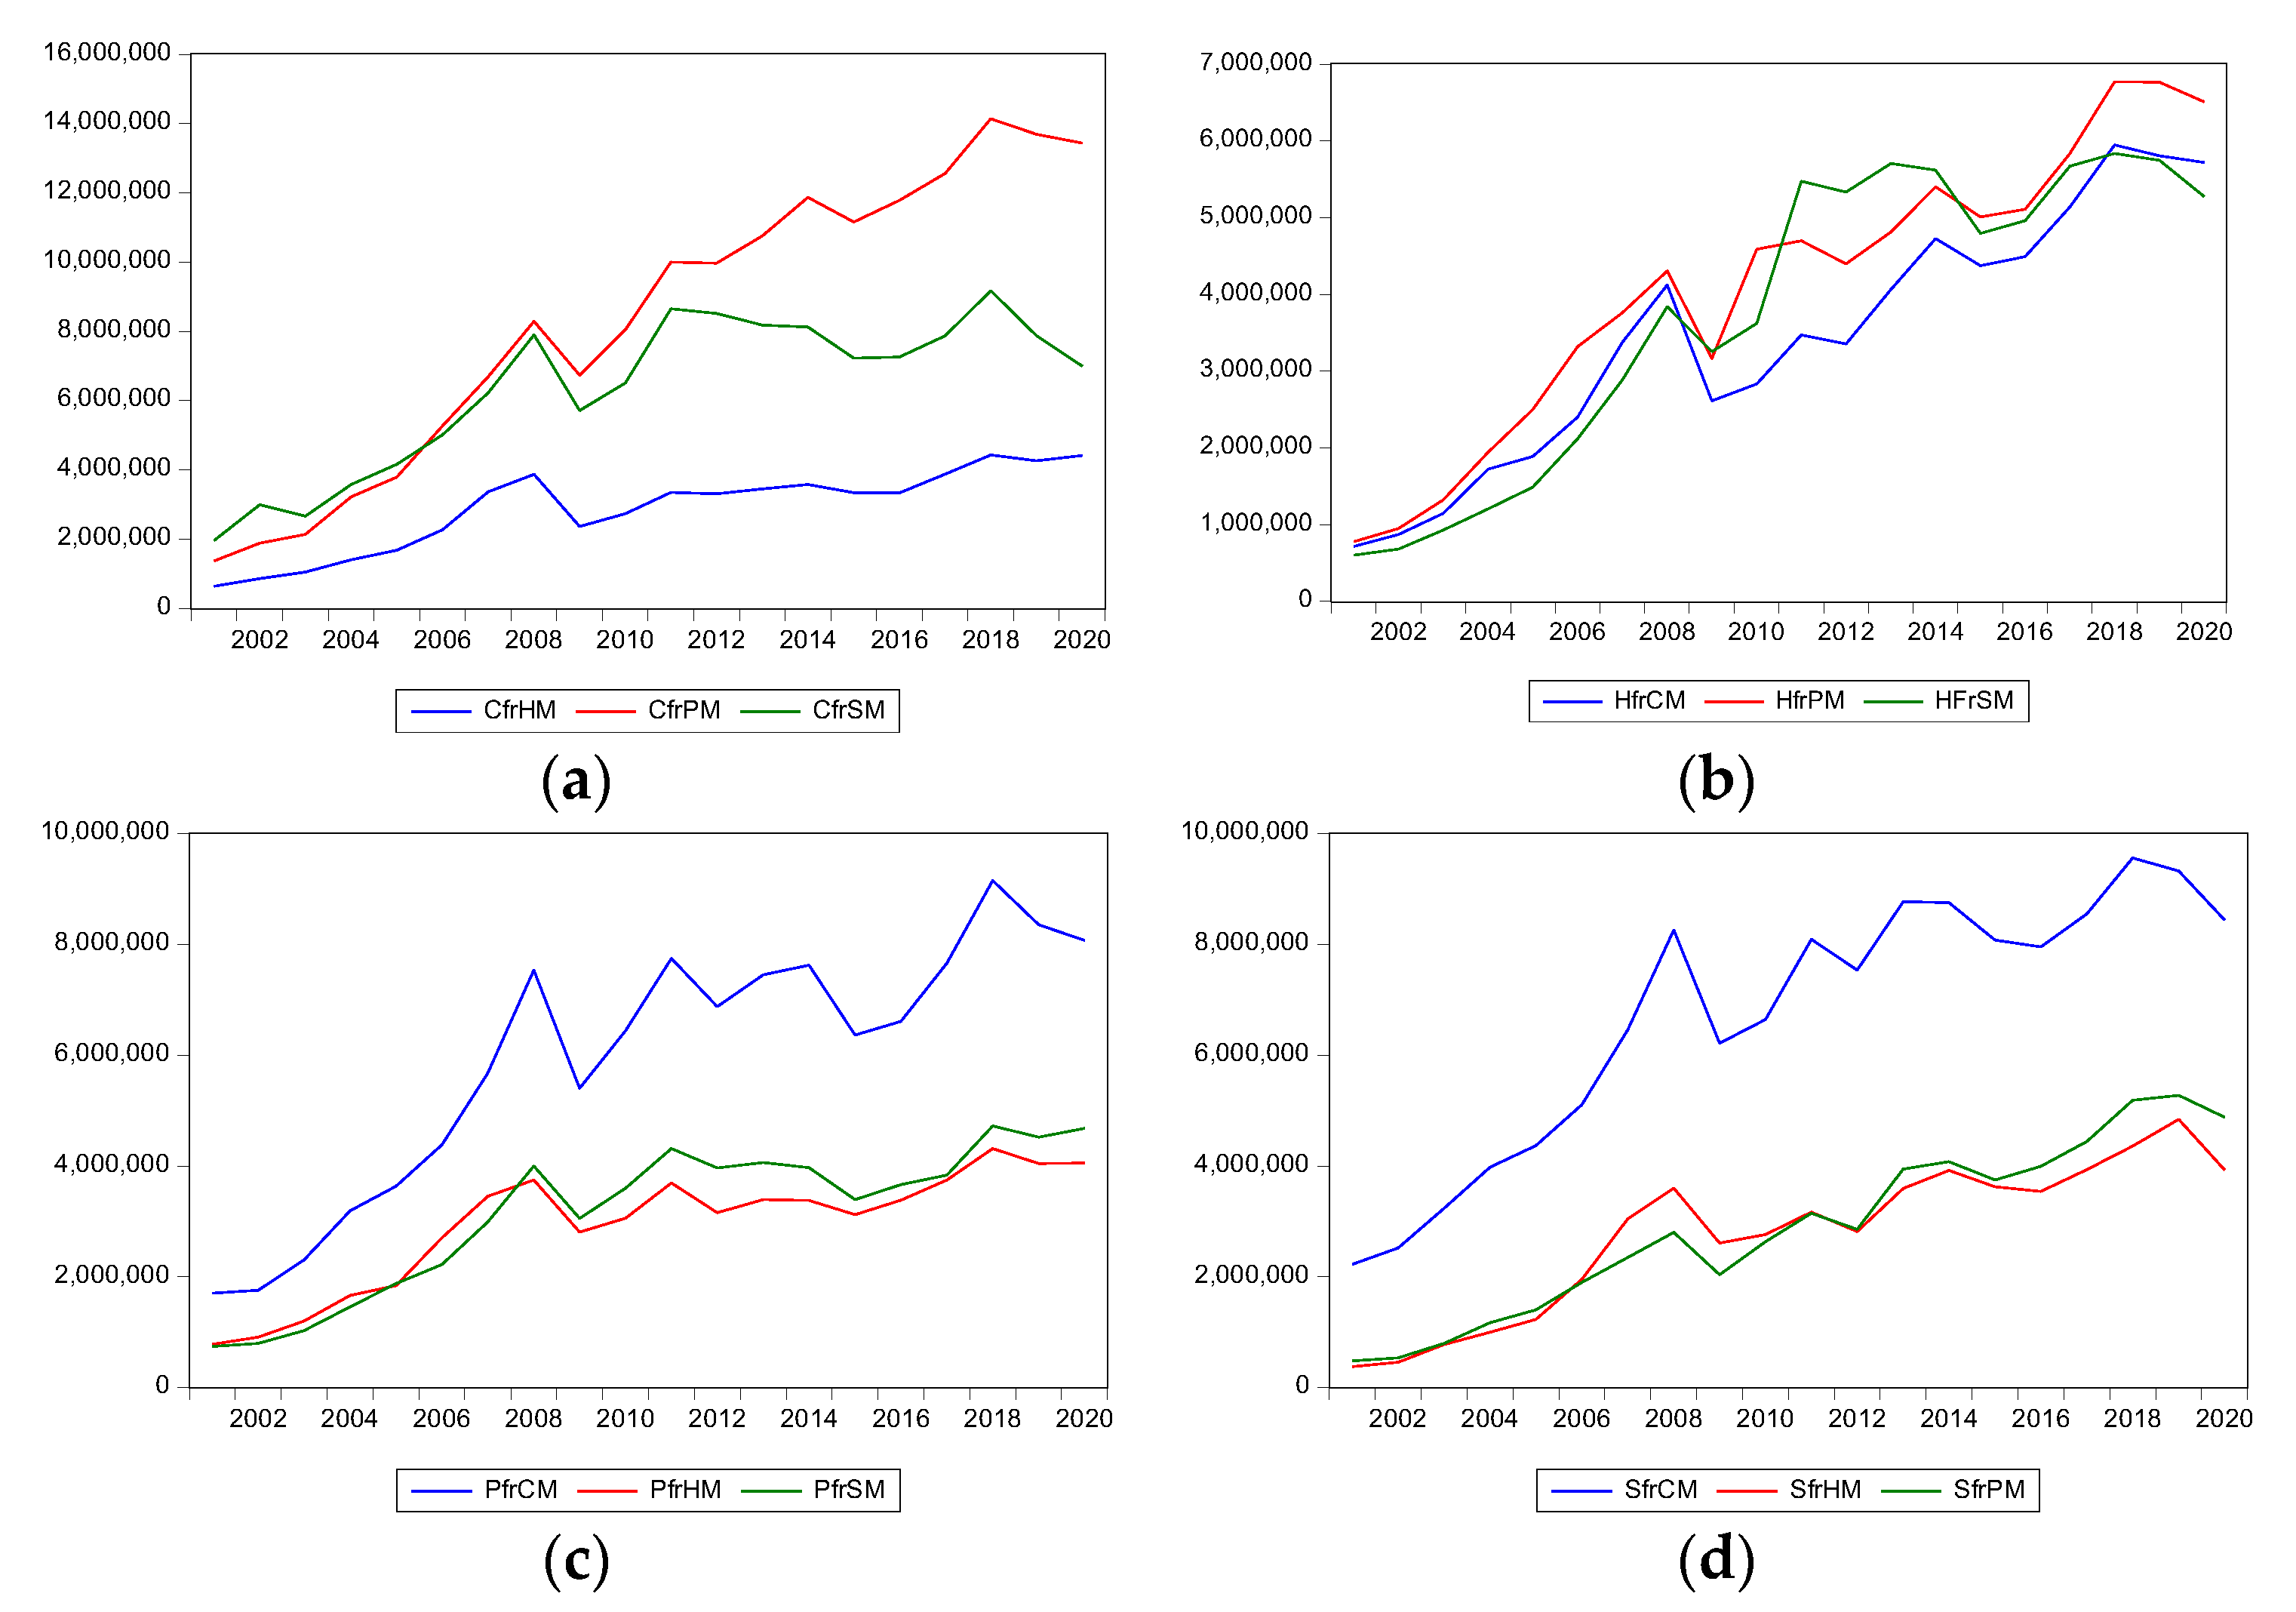
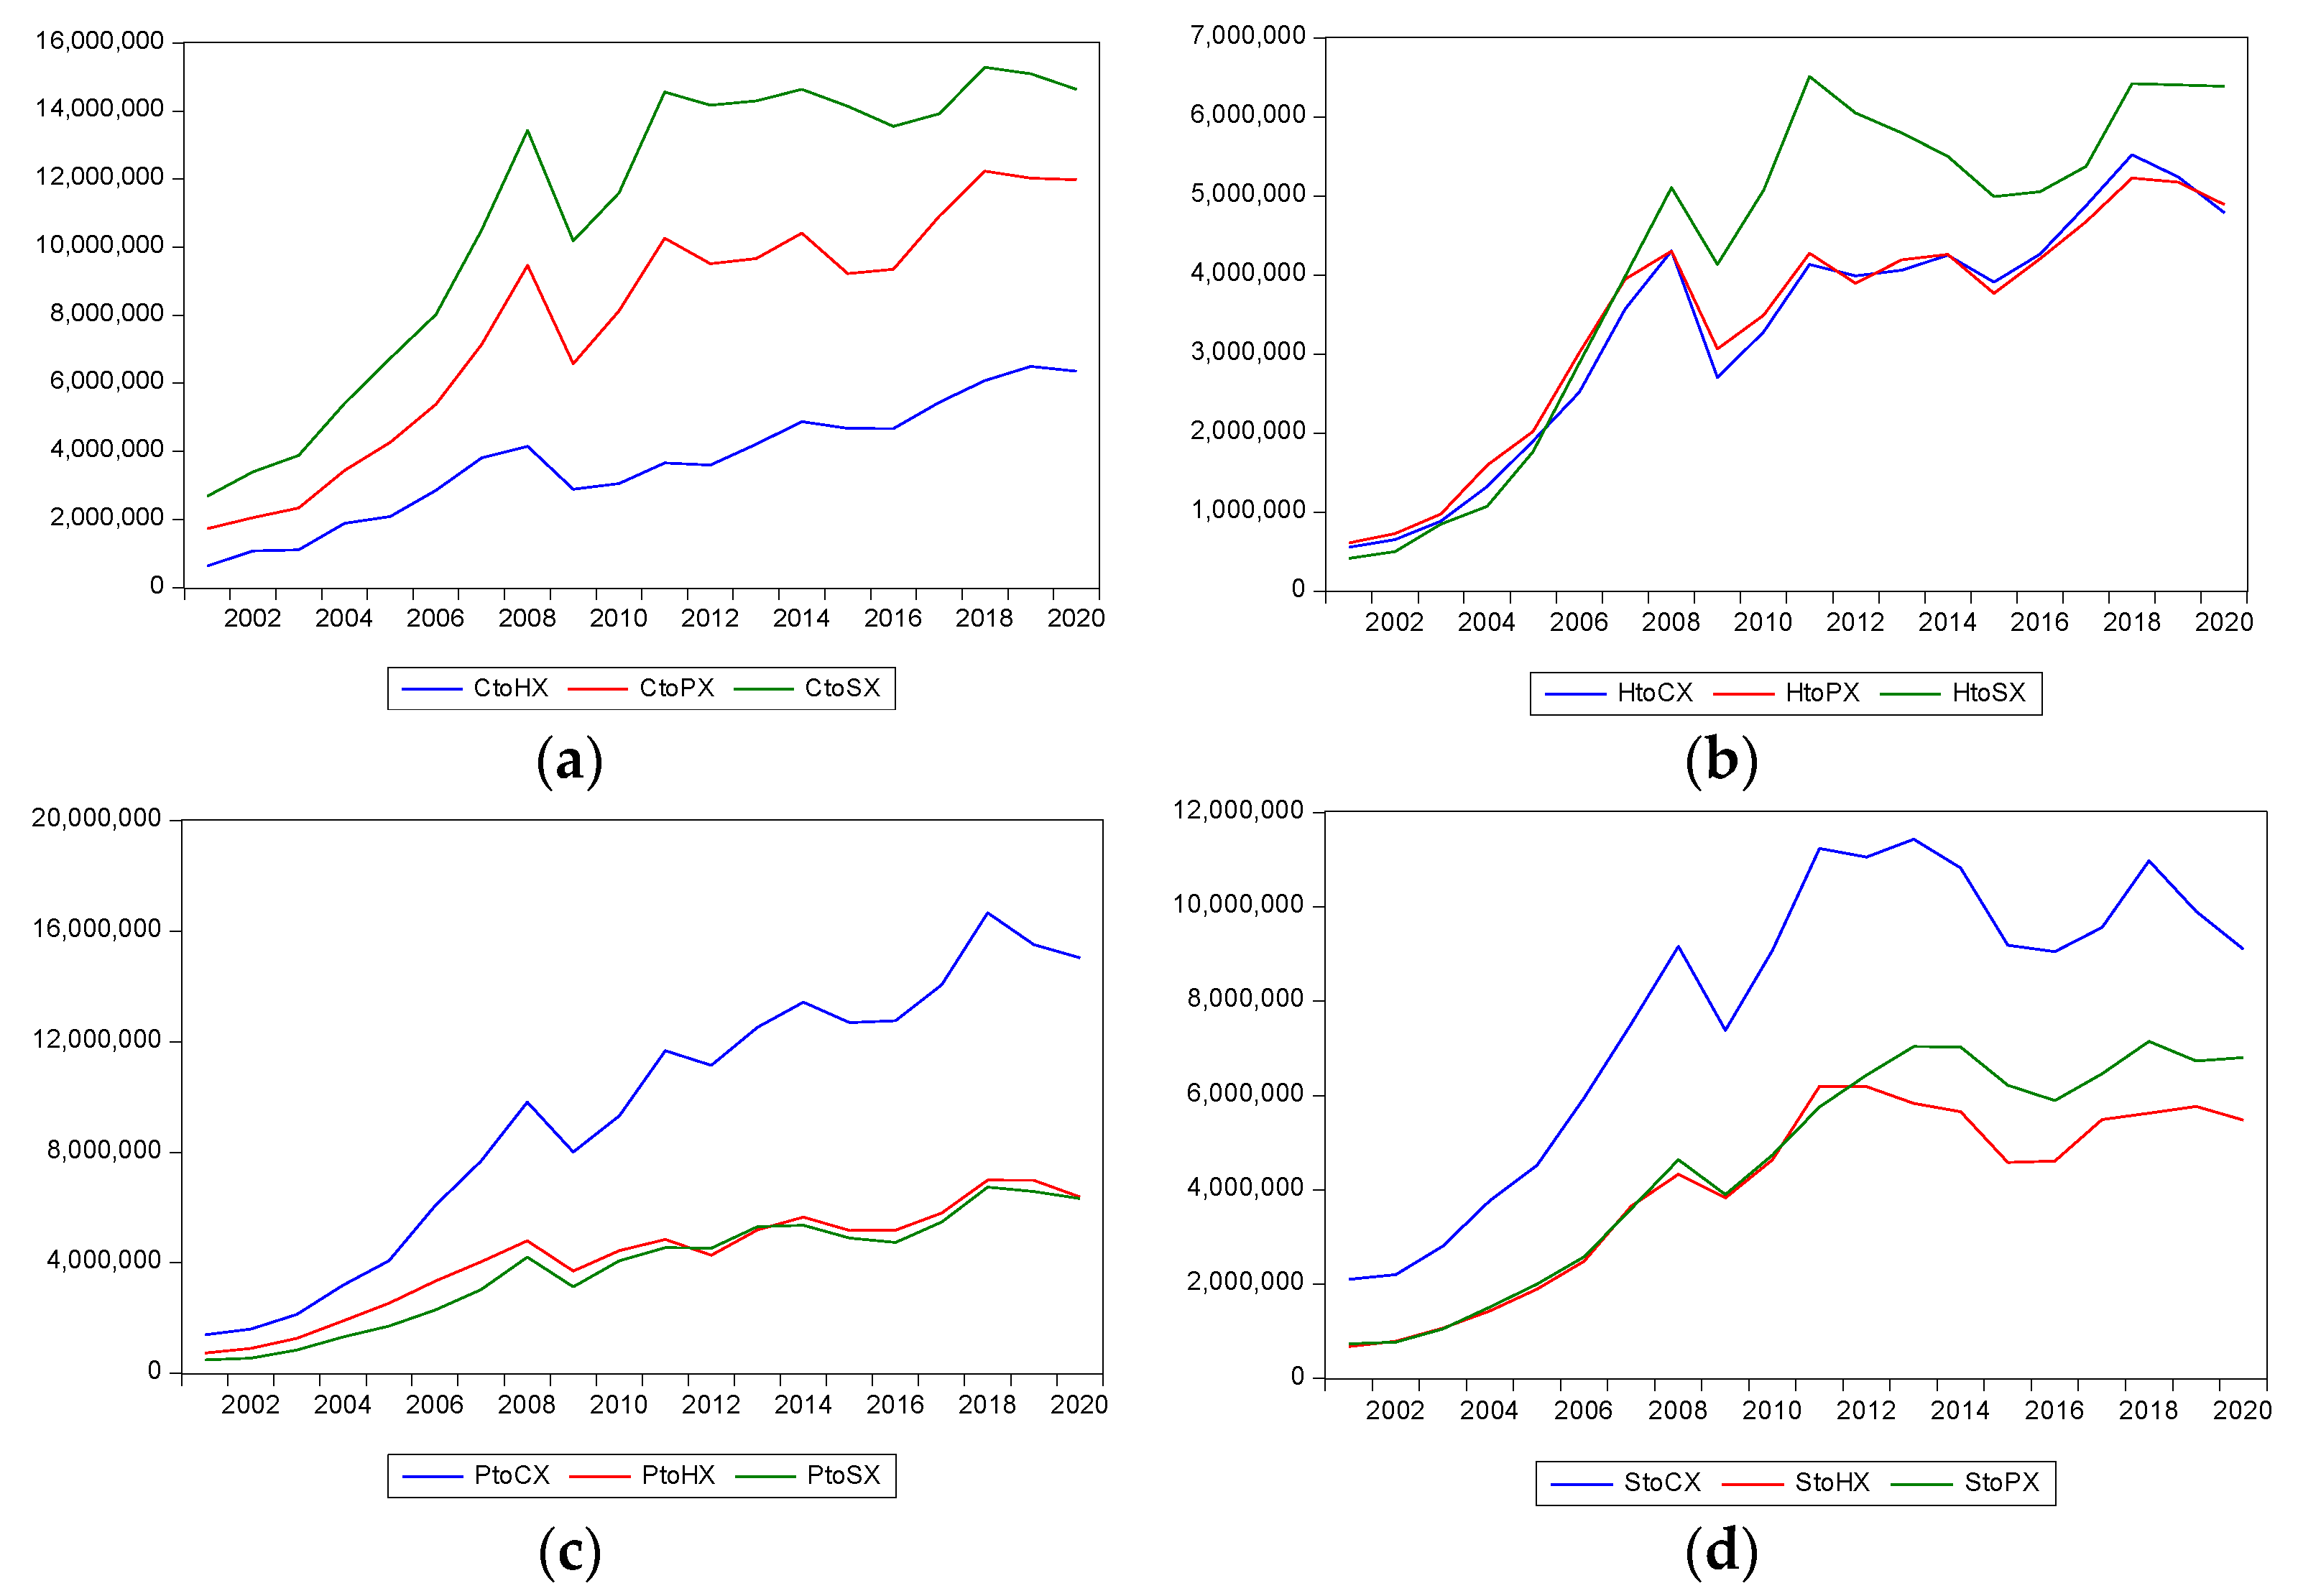
The impact of the COVID-19 pandemic has been detrimental to all countries, despite the continuous efforts of governments on all continents to attempt to mitigate its damaging effects. All economic and social indicators have worsened. COVID-19 impact was evident in all countries, but not with the same strength. Looking outside the V4 group, we can also see that there are strong trade relations with Germany, which is the strongest European economy.
- COVID-19
- international trade
- Visegrad Countriesimport
- export
- lockdowns
- real exchane rate
- GDP
1. International Trade in the V4
2. Impact of COVID-19
3. Trade among V4 Countries


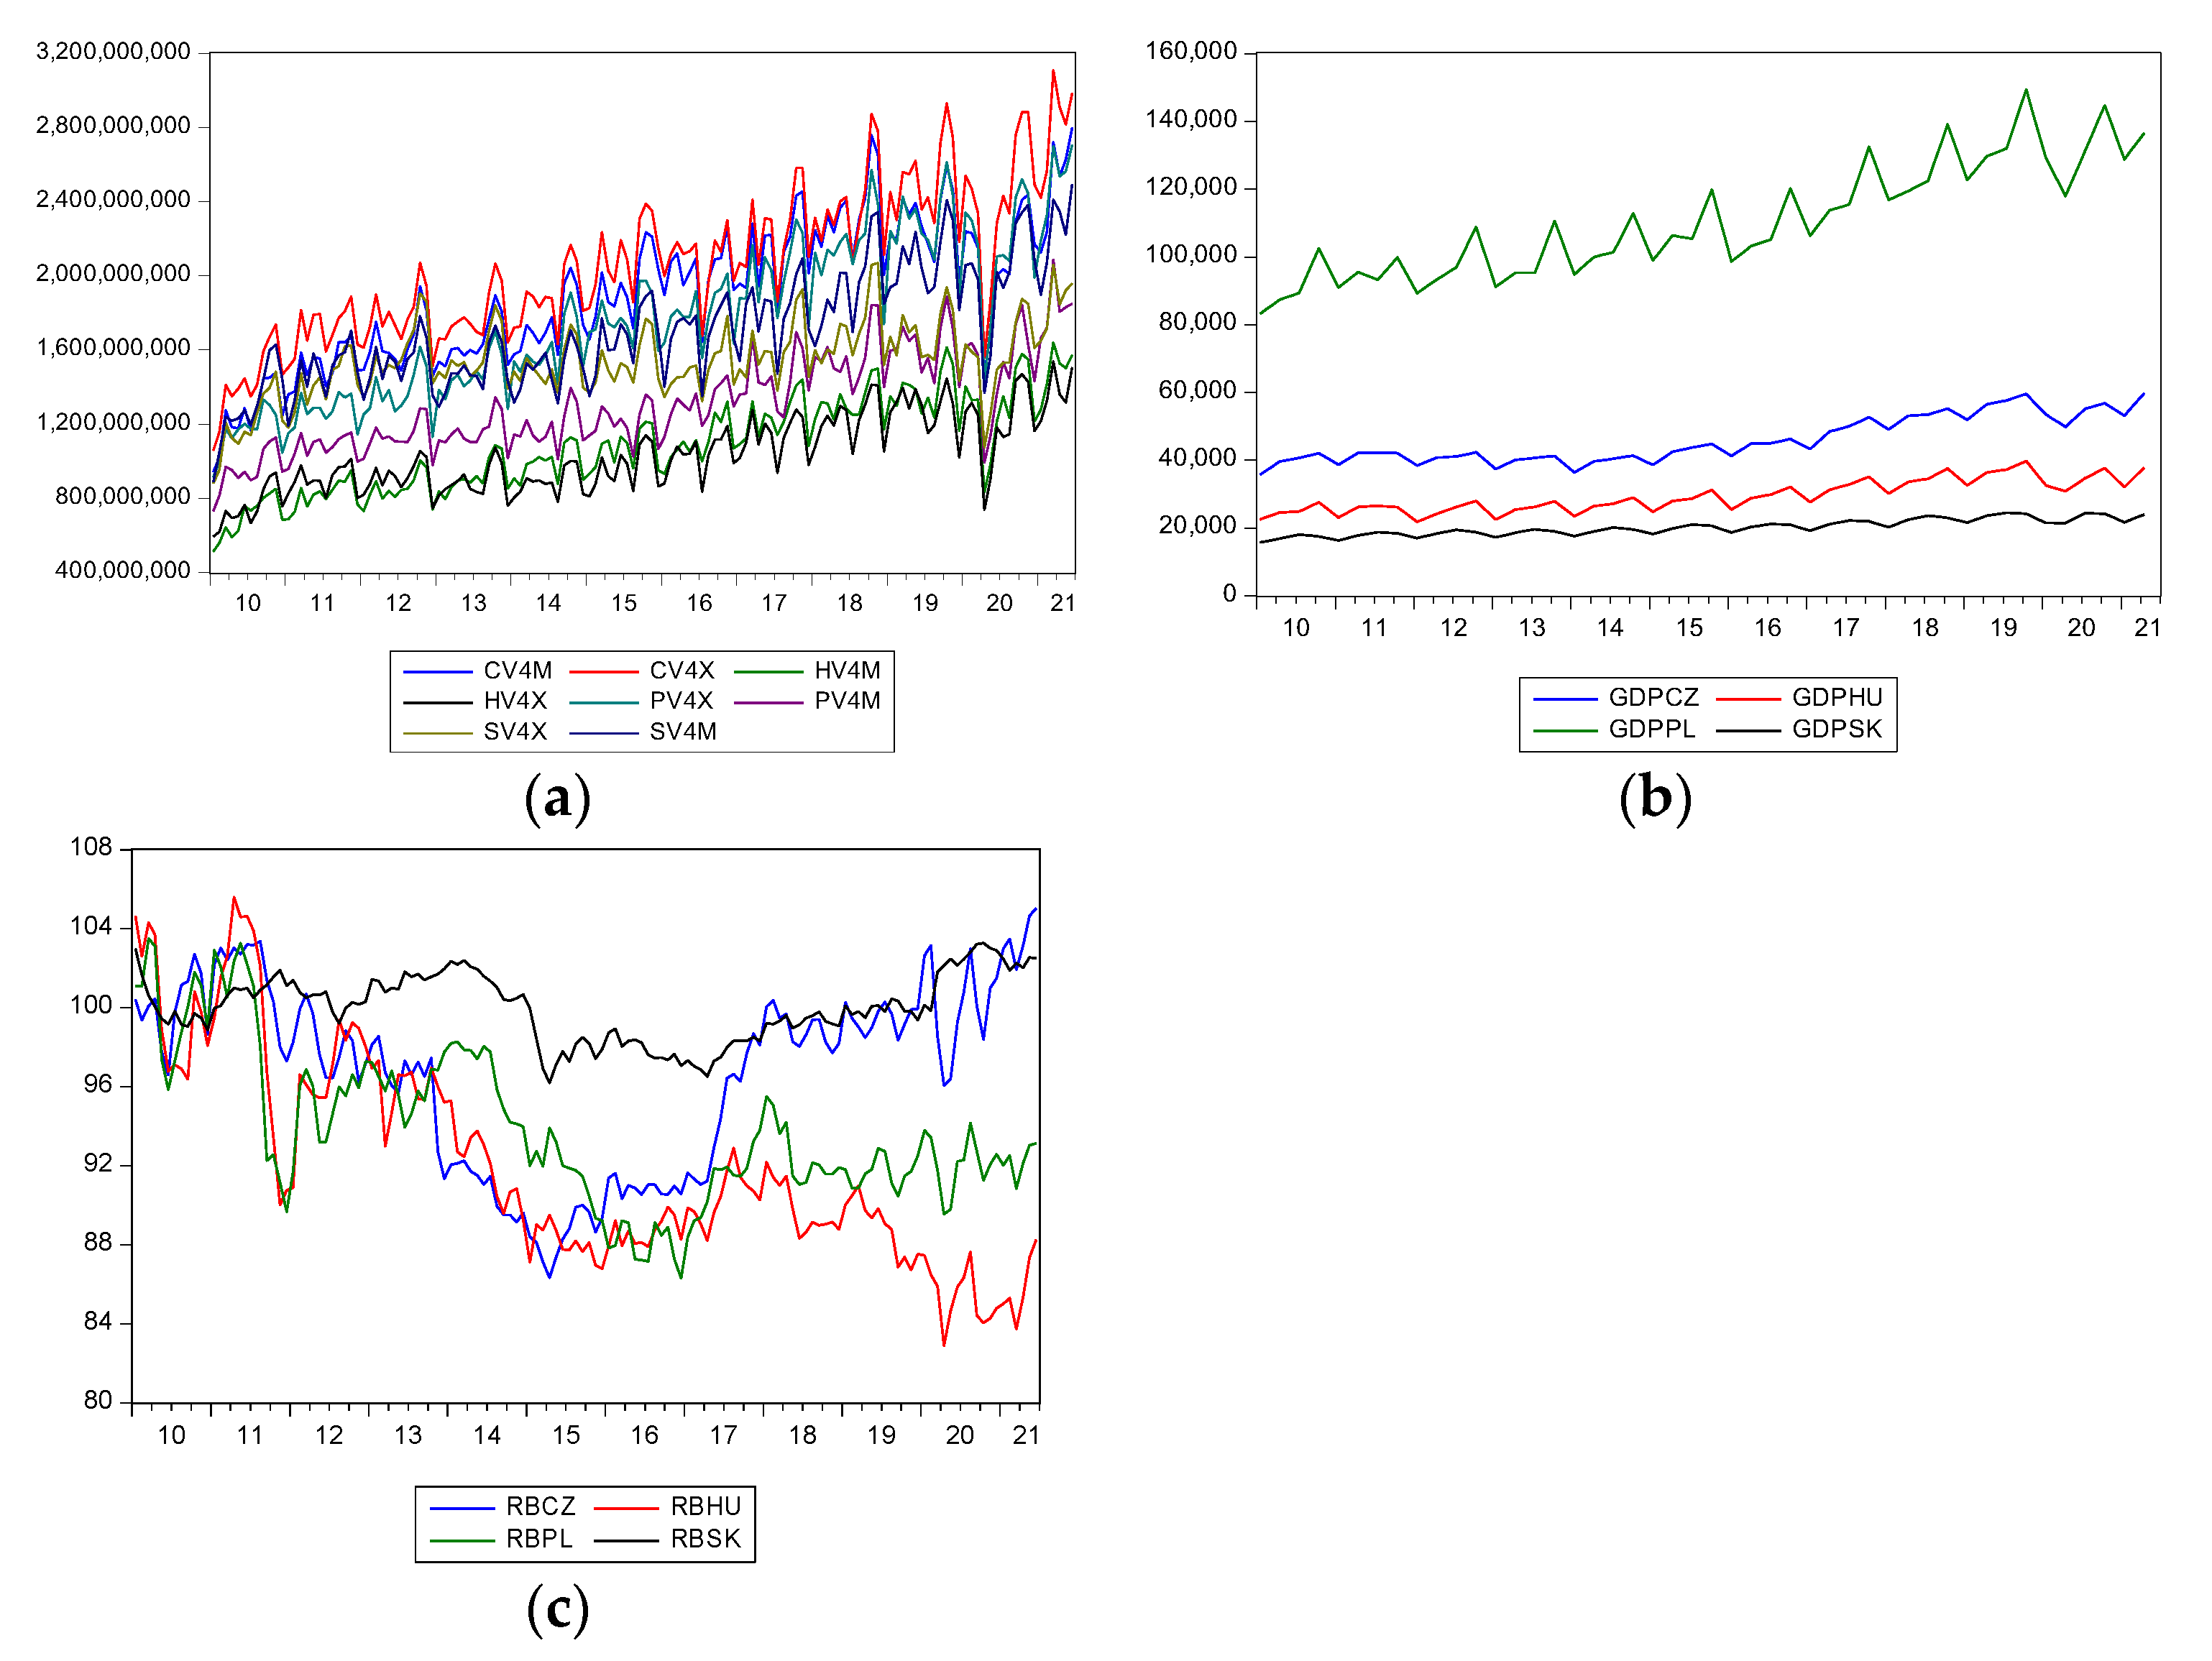
 Figure 4.Development of imports, exports, GDP, and real exchange rates of the V4 countries from 2010 to 2021.(a) Imports and exports; (b) GDP; (c) real exchange rates.
This entry is adapted from the peer-reviewed paper 10.3390/jrfm15020041
References
- Svatoš, Miroslav, and Lubos Smutka. 2010. Development of agricultural foreign trade in the countries of Central Europe. Agricultural Economics 56: 163–75.
- Svatoš, Miroslav, and Lubos Smutka. 2012a. Development of agricultural trade and competitiveness of the commodity structures of individual countries of the Visegrad Group. Agricultural Economics 58: 222–38.
- Svatoš, Miroslav, and Lubos Smutka. 2012b. Development of agricultural trade of Visegrad group countries in relation to EU and third countries. AGRIS Online Papers in Economics and Informatics 4: 55–69.
- Svatoš, Miroslav, Lubos Smutka, and Ondřej Miffek. 2010. Competitiveness of agrarian trade of EU-15 countries in comparison with new EU member states. Agricultural Economics 56: 569–82.
- Vološin, Josef, Lubos Smutka, and Richard Selby. 2011. Analysis of external and internal influences on CR agrarian foreign trade. Agricultural Economics 57: 422–35.
- Babunek, Ondřej. 2012. Foreign direct investment in Visegrad four and the main trading partners. Statistika-Statistics and Economy Journal 49: 14–26.
- Richter, Sandor. 2012. Changes in the Structure of Intra-Visegrad Trade after the Visegrad Countries’ Accession to the European Union (No. 5). Wiiw Statistical Report. Vienna: The Vienna Institute for International Economic Studies (wiiw).
- Ugurlu, Erginbay, and Irena Jindrichovska. 2019. Estimating gravity model in the Czech Republic: An empirical study of impact of IFRS on Czech international trade. European Research Studies Journal 22: 265–81.
- Kowalska, Anna, Klaudia Gurkowa, Anna Olszańka, Ivan Soukal, and Martin Matejicek. 2021. Assessment of the Competitive Position of the V4 Group Countries in the Foreign Trade of Agri-food Industry Products. In Proceedings of the International Scientific Conference Hradec Economic Days 2021. Edited by Maci Jan. Hradec Kralove: University of Hradec Kralove, vol. 11, pp. 449–70. ISBN 9788074358227.
- Smutka, Lubos, Miroslav Svatoš, Karel Tomšík, and Olga Ivanovna Sergienko. 2016. Foreign trade in agricultural products in the Czech Republic. Agricultural Economics 62: 9–25.
- Smutka, Lubos, Mansoor Maitah, and Miroslav Svatoš. 2018. Changes in the Czech agrarian foreign trade competitiveness—Different groups of partners’ specifics. Agricultural Economics 64: 399–411.
- International Monetary Fund (IMF). 2021. Policy Responses to COVID-19. Available online: https://www.imf.org/en/Topics/imf-and-covid19/Policy-Responsesto-COVID-19 (accessed on 19 November 2021).
- Cvik, Eva Daniela, and Radka MacGregor Pelikánová. 2021. The significance of CSR during COVID-19 Pandemic in the Luxury Fashion Industry—A Front-Line Case Study. European Journal of Business Science and Technology 7: 109–29.
- Jindřichovská, Irena, and Erginbay Uğurlu. 2021. EU and China trends in trade in challenging times. Journal of Risk and Financial Management 14: 71.
- MacGregor Pelikánová, Radka, and Martin Hála. 2021. CSR Unconscious Consumption by Generation Z in the COVID-19 era—Responsible Hereticsnot Paying CSR Bonus? Journal of Risk and Financial Management 14: 390.
- Czech, Katarzyna, Michael Wielechowski, Pavel Kotyza, Irena Benešová, and Adriana Laputková. 2020. Shaking stability: COVID-19 impact on the Visegrad Group countries’ financial markets. Sustainability 12: 6282.
- Salamaga, Marcin. 2021. The use of Correspondence Analysis in the study of Foreign Divestment in the Visegrad Countries during the Coronavirus Crisis. Econometrics 25: 15–26.
- Lacka, Irena, Janusz Myszczyszyn, Sylwia Golab, Beata Bedzik, and Blazej Supron. 2020. Correlation between the Level of Economic Growth and foreign trade: The Case of the V4 Countries. European Research Studies Journal XXIII: 657–78.
- Astrov, Vasily, and Mario Holzner. 2021. The Visegrad Countries: Coronavirus Pandemic, EU Transfers, and Their Impact on Austria, Policy Notes and Reports, No. 43. Vienna: The Vienna Institute for International Economic Studies.
- Hayakawa, Kazunobu, and Hiroshi Mukunoki. 2021. Impacts of COVID-19 on Global Value Chains. The Developing Economies 59: 154–77.
- Erokhin, Vasilii, and Tianming Gao. 2020. Impacts of COVID-19 on Trade and Economic Aspects of Food Security: Evidence from 45 Developing Countries. International Journal of Environmental Research and Public Health 17: 5775.
- Espitia, Alvaro, Aaditya Mattoo, Nadia Rocha, Michele Ruta, and Deborah Winkler. 2021. Pandemic trade: COVID-19, remote work and global value chains. The World Economy, 1–29.
