Repeated actions and behaviours are characteristic of people’s daily lives. However, there is a dilemma when this repeated action is associated with mobile phone recycling since convincing mobile users to recycle sustainably is challenging. This research analysed the four factors (i.e., actual knowledge, salience, environmental constraints, and habits) adopted from the Integrated Behavioural Model (IBM) theory and examined their impact on behavioural sustainability. A partial least squares structural equation modelling (PLS-SEM) approach was applied to evaluate 601 responses from a self-administered online survey collected from mobile user participants based in the United Arab Emirates (UAE). The survey findings indicated that habit has the strongest and statistically significant positive influence on behaviour; followed by knowledge and skills. Additionally, the salience of behaviour has a considerably negative influence on behaviour sustainability unaffected by environmental constraints. This research serves as a springboard for future research examining the IBM model to understand recycling behaviour in general and smartphone recycling sustainability in particular. Additionally, this research can assist smartphone manufacturers in understanding the factors that will maintain the recycling behaviour continuity, increasing the number of returned devices.
1. Introduction
Numerous businesses and organisations are currently implementing various strategies for collecting end-of-life (EOL) and end-of-use (EOU) smartphone or mobile phone devices to generate extra profit by selling excellent condition devices in a second market, reusing some parts for new manufacturing, or claiming to be environmentally friendly. Moreover, a massive amount of electronic waste (e-waste) is generated from discarded smartphone devices. Therefore, many studies focused on studying the factors that influence customers to participate in recycling processes
[1]. Around 50 million tonnes of electronic and electrical garbage (e-waste) are generated each year, the equivalent of all the commercial airplanes ever constructed, and barely 20% of this waste gets recycled properly
[2]. If nothing is done, e-waste will more than treble, reaching 120 million tonnes by 2050
[3]. Similarly, e-waste poses a massive potential material value of $US 62.5 billion, three times the yearly production of the world’s silver mines and more than the gross domestic product of most nations. Recycling one million mobile phones generates and conserves 24 kg of gold, 9000 kg of copper, 250 kg of silver, and 9 kg of palladium
[4]. Additionally, collecting minerals from discarded devices generates far less carbon dioxide than mining in the earth’s crust
[3].
The cadmium contained in a mobile phone battery is sufficient to contaminate 600,000 L of water. Additionally, illegal incineration can result in the release of toxic gases into the air, posing a serious health risk to both humans and animals
[4]. However, the electronic items and components that function correctly are worth more than the resources they contain. Therefore, increasing the useful life of goods and reusing components result in an even more significant economic gain
[4]. The popularity of smartphones over other electronic devices is due to their high consumption volume and the fact that each year numerous companies compete to announce new smartphone devices with new features and styles. Besides, such devices have a short life cycle, typically two to three years
[5][6]. The number of mobile phone users will increase from about 6.95 billion in the year 2020 to about 7.49 billion in the year 2025 worldwide
[7]. The United Arab Emirates (UAE) has mobile subscriptions of up to 209 for every 100 people
[8]. In light of this, the current study’s survey is conducted in the UAE, covering all seven cities or emirates. The UAE has lately increased the focus on the rising problem of e-waste by creating the world’s biggest e-waste recycling facility in the Dubai Industrial Park
[9]. While existing literature has also been limited to examining the e-waste recycling sustainability behaviour, most studies examine the e-waste recycling behaviour
[10][11][12][13], not focusing on behaviour continuity. Also, existing studies focus on evaluating the risk and developing decision tools for achieving sustainability in e-waste recycling
[14] or on e-waste collection strategies to promote a culture toward sustainability
[15]. This research unlocks this gap by examining the factors that will contribute to the long-term sustainability of behaviour.
The Theory of Planned Behaviour (TPB) model, which can be considered an old theory, was proposed in 1985 by Icek Ajzen
[16]. The model requires an association with new behavioural models to examine behaviour continuity. However, the TPB theory itself is one of the most robust theories, which allows for the examination of behaviour despite the exclusion of factors determining behaviour continuity in the model. With the focus on mobile devices’ short life cycle, there is a need to study the factors that affect smartphone recycling behaviour continuity. According to the resources available to the authors, no model was found to be examining this point. Therefore, this entryseeks to adopt factors from the Integrated Behaviour Model (IBM). The IBM theory is a combination of the Theory of Reasoned Action (TRA) and TPB, and is considered to be an extended version of the two theories combined, which was developed by Fishbein
[17]. IBM verifies that intention is the main factor in predicting behaviour. However, the IBM introduces new determinants that can help change the intention to perform a behaviour
[16][18]. IBM factors comprise attitude, perceived norms, and personal agency (which will not be examined and evaluated in this paper). The IBM posits four additional factors that may propel the behaviour sustainability, those factors are: knowledge and skills, salience of recycling behaviour, environmental constraints, and habits. These factors—which will be examined by this paper- affect the behaviour directly, as this model has been applied in the medical and health sectors to analyse the consistency of patients’ behaviour when it comes to taking medication. The knowledge and skills to perform the behaviour of smartphone recycling can be defined as the knowledge about mobile device waste and ways to identify the actions required for recycling mobile devices
[19]. For salience of behaviour, if an individual intends to perform a behaviour (mobile phone recycling/reuse) but is unaware of the importance of such behaviour, it is likely they will not perform this behaviour
[20]. Environmental constraints or restrictions refer to the external or socio-environmental challenges that might block or restrict individuals from performing a behaviour
[17]. Finally, habit is defined as a repeated past behaviour; for mobile phone recycling or reuse behaviour, it should be associated with the individual’s memory as a repeated experience
[19]. There is a shortage of attention on examining the factors associated with IBM and determining if they contribute to behaviour continuity.
2. Data Analysis and Results
The collected data were declared accurate. No missing data were identified since the survey questions had been completed, and no rows from the final sample of 630 responses needed to be deleted. According to Hair Jr, Hult, Ringle and Sarstedt
[21], straight-lining, however, occurs when a respondent marks the same answer for all questions. As a result, 29 replies were excluded since respondents provided the same responses to all sections, indicating that those respondents did not complete the survey honestly. Therefore, 601 final replies were retained, as this was the study’s objective sample size. This research used the full collinearity test to test the common method bias (CMB) as suggested by
[22]. According to
[23], this is the correct method for calculating CMB as the Harman one-factor test is no longer acceptable. The full collinearity test using SPSS a regression method against a common variable showed that the variance inflation factor (VIF) for the factors: (MU_KSP = 2.622), (MU_SB = 2.412), (MU_EC = 1.326), (MU_H = 2.465) and (BMU = 1.230). As the VIF is less than 5, indicating that single source bias is not a significant problem with our data.
2.1. Descriptive Statistics of the Respondents
The respondents’ general background was assessed first, which included their gender, age, educational level, salary, profession, and the emirates in which they lived in the UAE.
Table 1 summarises the descriptive statistics for the total 601 responses: 280 (46.6%) females and 321 (53.4%) males. A majority of the female respondents were within the range of 25–35 years old (41.4%), followed by the age group of 18–24 (29.3%). Similarly, most men were within the age group of 25–35 (33.6%), followed by 36–45 years old (33.3%). Most respondents held a bachelor’s degree, followed by those with only a high school degree (48.6% and 33.8%, respectively). Correspondingly, most of the respondents’ wages were within the range of AED 0–4999 by (59%). In terms of occupation, most of the respondents (63.2%) were paid on a salary basis. Regarding the emirates’ distribution, most male and female respondents were from Dubai (41.1%), followed by Abu Dhabi (34.6%) and Sharjah (12%).
Table 1 is divided into male and female sections to determine whether the demographic data collected matched the government-provided demographic data
[24] and whether the sample collected was nearly identical to the population.
Table 1. The demographic composition of the samples (N = 601).
| Demographic Question |
Options |
What Is Your Gender? |
| Female |
Male |
| Count |
N% |
Count |
N% |
| What is your age? |
18–24 |
82 |
29.30% |
59 |
18.40% |
| 25–35 |
116 |
41.40% |
108 |
33.60% |
| 36–45 |
64 |
22.90% |
107 |
33.30% |
| 46–60 |
16 |
5.70% |
43 |
13.40% |
| 61 or older |
2 |
0.70% |
4 |
1.20% |
| What is the highest level of education that you have completed? |
Less than high school |
9 |
3.20% |
12 |
3.70% |
| High school graduate |
94 |
33.60% |
109 |
34.00% |
| Bachelor’s degree |
142 |
50.70% |
150 |
46.70% |
| Master’s degree |
33 |
11.80% |
43 |
13.40% |
| Doctorate |
2 |
0.70% |
7 |
2.20% |
| What is your approximate average household income in AED? |
0–4999 |
176 |
62.90% |
179 |
55.80% |
| 5000–9999 |
49 |
17.50% |
51 |
15.90% |
| 10,000–29,999 |
44 |
15.70% |
43 |
13.40% |
| 30,000–49,999 |
7 |
2.50% |
26 |
8.10% |
| 50,000 or above |
4 |
1.40% |
22 |
6.90% |
| What is your occupation? |
Student |
60 |
21.40% |
30 |
9.30% |
| Employed for wages |
143 |
51.10% |
237 |
73.80% |
| Self-employed |
26 |
9.30% |
33 |
10.30% |
| Retired |
3 |
1.10% |
3 |
0.90% |
| Unemployed |
48 |
17.10% |
18 |
5.60% |
| What is your emirate? |
Abu Dhabi |
99 |
35.40% |
109 |
34.00% |
| Dubai |
114 |
40.70% |
133 |
41.40% |
| Sharjah |
31 |
11.10% |
41 |
12.80% |
| Ajman |
21 |
7.50% |
21 |
6.50% |
| Ras Al Khaimah |
7 |
2.50% |
6 |
1.90% |
| Umm Al Quwain |
3 |
1.10% |
3 |
0.90% |
| Fujairah |
5 |
1.80% |
8 |
2.50% |
2.2. Measurement Model Evaluation (the Outer Model)
The first step in analysing the reflecting measurement model was to determine the outer loading of the indicators. The outer loading should be equal to 0.7 or above, as recommended by
[21]. Generally, indicators with an outer loading of 0.40 to 0.70 should be evaluated for deletion only when doing so enhances the construct’s internal consistency, reliability, or convergent validity. In contrast, indications with an outer loading of less than 0.40 should always be eliminated
[21]. In
Table 2, the outer loading for BMU1 = 0.257 was deleted, which enhanced AVE from 0.501 to 0.611. Nevertheless, the items (EC2 = 0.495, EC1 = 0.683, and BMU2 = 0.581) were not deleted, as all those items were in the acceptable value >0.4. Moreover, deleting them would not enhance the AVE or Cronbach’s alpha values. Second, the PLS-SEM analysis in
Table 2 demonstrated that the composite reliability and Cronbach’s alpha values for the constructs were >0.7; those criteria ranged from 0.757 to 0.883 and 0.805 to 0.919, respectively. As a result, the internal consistency of the study framework model was established. Third, as shown in
Table 2, all questions assessed a single concept, and the average variance extracted (AVE) value was more than 0.5, indicating that convergent validity was confirmed.
Table 2. Result summary for the measurement model.
| Latent Variable |
Indicators |
Convergent Validity |
Internal Consistency Reliability Validity |
Discriminant Validity |
| Loading |
AVE |
Cronbach’s Alpha |
Reliability |
HTMT |
| >0.70 |
>0.50 |
0.60–0.90 |
0.60–0.90 |
Significantly < 0.85 |
| Mobile users’ knowledge and skills to perform the behaviour (MU_KSP) |
KSP 1 |
0.832 |
0.740 |
0.883 |
0.919 |
YES |
| KSP 2 |
0.874 |
| KSP 3 |
0.870 |
| KSP 4 |
0.865 |
| Mobile users’ salience of behaviour (MU_SB) |
SB 1 |
0.798 |
0.655 |
0.834 |
0.884 |
YES |
| SB 2 |
0.817 |
| SB 3 |
0.788 |
| SB 4 |
0.834 |
| Mobile users’ environmental constraints (MU_EC) |
EC 1 |
0.683 |
0.518 |
0.757 |
0.805 |
YES |
| EC 2 |
0.495 |
| EC 3 |
0.811 |
| EC 4 |
0.838 |
| Mobile users’ habit (MU_H) |
H1 |
0.798 |
0.614 |
0.801 |
0.863 |
YES |
| H2 |
0.770 |
| H3 |
0.711 |
| H4 |
0.848 |
| Behaviour of mobile users (BMU) |
BMU1 |
0.257 |
0.611 |
0.783 |
0.860 |
YES |
| BMU2 |
0.581 |
| BMU3 |
0.876 |
| BMU4 |
0.832 |
| BMU5 |
0.805 |
The fourth step in the outer model was to measure the discriminant validity, which was determined using the Fornell-Larcker criteria. The square root of the AVE of each construct should be higher than the correlation coefficient of any other construct
[21][25][26].
Table 3 confirms that the Fornell-Larcker criteria were established as the square root of the AVE value was greater than the row and column values relating to them, which further validates the discriminant validity.
Table 3. Fornell-Larcker criteria.
| |
BMU |
MU_EC |
MU_H |
MU_KSP |
MU_SB |
| BMU |
0.782 |
|
|
|
|
| MU_EC |
−0.137 |
0.719 |
|
|
|
| MU_H |
0.251 |
−0.470 |
0.783 |
|
|
| MU_KSP |
0.201 |
−0.400 |
0.713 |
0.860 |
|
| MU_SB |
−0.126 |
−0.239 |
0.383 |
0.440 |
0.809 |
Another approach used in PLS-SEM was the Heterotrait-Monotrait ratio (HTMT) of the correlations to appropriately measure discriminant validity. The HTMT technique estimates the genuine correlation between two constructs. The HTMT values in Table 4 showed that all constructs did not surpass 0.85, indicating that no discriminant validity was discovered. The result of the previous measurement analysis demonstrated the reliability and validity of the construct measurements. Therefore, the next stage for evaluating the structural model’s outputs could proceed.
Table 4. Heterotrait-Monotrait Ratio (HTMT).
| |
BMU |
MU_EC |
MU_H |
MU_KSP |
MU_SB |
| BMU |
|
|
|
|
|
| MU_EC |
0.132 |
|
|
|
|
| MU_H |
0.284 |
0.605 |
|
|
|
| MU_KSP |
0.234 |
0.497 |
0.841 |
|
|
| MU_SB |
0.167 |
0.355 |
0.511 |
0.520 |
2.3. Structural Model Evaluation (the Inner Model)
The first step in assessing the structural model was to analyse the possibility of collinearity between each set of constructs. The VIF values in PLS-SEM should be less than 3 to ensure that collinearity has no significant effect on the structural model assessment
[21]. By analysing the inner VIF values in SmartPLS, it was found that MU_EC (VIF = 1.301), MU_H (VIF = 2.237), MU_KSP (VIF = 2.197), and MU_SB (VIF = 1.258). All of the predictor constructs had a VIF value less than 3, indicating that collinearity between items was not a problem in the structural model. The second step in inner model assessment was to determine the significance and relevance of the structural model’s relationships by calculating the beta values (β) of the path coefficients.
Figure 1 illustrates the path coefficient from the constructs to the mobile users’ behaviour with the
p values calculated for the structural model’s relationships. The highest path coefficient was related to MU_SB (β = −0.289;
p < 0.000) with a negative direction, followed by MU_H (β = 0.248;
p < 0.000), MU_KSP (β = 0.138;
p < 0.05), and finally MU_EC (β = −0.041;
p > 0.05) to the negative direction. To conduct the hypotheses testing and check whether these relationships are significant, the study performed a bootstrapping technique using 10,000 bootstrap samples by selecting the complete bootstrapping option.
Figure 1 also shows the
p values associated between each construct and BMU.
Table 5 summarises the
t value,
p value, and the 95% confidence interval computed using the percentile technique. This indicated that all associations for the structural model’s hypotheses H1, H2, and H4 were statistically significant, except for H3, which was rejected. This rejection was also supported by
p value = 0.585, which was > 0.05.
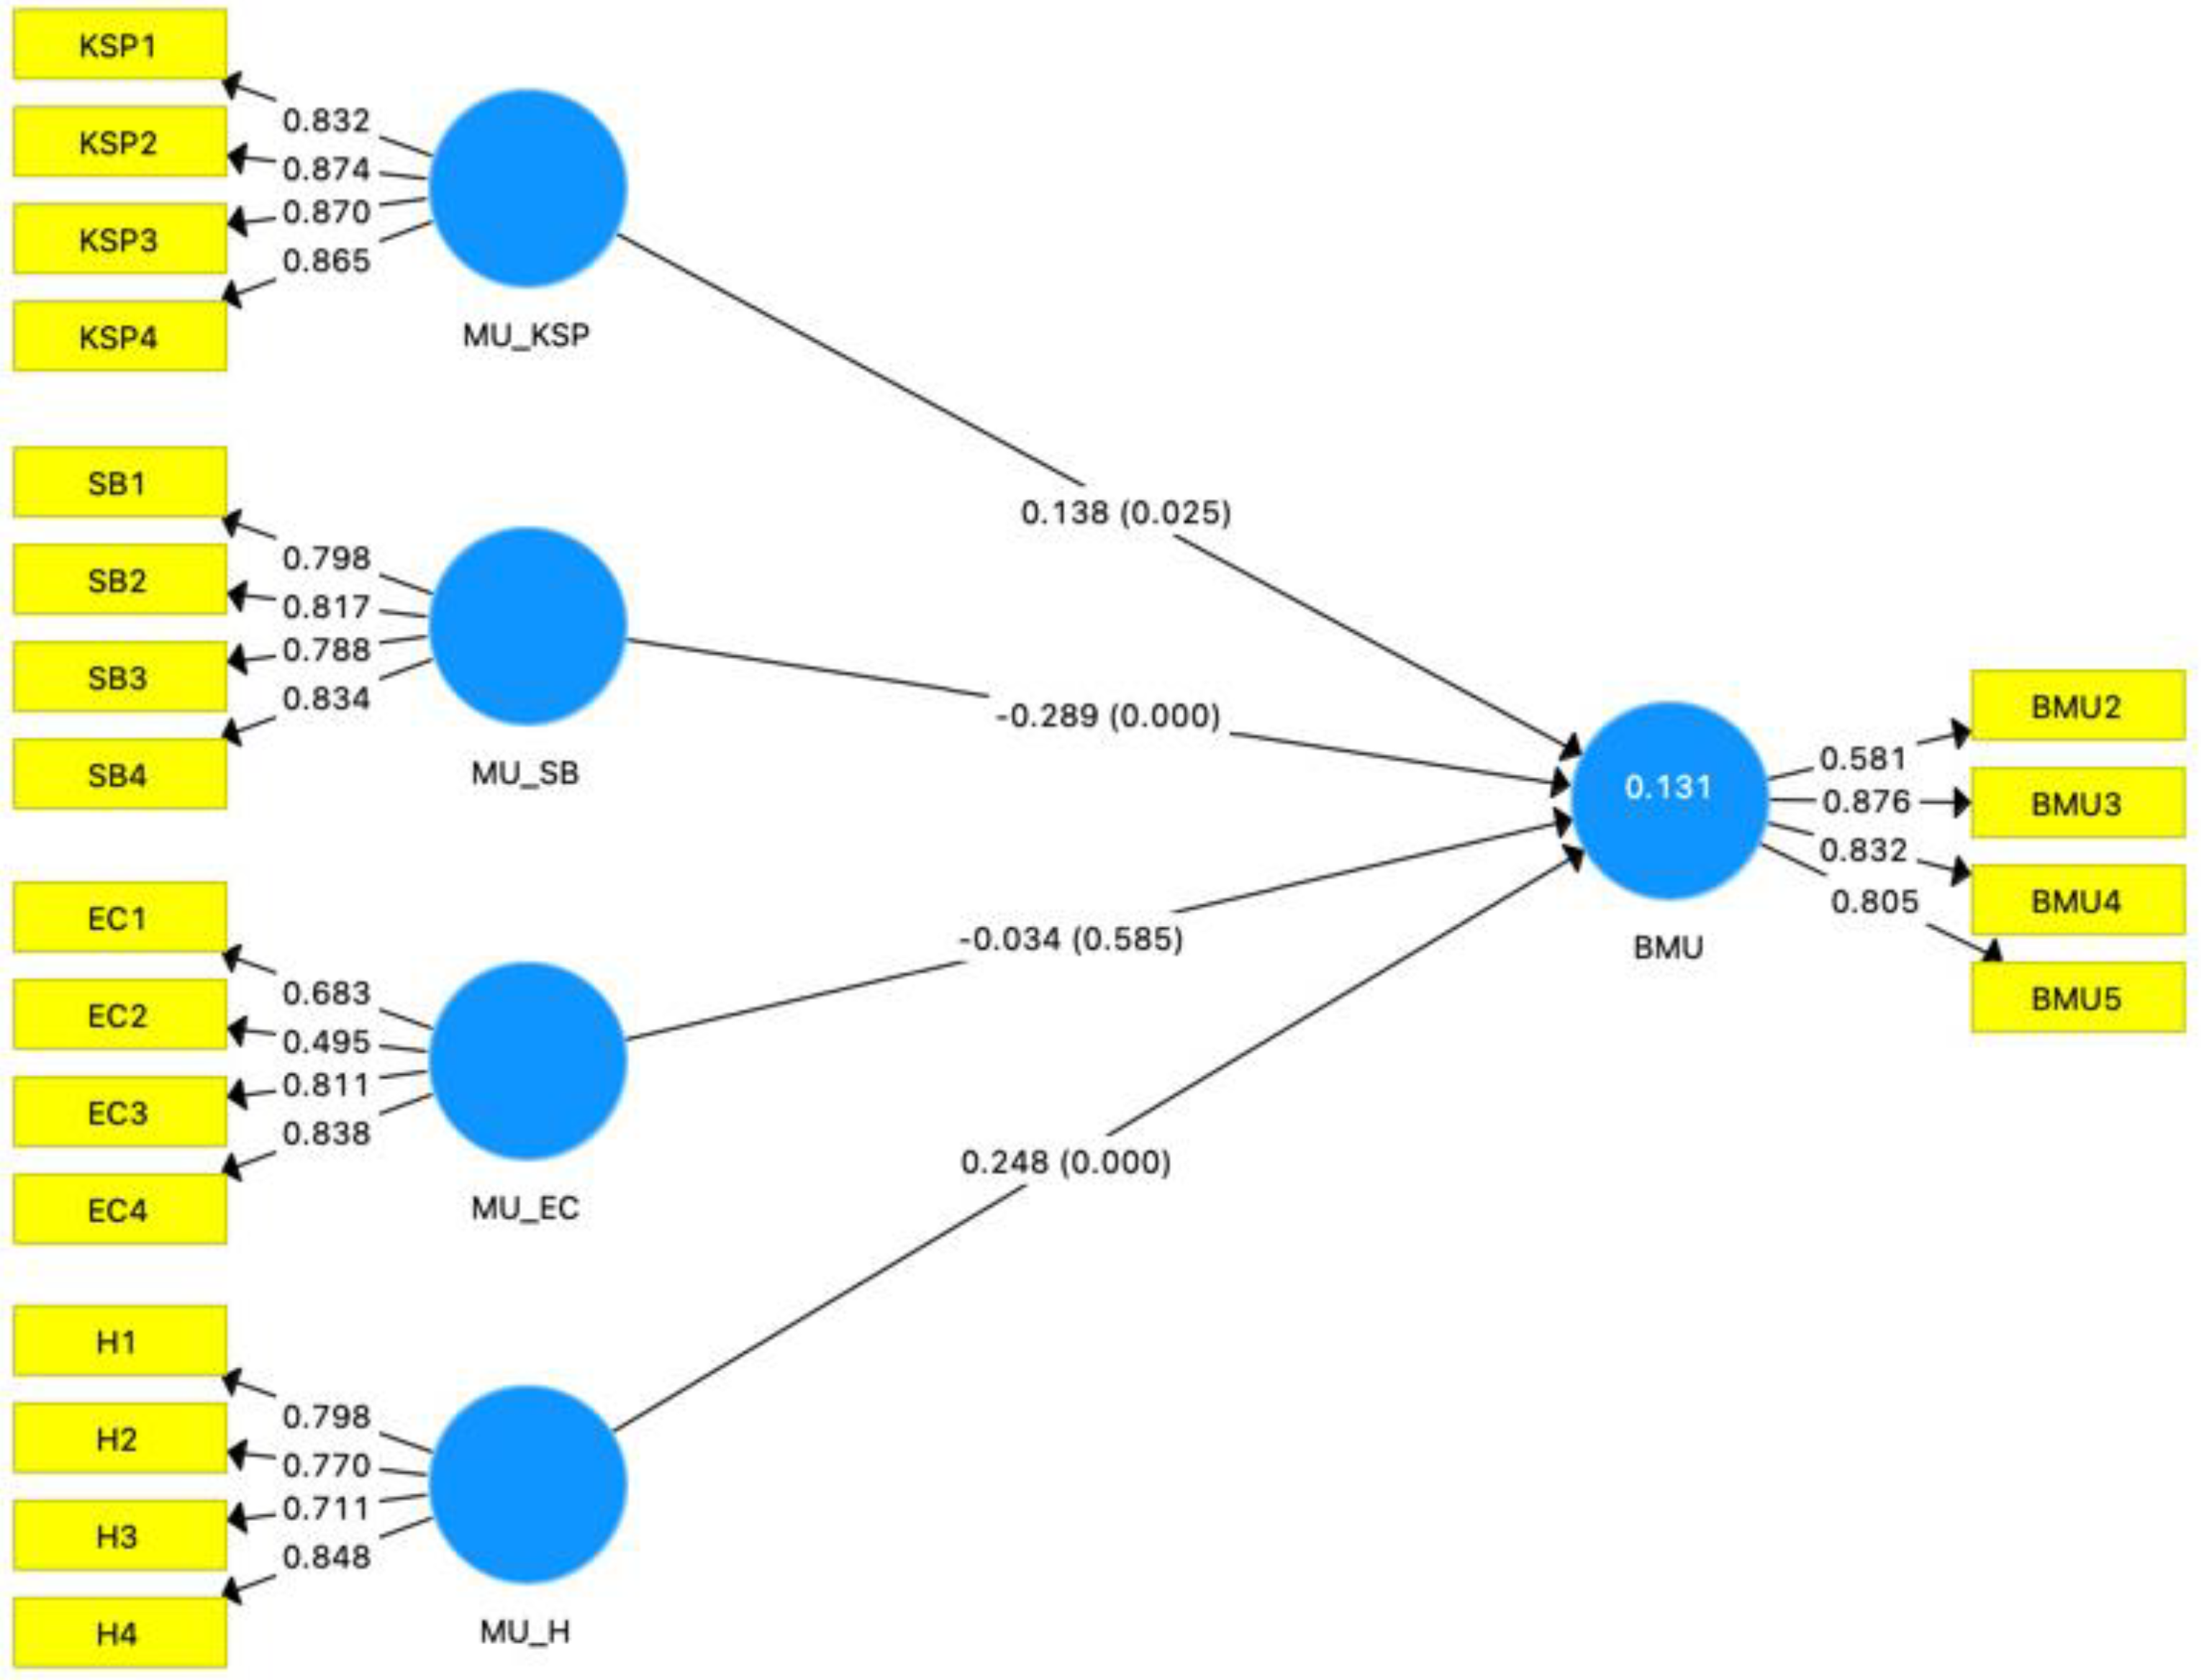 Figure 1.
 The structural equation model with factor loading value and R square.
Table 5. Significant testing results of the structural model’s path coefficients.
| Structural Path |
(β) |
t Value |
p Value |
95% Confidence Interval |
Conclusion |
| MU_KSP -> BMU |
0.138 |
2.246 |
0.025 |
[0.017, 0.259] |
H1, Supported |
| MU_SB -> BMU |
−0.289 |
4.374 |
0.000 |
[−0.391, −0.136] |
H2, Supported |
| MU_EC -> BMU |
−0.034 |
0.547 |
0.585 |
[−0.147, 0.139] |
H3, Not Supported |
| MU_H -> BMU |
0.248 |
4.045 |
0.000 |
[0.123, 0.363] |
H4, Supported |
The third part of assessing the structural model was to calculate the coefficient of determination (R
2) value to estimate the model’s explanatory power.
Figure 1 shows the R
2 value for the endogenous construct (BMU) with the substantial value = 0.131. However, according to Hair Jr, Hult, Ringle and Sarstedt
[21], the greater the number of predictor constructs, the higher the R
2 value. The R
2 value should always be interpreted in light of the context of the study; for example, the R
2 values in a model predicting human attitudes, perceptions, and intentions are doubtful. The final step was to measure the predictive relevance value using the blindfolding procedure in SmartPLS. It was found that
Q2 was greater than zero for the construct (BMU) = 0.073. Through the Q2 statistics, it was shown that there was sufficient predictive relevance for the indicators of the endogenous construct in the structural model.
3. Current Insights
Using an IBM-based model, this research examined the possible determinants that contribute to the sustainability of recycling behaviour. The research did not concentrate on behavioural aspects since those have been covered often in research
[11][12][27][28][29][30]. The IBM variables demonstrated a major good influence on the medical field in terms of maintaining behaviour continuity in order to continue addressing the treatment
[17]. The purpose of this research was to determine whether those elements might have a beneficial effect on the sustainability of smartphone recycling behaviour. Considering the R
2 value, the findings justified the adoption of this frame = 0.131 for stock returns research or this study’s subject. Usually, for reverse logistics (RL) and collection of smartphones from customers, the R
2 value was as low as 0.10, which was considered acceptable
[21]. The research found that the smartphone users’ knowledge and skills (H1) positively contributed to a continuous smartphone recycling behaviour. This result was consistent with the findings by
[12] that focused on “ecological knowledge (eco-literacy)”, although their research concentrated on the impact on the intention in the Decomposed Theory of Planned Behaviour (DTPB). Similarly, the current research’s result was aligned with the research by
[31], in which they found that people with high education and knowledge of environmental preservation and conservation had more inclination to participate in recycling behaviour as they were even willing to pay for recycling.
For the second hypothesis (H2) on examining whether the salience of recycling behaviour is positively associated with continuous smartphone recycling behaviour, the results showed a significant influence on the behaviour. Nevertheless, it was surprisingly towards the negative direction, meaning that the more salience in a behaviour, the less the intention to perform the behaviour continually. The study’s result interestingly contradicted the results by
[20], who argued that increasing the salience of product transformation—which involved recyclables being transformed into new items—led to the increase in recycling behaviour. Moreover, the results did not match the findings of
[32], who examined the IBM factors to check which factor could predict nurses’ intentions to deliver “as required” pain relief medications. They found that salience of behaviour was the only significant predictor for the nurses’ intentions. The possible explanation for this study’s results is that the respondents might not understand the survey questions’ links between the importance of the behaviour and performing the behaviour, or they did not consider salience of behaviour as important to the satisfaction of doing the behaviour continually.
The third hypothesis (H3), regarding whether removing the environmental constraints will positively contribute to continuous mobile phone recycling, was found to be not significant. The results were not in line with the findings by
[33], in which environmental constraints were alluded to by the authors as issues that impeded patients from adhering to a pharmaceutical regimen. Nevertheless, the results were consistent with the findings by
[34], who also found that environmental constraints to performing green behaviour did not create barriers for green buyers to achieve their individual sustainable goals. This result was expected in the UAE as it is rare to find environmental barriers that might impact mobile users’ sustainable recycling behaviour. The government even created an organisation called “Tadweer”, responsible for waste management with a customer hotline for collecting any kind of waste or e-waste. Moreover, the UAE government built multiple places and channels for collecting e-waste for recycling.
Finally, regarding the habit factor (H4) on whether it positively contributes to continuous smartphone recycling behaviour, the results confirmed that habit was the top factor that contributed to recycling behaviour sustainability. This result could be compared to the one determined by
[10], who found that young adults’ recycling habits were a strong predictor of their intention to recycle e-waste. While Aboelmaged’s (2021) research focused on the influence of habit on intention and the current research on behaviour sustainability, the concept is similar, particularly given that his study was done in the UAE. Nevertheless, this research’s result was not in line with the findings by
[35], who measured habit as a positive intention to repurchase. This author discovered that habit did not affect the intention to buy a refurbished smartphone. This research placed greater emphasis on the customers’ decision to acquire a refurbished phone, while in contrast, the current research placed greater emphasis on returning or refurbishing used mobile phones.
4. Conclusion
Recycling is the most efficient way to manage e-waste, particularly smartphones, since they are expensive products with short lifetimes. Additionally, the most commonly used pattern for such gadgets is to keep them rather than sending old devices for recycling. As a result, sustaining recycling practices is very difficult when it comes to cell phones. This research surveyed a representative sample of respondents using an online survey to determine the factors that contribute to the sustainability of smartphone recycling behaviour, by analysing the influence of IBM-related variables (knowledge, salience of behaviour, environmental constraints, and habits). The research will encourage industry players to prioritise such factors in their reverse logistics system to encourage mobile users to continue returning EOL/EOU smartphones, which will significantly decrease mobile waste and improve natural resource optimisation.
This entry is adapted from the peer-reviewed paper 10.3390/su14042282