Your browser does not fully support modern features. Please upgrade for a smoother experience.
Please note this is an old version of this entry, which may differ significantly from the current revision.
Subjects:
Others
Perennial herb Solidago canadensis L. (Asteraceae: Astereae), originating in North America, was brought and introduced into middle Europe as an ornamental, schizanthus, and melliferous plant in the middle of the 18th century. In the end, it unintentionally spread from the gardens to the natural environment.
- Canadian goldenrod
- morphological traits
- essential oil productivity
- management
1. Introduction
Perennial herb Solidago canadensis L. (Asteraceae: Astereae), originating in North America, was brought and introduced into middle Europe as an ornamental, schizanthus, and melliferous plant in the middle of the 18th century. In the end, it unintentionally spread from the gardens to the natural environment. Today, Canadian goldenrod is one of the most widespread invasive neophytes in central and eastern Europe. Its distribution within the territory of Slovakia has considerably grown since the collapse of socialism in 1989, when the land changed from being state-owned to a privately owned. Thus, many pieces of lands remained without a known owner. The previously cultivated land became abandoned and lacked regular interference, such as mowing. Consequently, strewed spots of dense mono-specific goldenrod coenoses of different sizes are typical for the urban zones and agricultural landscapes, at present [1,2,3,4].
Although it is still being studied, S. canadensis, as an invasive neophyte, displays some superior features, which make it more successful in comparison to autochthonous species, and several possible mechanisms of its success have been described:
- -
-
the production of a high number of small, light-winged seeds, spreading mostly by the air, germinating rapidly in the high percentage and, with a wide tolerance for the different values of soil reaction, salinity, and moisture;
- -
-
robust asexual reproductive ability of the underground parts (rhizomes, nodes, stem bases), hereby just a naturalized population has a great capacity for a clonal growth, since the clonality is in general concurrently found to offer advantages that facilitate invasion [5];
- -
- -
The success and persistence of S. canadensis have also been connected to various morphological traits: (a) contribution of Canadian goldenrod plants’ height to its relative % abundance (degree of invasion) within the invaded plots was pinpointed [13]; (b) the relationship between communities of soil arbuscular mycorrhizal fungi (AMF) and S. canadensis aboveground and belowground phenotypic traits as the plant’s height, number of leaves, chlorophyll content of leaves, rhizomes’ number, and roots’ biomass allocation was described [14,15]; (c) polyploidy of S. canadensis was connected with larger root systems [16]; and (d) significant influence of selected soil properties on Solidago height and inflorescence size was detected, too [17]. Equally, the plants’ quantitative productivity of essential oil, as the plant secondary metabolite, is nearly correlated with the plants’ growth and morphological traits and, indirectly, with the environmental variables [18,19]. Accordingly, a measure of the goldenrod biomass growth directly reflects the success of this invasive neophyte on the local scale and quasi predicts the future course of the invasion. Equally, the morphological features survey gives a basis for balanced and optimized management of Solidago and, subsequently, feedback on the effectiveness of various management practices applied with the aim of reducing goldenrod biomass or restoring the invaded plots [20,21,22].
Solidago canadensis concurrently displays several biologically valuable features—its biomass contains proteins, lipids, saccharides, vitamin C, carotenoids, and amino acids, which indicates that it could be a source of valuable products for the bioeconomy [23]. As the major compounds of its essential oil, monoterpenes, such as α-pinene, β-pinene, bornyl acetate, camphene, limonene and thymol, terpene β-elemene, and sesquiterepenes, such as β- gurjunene, δ-cadinene, germacrene D, and longifolene, were determined [24,25,26]. These components are used as the constituents of phytotherapeutic drugs for the chronic diseases treatment and account for antioxidant, antimicrobial, and antifungal activity [27,28]. These constituents are equally found to be responsible for goldenrod EO repellency [29], although the Canadian goldenrod EO insecticidal activity remains less studied [26]. Solidago canadensis EO was also confirmed to account for phytotoxicity [10,30]. The leaf extracts of the Canadian goldenrod were declared to have promising potential in the green synthesis of triangular and hexagonal gold nanoparticles (AuNPs) used in medicine [31].
2. Morphological Traits
Plant material processed for this study was collected during the growing season of 2014, from 12 sampling stands in the eastern Slovakia. Stands were proportionally divided into the three groups, with categories according to different degrees of S. canadensis invasion:
A category—including sampling stands A1–4 with a heavy degree of invasion, i.e., 75–100 Canadian goldenrod relative % abundance within the vegetation cover;
B category—including sampling stands B5–8 with a middle degree of invasion, i.e., 50–75 Canadian goldenrod relative % abundance within the vegetation cover; and
C category—including sampling stands C9–12 with a mild degree of invasion, i.e., 25–50 Canadian goldenrod relative % abundance within the vegetation cover.
Ten single plants (ramets) were collected from each of the sampling stands, overall, five times, i.e., at 5 sampling terms, which corresponded to various S. canadensis phenological phases: green goldenrods without inflorescence; goldenrods in full blooming; and goldenrods after active blooming period. Summarily, 600 specimens were processed for this study. Except for the morphological traits, the EO productivity rate was also determined.
Mean values and standard deviations (±SD) of the selected morphological traits (those determined on the, fresh, plant material before drying out), as well as EO yields, are listed in Table 1, Table 2 and Table 3. The differences between the sampling stands categories in the selected morphological traits and EO yields, assessed using One-way ANOVA, with three levels of significance (p < 0.05; p < 0.01; p < 0.001), are indicated in Table 1, Table 2 and Table 3 too.
Table 1. Selected morphological traits and essential oil yields (mg/kg) of the Solidago canadensis from heavily invaded stands and significant mutual distinctions between the A versus B (º) and A versus C (*) categories of sampling stands, evaluated generally and for separated sampling terms, with three levels of significance (º, * p < 0.05; ** p < 0.01; *** p < 0.001).
| Morphological Traits | A Category 75–100% (Heavy Degree of Invasion) | |||||
|---|---|---|---|---|---|---|
| May/June | June/July | August | September | October | ||
| Plant height (cm) | *** | 100.5 ± 14.5 | 139.8 ± 14.9 * | 167.8 ± 20.2 * | 167.5 ± 22.3 | 159.4 ± 30.9 |
| Entire plant weight (g) | * | 35.2 ± 10.1 * | 47.8 ± 16.3 | 55.1 ± 17.1 | 67.3 ± 34.9 | 62.5 ± 22.2 |
| Relative water content of entire plant (%) | 75.6 ± 6.6 | 61.7 ± 3.6 | 58.6 ± 1.3 | 55.9 ± 1.2 | 57.9 ± 2.4 º | |
| Stem length (cm) | *** | 100.5 ± 14.5 | 139.8 ± 14.9 * | 132.7 ± 12.9 * | 131.4 ± 11.6 * | 129.4 ± 24.9 |
| Stem weight (g) | *** | 21.9 ± 6.3 * | 29.3 ± 11.0 * | 19.9 ± 8.6 * | 9.9 ± 1.8 | 12.7 ± 4.8 * |
| Stem relative water content (%) | 72.8 ± 8.3 | 59.2 ± 3.6 | 53.8 ± 1.8 º | 47.9 ± 3.5 | 51.7 ± 1.9 | |
| Number of all leaves | * | 52.4 ± 8.3 | 93.8 ± 7.1 | 76.4 ± 10.4 º | 67.0 ± 8.2 | 62.0 ± 17.7 |
| Weight of all leaves (g) | ** | 12.9 ± 3.9 | 18.2 ± 5.6 | 12.8 ± 3.9 | 11.4 ± 3.6 | 14.3 ± 8.6 |
| Weight of a single leaf (g) | ** | 0.2 ± 0.05 | 0.2 ± 0.06 | 0.2 ± 0.04 | 0.2 ± 0.08 | 0.2 ± 0.12 |
| Relative water content of all leaves (%) | * | 35.2 ± 10.1 * | 47.8 ± 16.3 | 55.1 ± 17.1 | 67.3 ± 34.9 | 62.5 ± 22.2 |
| Number of assimilating, green, leaves | 43.0 ± 8.9 | 70.3 ± 7.3 | 60.9 ± 2.4 | 60.1 ± 5.9 º | 44.9 ± 16.1 | |
| Weight of assimilating, green, leaves (g) | ** | 11.9 ± 3.7 | 16.9 ± 5.6 | 11.9 ± 3.4 | 10.8 ± 3.4 | 12.4 ± 8.6 |
| Weight of a single assimilating, green, leaf (g) | ** | 0.3 ± 0.1 | 0.2 ± 0.1 | 0.2 ± 0.1 | 0.2 ± 0.1 | 0.3 ± 0.1 |
| Relative water content of assimilating, green, leaves (%) | ** | 75.1 ± 4.0 | 67.9 ± 3.1 | 64.9 ± 3.1 | 65.6 ± 0.8 *** | 66.2 ± 4.5 |
| Number of non-assimilating, brown, leaves | * | 9.3 ± 0.8 | 23.5 ± 5.0 * | 15.6 ± 8.0 | 6.9 ± 3.7 | 17.1 ± 10.6 |
| Weight of non-assimilating, brown, leaves (g) | ** | 0.9 ± 0.4 * | 1.3 ± 0.4 * | 0.8 ± 0.5 | 0.6 ± 0.4 | 1.9 ± 0.9 |
| Weight of single non-assimilating, brown, leaf (g) | 0.1 ± 0.42 | 0.06 ± 0.01 | 0.05 ± 0.02 | 0.09 ± 0.03 | 0.1 ± 0.05 | |
| Relative water content of non-assimilating, brown, leaves (%) | 59.8 ± 16.9 | 36.9 ± 8.8 | 37.3 ± 7.3 | 55.4 ± 12.9 | 50.2 ± 14.3 | |
| Inflorescence length (cm) | - | - | 35.2 ± 7.9 | 36.1 ± 10.9 | 29.9 ± 7.2 | |
| Inflorescence weight (g) | - | - | 11.1 + 4.4 | 22.6 ± 14.9 | 16.9 ± 7.9 | |
| Inflorescence relative water content (%) | * | - | - | 65.5 + 3.1 | 68.8 ± 4.2 * | 64.8 ± 3.3 |
| Stem EO yield (mg/kg) | ** | 0.7 ± 0.8 | 6.2 ± 5.7 | 4.7 ± 4.0 | 12.3 ± 13.8 * | 7.8 ± 4.6 ** |
| Leaf EO yield (mg/kg) | * | 1.9 ± 2.5 | 5.9 ± 6.2 | 3.5 ± 2.9 * | 17.9 ± 10.7 ** | 248.3 ± 29.7 ** |
| Inflorescence EO yield (mg/kg) | - | - | 6.7 ± 9.3 | 20.9 ± 10.4 | 18.5 ± 6.7 *,º | |
Table 2. Selected morphological traits, essential oil yields (mg/kg) of the Solidago canadensis from medial invaded stands and significant mutual distinctions between the B versus C (°) categories of sampling stands, evaluated generally and for separated sampling terms, with three levels of significance (° p < 0.05; °° p < 0.01; °°° p < 0.001).
| Morphological Traits | B Category 50–75% (Middle Degree of Invasion) | |||||
|---|---|---|---|---|---|---|
| May/June | June/July | August | September | October | ||
| Plant height (cm) | °° | 95.2 ± 8.9 | 121.8 ± 11.6 | 162.9 ± 6.8 ° | 146.9 ± 13.3 | 140.9 ± 22.4 |
| Entire plant weight (g) | 32.3 ± 5.9 ° | 42.0 ± 8.5 | 60.5 ± 13.8 | 59.1 ± 25.5 | 45.3 ± 9.3 | |
| Relative water content of entire plant (%) | 73.2 ± 3.4 | 61.2 ± 2.6 | 56.9 ± 1.8 | 55.9 ± 6.5 | 49.6 ± 6.2 ° | |
| Stem length (cm) | °°° | 95.2 ± 8.9 | 121.8 ± 11.6 | 127.7 ± 3.2 ° | 115.9 ± 10.1 | 110.4 ± 17.3 |
| Stem weight (g) | °°° | 19.5 ± 3.0 ° | 24.3 ± 5.5 | 18.9 ± 2.7 °° | 10.1 + 2.3 | 11.9 ± 6.0 |
| Stem relative water content (%) | 72.8 ± 8.3 | 59.2 ± 3.6 | 53.8 ± 1.8 ° | 47.9 ± 3.5 | 51.7 ± 1.9 | |
| Number of all leaves | °°° | 50.3 ± 8.4 | 89.5 ± 12.4 | 89.2 ± 7.3 °° | 79.8 ± 6.6 ° | 68.4 ± 11.1 |
| Weight of all leaves (g) | °° | 13.1 ± 5.6 ° | 17.2 ± 2.9 | 15.5 ± 1.7 °° | 11.5 ± 3.1 | 8.9 ± 4.1 |
| Weight of a single leaf (g) | 0.3 ± 0.01 °° | 0.2 ± 0.02 ° | 0.2 ± 0.01 | 0.2 ± 0.04 | 0.1 ± 0.04 | |
| Relative water content of all leaves (%) | 32.3 ± 5.9 ° | 42.0 ± 8.5 | 60.5 ± 13.8 | 59.1 ± 25.5 | 45.3 ± 9.3 | |
| Number of assimilating, green, leaves | 44.0 ± 6.9 | 67.6 ± 8.8 | 69.3 ± 3.5 °° | 68.1 ± 3.4 ° | 48.1 ± 23.9 | |
| Weight of assimilating, green, leaves (g) | ° | 12.4 ± 2.7 ° | 15.9 ± 2.9 | 13.9 ± 1.6 °° | 10.5 ± 3.0 | 7.4 ± 4.9 |
| Weight of a single assimilating, green, leaf (g) | 0.3 ± 0.02 °° | 0.2 ± 0.02 ° | 0.2 ± 0.02 | 0.2 ± 0.05 | 0.2 ± 0.04 | |
| Relative water content of assimilating, green, leaves (%) | 75.4 ± 1.4 | 67.1 ± 1.7 | 63.1 ± 1.7 | 61.8 ± 3.4 | 64.2 ± 2.4 | |
| Number of non-assimilating, brown, leaves | °° | 7.2 ± 0.5 | 21.9 ± 4.4 ° | 19.9 ± 9.3 ° | 11.8 ± 9.1 | 20.3 ± 13.9 |
| Weight of non-assimilating, brown, leaves (g) | ° | 0.7 ± 0.3 ° | 1.3 ± 0.1 °° | 1.6 ± 0.9 ° | 1.04 ± 0.7 | 1.5 ± 1.2 |
| Weight of single non-assimilating, brown, leaf (g) | 0.09 ± 0.03 ° | 0.06 ± 0.01 ° | 0.08 ± 0.03 | 0.10 ± 0.03 | 0.07 ± 0.01 | |
| Relative water content of non-assimilating, brown, leaves (%) | 65.9 ± 8.7 | 42.5 ± 8.5 | 44.2 ± 11.4 | 49.5 ± 9.6 | 39.7 ± 1.3 | |
| Inflorescence length (cm) | - | - | 35.2 ± 5.6 | 31.4 ± 7.8 | 30.6 ± 7.3 | |
| Inflorescence weight (g) | - | - | 13.7 ± 8.3 | 18.5 ± 10.2 | 12.1 ± 2.9 | |
| Inflorescence relative water content (%) | - | - | 66.5 ± 2.5 | 64.9 ± 2.5 | 62.4 ± 3.6 | |
| Stem EO yield (mg/kg) | 1.6 ± 2.2 | 11.5 ± 26.1 | 4.7 ± 2.6 | 4.6 ± 3.8 | 8.8 ± 6.5 °° | |
| Leaf EO yield (mg/kg) | 4.4 ± 6.7 | 14.4 ± 31.7 | 11.7 ± 8.3 | 12.1 ± 10.5 | 7.2 ± 5.2 | |
| Inflorescence EO yield (mg/kg) | - | - | 25.2 ± 31.4 | 15.5 ± 11.7 | 9.3 ± 7.8 | |
Table 3. Selected morphological traits and essential oil yields (mg/kg) of the Solidago canadensis from mildly invaded stands.
| Morphological Traits | C Category 25–50% (Mild Degree of Invasion) | ||||
|---|---|---|---|---|---|
| May/June | June/July | August | September | October | |
| Plant height (cm) | 78.9 ± 16.1 | 93.7 ± 31.4 | 123.9 ± 31.4 | 129.7 ± 39.5 | 119.9 ± 35.3 |
| Entire plant’s weight (g) | 19.5 ± 7.1 | 22.7 ± 15.4 | 33.7 ± 22.7 | 52.3 ± 41.2 | 44.5 ± 26.7 |
| Relative water content of entire plant (%) | 70.9 ± 4.7 | 62.6 ± 2.8 | 57.6 ± 2.2 | 60.1 ± 7.9 | 59.1 ± 3.6 |
| Stem length (cm) | 78.9 ± 16.1 | 93.7 ± 31.4 | 95.8 ± 21.3 | 96.2 ± 27.5 | 93.5 ± 25.2 |
| Stem weight (g) | 11.0 ± 5.0 | 12.4 ± 9.3 | 9.2 ± 3.3 | 6.5 ± 4.3 | 5.2 ± 3.4 |
| Stem relative water content (%) | 68.8 ± 6.4 | 58.9 ± 2.9 | 53.2 ± 0.9 | 54.0 ± 16.3 | 51.2 ± 2.3 |
| Number of all leaves | 48.4 ± 3.4 | 70.1 ± 21.0 | 68.6 ± 6.8 | 63.6 ± 7.8 | 60.1 ± 10.9 |
| Weight of all leaves (g) | 8.3 ± 2.1 | 9.9 ± 5.9 | 7.9 ± 3.0 | 9.5 ± 3.0 | 10.7 ± 3.6 |
| Weight of a single leaf (g) | 0.2 ± 0.03 | 0.1 ± 0.03 | 0.1 ± 0.06 | 0.2 ± 0.07 | 0.2 ± 0.05 |
| Relative water content of all leaves (%) | 19.5 ± 7.1 | 22.7 ± 15.4 | 33.7 ± 22.7 | 52.3 ± 41.2 | 44.5 ± 26.7 |
| Number of assimilating, green, leaves | 41.7 ± 2.9 | 59.0 ± 13.5 | 61.9 ± 9.1 | 58.4 ± 5.9 | 46.7 ± 17.8 |
| Weight of assimilating, green, leaves (g) | 8.0 ± 2.1 | 9. 5 ± 5.5 | 7.7 ± 2.9 | 9.1 ± 3.0 | 9.2 ± 4.6 |
| Weight of a single assimilating, green, leaf (g) | 0.2 ± 0.04 | 0.2 ± 0.05 | 0.1 ± 0.07 | 0.2 ± 0.07 | 0.2 ± 0.05 |
| Relative water content of assimilating, green, leaves (%) | 73.8 ± 2.7 | 67.4 ± 3.4 | 61.3 ± 4.8 | 59.3 ± 1.5 | 52.8 ± 14.3 |
| Number of non-assimilating, brown, leaves | 6.6 ± 2.5 | 11.1 ± 7.6 | 6.7 ± 2.5 | 5.1 ± 4.6 | 13.4 ± 7.8 |
| Weight of non-assimilating, brown, leaves (g) | 0.3 ± 0.1 | 0.5 ± 3.8 | 0.3 ± 0.2 | 0.4 ± 0.4 | 4.5 ± 1.9 |
| Weight of single non-assimilating, brown, leaf (g) | 0.05 ± 0.01 | 0.05 ± 0.01 | 0.04 ± 0.01 | 0.07 ± 0.03 | 0.09 ± 0.07 |
| Relative water content of non-assimilating, brown, leaves (%) | 52.8 ± 11.2 | 50.9 ± 11.4 | 41.4 ± 10.4 | 43.9 ± 11.3 | 34.7 ± 11.9 |
| Inflorescence length (cm) | - | - | 28.1 ± 11.8 | 33.5 ± 15.7 | 26.4 ± 11.1 |
| Inflorescence weight (g) | - | - | 8.1 ± 8.0 | 17.9 ± 17.4 | 13.9 ± 11.4 |
| Inflorescence relative water content (%) | - | - | 67.3 ± 0.9 | 62.2 ± 2.9 | 51.6 ± 13.7 |
| Stem EO yield (mg/kg) | 1.7 ± 3.0 | 2.5 ± 3.2 | 4.3 ± 4.6 | 3.5 ± 2.0 | 3.3 ± 2.2 |
| Leaf EO yield (mg/kg) | 3.9 ± 3.6 | 3.6 ± 4.0 | 8.1 ± 5.5 | 6.0 ± 8.0 | 3.9 ± 3.1 |
| Inflorescence EO yield (mg/kg) | - | - | 12.1 ± 17.8 | 19.5 ± 28.4 | 8.4 ± 8.3 |
Single values of morphological traits represent means ± standard deviations (SD) from the 40 values (10 specimens × 4 sampling stands of the identical sampling stand category, according to degree of invasion A1–4, B5–8, C9–12), presented in the separate sampling terms. Single values of EO yields represent means ± standard deviations (SD) from the particular values (weight of the EO extracted from the 0.020 kg of the dry Solidago canadensis biomass) from 4 sampling stands of the identical sampling stand category according to the degree of invasion, presented for the separate sampling terms, sampling stand category and separated plant organs of Solidago canadensis used for the extraction. Values ± SD were determined using univariate statistic. Differences between the sampling stands categories in the selected morphological traits and EO yields were assessed using Two-way and One-way ANOVA, with three levels of significance (p < 0.05; p < 0.01; p < 0.001), where º indicates differences between the A versus B, * A versus C, and ° B versus C categories.
2.1. Morphological Traits—Different Phenological Phases
The mean S. canadensis plant’s height and the entire plant’s weight increased significantly from the 1st (May/June) to the 3rd (August) sampling term, when the highest and the heaviest plants were noticed. Subsequently, height and weight were balanced between the 4th (September) and 5th (October) sampling terms.
The stems were lowest in the 1st (May/June) sampling term and were significantly shorter in comparison to 2nd, 3rd, and 4th sampling terms. The highest stem weight was noticed during the first three sampling terms (May–August). In the late growing season, i.e., September and October, the stem’s weight decreased and was significantly lower in comparison to May–August.
The lowest number of all the leaves was observed at the 1st (May/June) sampling term, while the highest was at the 2nd (June/July) sampling term. Consequently, the number of all leaves decreased, till, in September and October, this decrease was significant (2nd June/July versus 4th September p < 0.05; 2nd June/July versus 5th October p < 0.001; 3rd August versus 5th October p < 0.01). The weight of the all leaves was the highest in the 2nd (June/July) sampling term. Consequently, no distinctions were observed between the separate sampling terms. However, the average weight of the single leaf was significantly higher at first, in comparison to other of the sampling terms. The ratio between the entire plant’s weight and all leaves’ weight was more than 3.5, in general, as well as in every category of sampling stands. The lowest number of the assimilating leaves was noticed in May. Consequently, their number significantly increased from June to August, and repeatedly significantly decreased in October. A similar pattern was observed concerning the weight of assimilating, green, leaves; however, the distinctions between the particular sampling terms were not significant. In opposition, the number, as well as the weight, of non-assimilating, brown, leaves were the highest just at the end of the growing season. Since the average weight of the single assimilating leaf decreased, those of the non-assimilating increased from the beginning to the end of the growing season. The mutual ratio of the assimilating and non-assimilating leaves changes on behalf of the non-assimilating leaves as the growing season came to the end.
Fully developed inflorescences were noticed in the 3rd sampling term in the first half of August. In general, neither the length nor the weight of the inflorescence changed significantly during the monitored period.
The highest relative water content of the entire plant, stem, and all the leaves was noticed in the 1st (May/June) sampling term and in inflorescence at the beginning of the blooming period. Consequently, relative water contents decreased, and the lowest were noticed in October.
2.2. Morphological Traits—Different Degree of Invasion
In general, the plants from the stands with the mild degree of invasion (25–50%) were significantly lower (A versus C p < 0.001; B versus C p < 0.01) and lighter (A versus C p < 0.05). The differences between the sampling stands in the plant’s height and the entire plant’s weight are also shown in the dendrograms (Figure 1a,b), where clusters, consisting of stands with the identical degree of invasion (A1–4, B5–8, C9–12), are clearly recognizable. The separated position of the group of stands with a heavy degree of invasion (A category) is obvious.
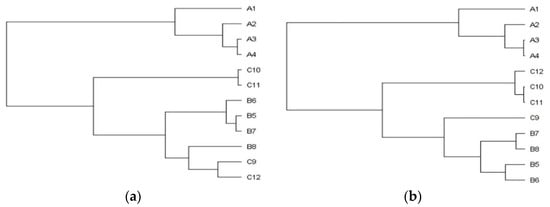
Figure 1. Dendrograms of the sampling stands classification according to Solidago canadensis (a) height and (b) entire plant’s weight. Stands with the different degree of invasion were classified using Cluster analysis, Ward’s method. Abbreviation and notes: A1–4 = heavily invaded stands with 75–100%, B5–8 = medial invaded stands with 50–75%, C9–12 = mildly invaded stands with 25–50% relative abundance of Solidago canadensis within the vegetation cover.
The plants with the longest stems were noticed within the stands with 75–100% S. canadensis relative abundance. The stem’s average length significantly decreased simultaneously with the decrease of invasion degree (A versus C p < 0.001; B versus C p < 0.001). The stem weight was, in general, significantly lowest in the plants from the C category of sampling stands (A versus C p < 0.001; B versus C p < 0.001).
The lowest number of all the leaves was observed in the plants from the mildly invaded stands (25–50% S. canadensis representation; A versus C p < 0.05; B versus C p < 0.001). Plants from the stands with mild degree of invasion had significantly lower weight of all leaves (A versus C p < 0.01; B versus C p < 0.01), as well as the single leaf’s weight, in comparison to plants from the A category (A versus C p < 0.01).
In addition, we did not notice the distinctions in the number of assimilating, green, leaves between the A, B, and C categories. However, assimilating leaves from the plants of mildly invaded stands showed significantly lower weight (A versus C p < 0.01; B versus C p < 0.05). Non-assimilating, brown, leaves from the plants of the C category showed a significantly lower count, as well as weight, in comparison to those of A and B categories (number: A versus C p < 0.05; B versus C p < 0.01; weight: A versus C p < 0.01; B versus C p < 0.05).
The plants from the heavily invaded stands had the longest and heaviest inflorescences. However, neither the length nor the weight was significantly different, according to the degree of the invasion.
Generally, no distinctions in the entire plant’s nor stem’s relative water contents were observed between the A, B, and C sampling stands categories. Only all the leaves and inflorescences from the plants of the heavily invaded stands had a significantly higher relative water content in comparison to those from the mildly invaded stands (leaves A versus C p < 0.05; inflorescences A versus C p < 0.05).
2.3. Relative Daily Growth Rate
Relative daily growth rate concerning selected morphological traits was, in general, the highest in the plants from the heavily invaded stands. The highest growth rate of the plant’s height, the entire plant’s weight, and the stem’s weight was noticed in the plants of the A and B categories between 1st/2nd sampling terms (May–-beginning of July). However, in comparison, the plants from the stands with just the mild degree of invasion (25–50%) showed their highest plant’s height, the entire plant’s weight, and stem’s weight daily growth rates to be belated, i.e., between the end of June and the first half of August (2nd/3rd sampling terms) (Figure 2). Belated daily growth rate was also noticed in the inflorescence, when, in plants of the A and B categories, flower weight relative daily growth was the highest between August and September, while, between September and October, it was highest concerning C category plants.
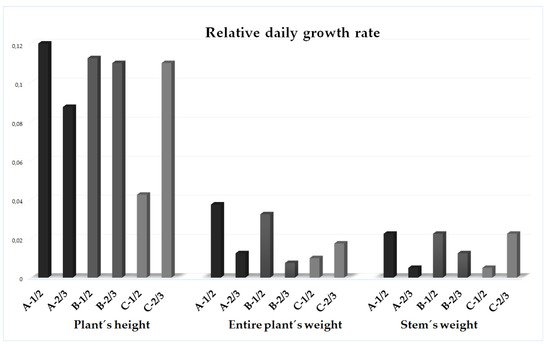
Figure 2. Differences in the relative daily growth rate of the selected morphological traits in relation to degree of Solidago canadensis invasion. Abbreviation and notes: A = heavily invaded stands with 75–100%, B = medial invaded stands with 50–75%, C = mildly invaded stands with 25–50% relative abundance of Solidago canadensis within the vegetation cover; ½—between 1st/2nd sampling terms (May–beginning of July), 2/3—between 2nd/3rd sampling terms (end of June and the first half of August).
The average daily growth rate of all the leaves’ weight was the highest between May and the beginning of July (1st/2nd sampling terms) and from side of the degree of invasion.
3. Essential Oil Productivity Rate
Mean values and standard deviations (+SD) of the EO yields are listed in Table 1, Table 2 and Table 3.
The hydro-distillation of the S. canadensis dry plant material yielded pale yellow oil. In general, the mean EO yield increased continuously till the 4th sampling term (September), when it was the highest, and significantly higher in comparison with every of the other sampling terms. A similar pattern was observed by evaluating the EOs’ yields from the separated plant organs, i.e., stems, leaves, and inflorescences, as well as according to degree of invasion. Generally, the highest average EO yield was obtained from the plants of the heavily invaded stands, while the lowest was obtained from those of the mildly invaded stands (Figure 3a). The mean EO yield obtained from the plants of the A category was significantly higher in comparison to those of the C category (p < 0.01). The highest EOs’ yields were, in general, extracted from the inflorescences, followed by leaves and stems (Figure 3b). The inflorescences’ mean EO yield was, in comparison, also significantly higher (I versus L p < 0.001; I versus L p < 0.001). The same pattern was equally observed within the separated A, B, and C categories.
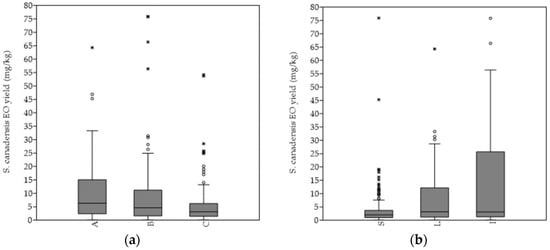
Figure 3. Differences in the essential oil productivity rate according to different Solidago canadensis (a) degree of invasion and (b) plant organs. Abbreviations and notes: A = sampling stands’ category with 75–100%, B = 50–75% and C = 25–50% relative abundance of Solidago canadensis within the vegetation cover; S—stems, L—leaves, I—inflorescences. Boxplot outliers are shown as * and °.
4. Correlations
The plant’s height and overall plant’s weight positively and significantly (p < 0.05) correlated with all other morphological traits. The exception concerned number of all leaves and relative water content of the entire plant. The number of all leaves positively and significantly (p < 0.05) correlated with the stem’s length and weight. Length and weight of the inflorescence positively and significantly correlated with the stem’s weight. The entire plant’s relative water content did not correlate with any morphological traits evaluated.
The stems’ and leaves’ EO yields were mutually correlated with each other.
The stems’ EO yield was negatively and significantly correlated with the entire plant’s relative water content (p < 0.05). The leaves’ EO yield positively and significantly (p < 0.05) correlated with the stem’s length.
Categories of sampling stands did not mutually differ in the variables used for their characterization. However, we observed a significant positive correlation (p < 0.01) between the degree of invasion and soil reaction. Average pH was the highest within the stands with the highest S. canadensis % representation. On the other side, the significant negative correlation (p < 0.05) between the goldenrod relative % abundance and the overall area of sampling stand was detected. The stands with the lowest area had the highest goldenrod coverage, and vice versa.
Concerning relations of morphological traits and EO productivity rate to variables used for the sampling stands characterization, plant’s height, stem’s length, and stem’s weight, as well as inflorescence’s humidity, were significantly (p < 0.01) and positively correlated with relative % abundance of S. canadensis within the vegetation cover, i.e., degree of invasion (Figure 4a). CCA analysis confirmed this ascertainment (Figure 5). The same pattern was observed concerning the soil reaction. The tallest plants, with the longest and heaviest stems, were noticed within the stands with the highest pH, which, concurrently, means those with the highest goldenrod abundance. Conversely, the aforementioned morphological traits significantly and negatively (p < 0.05) correlated with the overall stand’s area (Figure 4b). Only the leave’s weight was correlated with soil humidity, and none of the evaluated morphological traits was correlated with the measure of interventions, i.e., number of mowings.
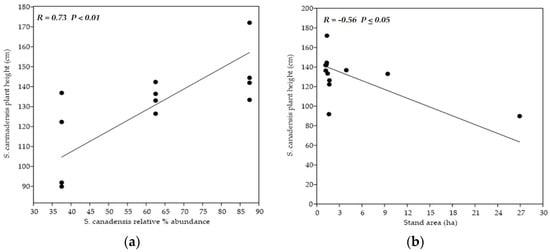
Figure 4. Simple linear regression between Solidago canadensis plant height and two variables. Models display simple linear regression between (a) plant height and the degree of invasion and between (b) plant height and overall area of sampling stands.
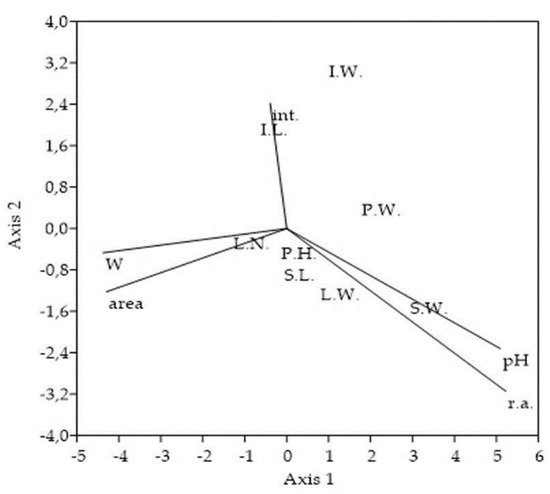
Figure 5. Ordination plot of the selected Solidago canadensis morphological traits and variables used for the sampling stands characterization. CCA ordination triplot shows association of 8 morphological traits to degree of invasion, soil reaction, soil moisture, stand area, and measure of interventions. The cumulative percentage variance of morphological traits-variables relation explained on Axis 1 = 70.26% and on Axis 2 = 20.92%, with eigenvalues for Axis 1 = 0.003 and for Axis 2 = 0.001. Abbreviations and notes: P.H.-plant’s height, P.W.-entire plant’s weight, S.L.-stem’s length, S.W.-stem’s weight, L.N.-all numbers of leaves, L.W.-all leaves weight, I.L.-inflorescence’s length, I.W.-inflorescence’s weight, r.a.-Solidago canadensis relative % abundance within vegetation cover, pH-soil reaction, W-soil moisture, area-overall area of sampling stands, int.-measure of interventions (number of mowings).
Stem and leaf EO yields positively and significantly correlated with the soil reaction (p < 0.05). Moreover, leaf EO yield was positively correlated with the S. canadensis relative % abundance.
This entry is adapted from the peer-reviewed paper 10.3390/plants11040535
This entry is offline, you can click here to edit this entry!