Your browser does not fully support modern features. Please upgrade for a smoother experience.
Please note this is an old version of this entry, which may differ significantly from the current revision.
Subjects:
Agronomy
Over the past decade, the development of new technologies and sensors and sensor minimization has led to the development and improvement of the soil mapping and fertilization process in precision agriculture. Both soil prediction methods based on machine learning and remote sensing data are increasingly utilized in such studies.
- remote sensing
- machine learning
- Fertilization
- precision agriculture
- variable rate technology
1. Modern Approach to Fertilization in Precision Agriculture
1.1. Remote Sensing Data
Novel multispectral and hyperspectral cameras on various platforms, from satellites to drones, enable high spatial and spectral remote sensing data that can be used in continuous agricultural field monitoring. Furthermore, with the development of Synthetic Aperture Radar (SAR; e.g., Sentinel-1) and optical satellite missions (e.g., Sentinel-2, PlanetScope), the Earth’s surface can be observed in high spatial resolution almost on a daily basis [76]. Satellite missions, but also new platforms such as unmanned aerial vehicles (UAVs) have led to the development and improvement of the quality of digital terrain models (DTM) and other important data in precision agriculture, e.g., the canopy height model (CHM). The development of remote sensing technologies and data lead to an increased application in precision agriculture. In the past few years, an increasing number of scientific articles in the field of remote sensing data in precision fertilization have been noted (Figure 1). A significant increase in the use of multispectral, hyperspectral and radar data is present, while the data on digital terrain models in precision fertilization are not growing at such a rate. Although the numbers of research with satellite data are significantly higher than the data obtained by UAV, a rapid growth in UAV application in the last five years has occurred. As in previous research [77], the prevalence of multispectral images is still higher than for radar. With the development of radar imaging technologies [78,79,80,81], mainly in soil moisture assessment, a significant increase in the number of studies in this area in the coming years is expected.
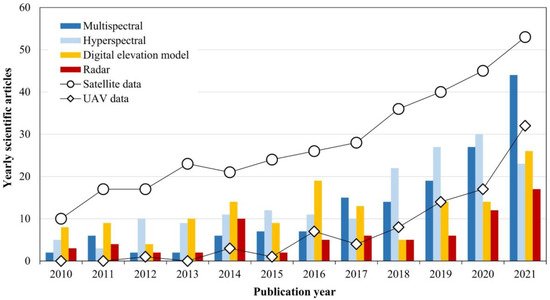
Figure 1. The most frequently used remote sensing data in precision fertilization according to the number of scientific papers indexed in the Web of Science Core Collection database.
The above-mentioned remote sensing technology and sensors enable fast and accurate acquisition of the earth surface data. This data can describe the earth’s surface with 3D (e.g., digital elevation models, digital surface model) or in the 2D data type (e.g., spectral bands, composites) acquired by sensors located on various platforms, e.g., satellite, airplane, or UAV. The acquired data can be used to produce various crucial remote sensing data such as [82]:
- (1) various indices for an improved description of the earth’s surface (e.g., water, vegetation, soil) based on multispectral images or
- (2) various derivatives of the digital elevation models such as slope, curvature, or flow accumulation analysis.
Radar images must be emphasized while they find their application in detecting the amount of moisture in the soil [78,81], which is extremely important in precision agriculture. For example, the most used remote sensing data in precision fertilization for the exact location is shown in Figure 2.
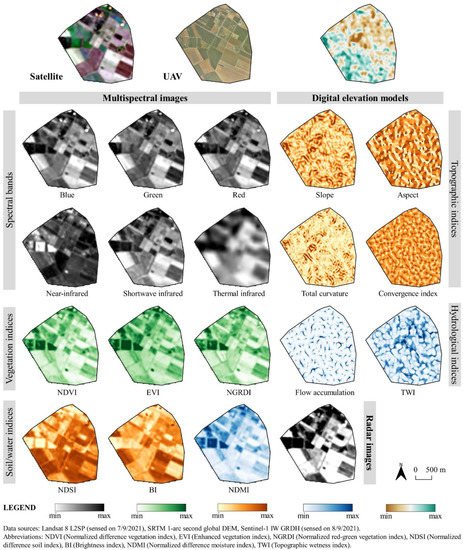
Figure 2. The most widely used remote sensing data in the modern approach to precision fertilization.
1.2. Modern Remote Sensing Methods for Optimal Fertilization in Precision Agriculture
In the recent research [8,14,24,83,84,85], remote sensing methods for assessing precision agriculture and fertilization are divided into two different approaches:
- (1) Multivariate regressions based on various remote sensing data and
- (2) Machine and deep learning methods for predictions.
For many years, authors have used multivariate regressions to model the variables in precision agriculture [83,86]. With the development of remote sensing data, authors have introduced new measurements collected using remote sensing data [83] into the process of multivariate regressions. These data have greatly improved the process of estimating the required variables to create better and more productive crops [87]. Multivariate regressions based on various remote sensing data have greatly improved the estimates of soil parameters for precision fertilization in regards to the conventional spatial interpolation methods.
In the last decade, hardware and computer development have enabled and popularized the application of and development of advanced methods for processing large amounts of spatial data, such as machine learning and deep learning methods [88,89,90,91]. Nowadays, these methods are also often used in remote sensing to quickly and accurately classify large amounts of satellite images to obtain land use and land cover (LULC) maps of the earth’s surface [92,93]. The great importance of the machine and deep learning method lies in the rapid processing of various spatial and attribute data to improve the estimation and prediction of the variable, e.g., estimation of the fertilizer in crops from available satellite images [14,94,95]. Trends of the application of remote sensing methods in precision fertilization based on the research papers in the last decade are shown in Figure 3. Application of the random forest and support vector machine algorithm have shown an increasing trend during the previous five years, while the artificial neural network and decision tree methods applications have stagnated in precision fertilization.
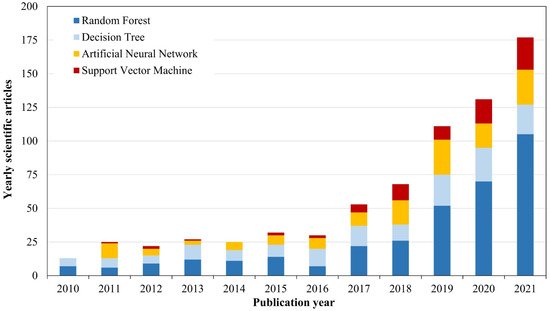
Figure 3. The most frequently used remote sensing methods in precision fertilization according to the number of scientific papers indexed in the Web of Science Core Collection database.
Despite the existing conventional modern remote sensing methods, developing novel hybrid approaches would significantly improve the fertilization process in precision agriculture. Novel hybrid approaches would enable better spatial resolution and more accurate crop and soil conditions assessment, thus improving the fertilization process. The preliminary proposal of a novel hybrid approach is based on remote sensing data such as for vegetation, water and soil spectral indices, a digital elevation model and other remote sensing data (e.g., spectral bands) supported by raster data obtained by conventional spatial interpolation methods. Machine learning methods could quickly and accurately model all the mentioned data based on which of the above can be realized into a real and accurate prediction of the state of crops and soil.
2. A Representative Overview of Modern and Conventional Approaches for Fertilization in Precision Agriculture
To provide a more insightful overview of the efficiency of conventional and modern approaches to precision fertilization beyond the scientific review, a case study for a common agricultural parcel in Croatia was performed. Phosphorous pentoxide (P2O5) and potassium oxide (K2O) were used for the prediction, representing two of the most important soil properties in agricultural fertilization [96]. A total of 121 samples were used in the agricultural parcel of 4.1 km2, representing a micro-location such as in [29,44]. The descriptive statistics of the input soil sample set is presented in Table 1. All predicted results were calculated in a spatial resolution of 30 m, according to the specifications of Hengl [35]. Soil prediction accuracy was assessed using R2 and RMSE, as the most commonly applied interpolation metrics in similar previous studies. The cross-validation using the leave-one-out technique was used for the accuracy assessment.
Table 1. The descriptive statistics of the representative soil sample set used for the comparison of conventional and modern approaches to precision fertilization.
| Soil Property |
Average (mg 100 g–1) |
Value Range (mg 100 g–1) |
CV | SK | KT | Shapiro–Wilk Test | Moran’s I | |
|---|---|---|---|---|---|---|---|---|
| W | p | |||||||
| phosphorous pentoxide (P2O5) |
23.2 | 8.9–41.0 | 0.364 | 0.587 | –0.592 | 0.941 | 0.0005 | 0.209 |
| potassium oxide (K2O) |
26.1 | 17.2–50.5 | 0.253 | 1.517 | 3.092 | 0.877 | < 0.0001 | 0.124 |
OK, as the most commonly applied geostatistical interpolation method, along with IDW, its deterministic counterpart, were used for the representation of the conventional prediction methods in fertilization. As the range of the OK interpolation is conditioned by spatial autocorrelation of the input values, some of the most commonly used mathematical models in previous studies were evaluated, as the primary parameter of the OK interpolation. Analogously, the most common power parameters of the IDW were evaluated. Due to the lack of data normality, a logarithmic transformation was performed in the preprocessing to OK interpolation.
Comparative displays of interpolation results produced by conventional interpolation methods for P2O5 and K2O on the representative soil sample set are shown in Figure 4 and Figure 5. The interpolation results for both soil properties indicated a strong dependence of the prediction accuracy on the input parameters, indicating the importance of evaluating multiple methods, as well as their parameters, as noted in [47]. The R2 of the OK ranged from 0.331 to 0.414 for the P2O5 and from 0.082 to 0.120 for the K2O, indicating a proportionally lower accuracy for the input values with lower spatial autocorrelation, which is one of the main constraints of its prediction accuracy [97]. Due to its deterministic nature, IDW was resistant to this property, with its interpolation accuracy ranging from 0.233 to 0.405 for the P2O5 and from 0.234 to 0.374 for the K2O. It generally produced a lower accuracy but with a more balanced approach regarding sensitivity to the input values, as noted in [29]. Besides varying the interpolation accuracy, the resulting value ranges and CV values were severely affected by the selection of the interpolation method and its parameters.
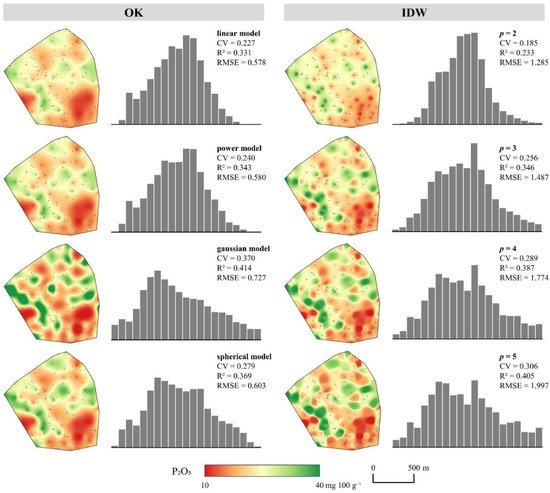
Figure 4. Comparative presentation of interpolation results using common parameters of OK and IDW for P2O5.
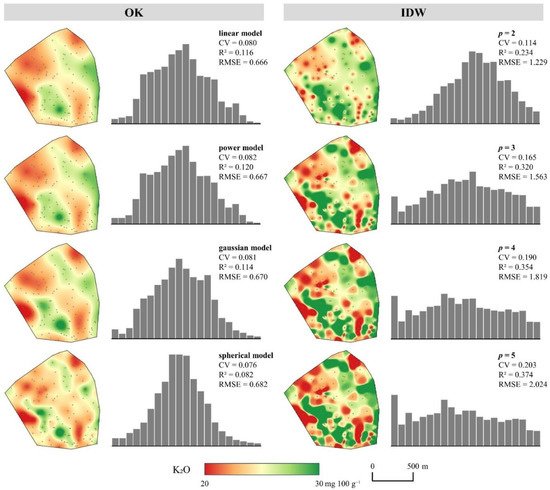
Figure 5. Comparative presentation of interpolation results using common parameters of OK and IDW for K2O.
A total of twelve relevant covariates for the P2O5 and K2O prediction used as the basis of the modern prediction approach are presented in Table 2. These were defined with accordance to the specifications of soil mapping by Hengl and MacMillan [98] and which were used in similar soil prediction studies recently [66,73,82]. Six covariates were derived from a digital elevation model and six from Landsat 8 images, fully based on freely and widely available data. These covariates for the area covering the representative soil sample set are visually represented in Figure 1. Four of the most commonly applied machine learning methods in previous studies indexed in the WoSCC were used: random forest (RF), support vector machine (SVM), artificial neural networks (ANN) and decision tree (DT). These methods gained popularity in the modern approach to fertilization recently, allowing the integration of big data, that is highly accurate and with a computationally efficient prediction [53].
Table 2. Covariates used for the modern prediction using the representative soil sample set for precision fertilization.
| Data Source | Environmental Segment | Covariate | Reference |
|---|---|---|---|
| digital elevation model (EU-DEM v1.1) |
morphometry | slope | [99] |
| aspect | |||
| total curvature | |||
| convergence index | |||
| hydrology | flow accumulation | [100] | |
| topographic wetness index | [101] | ||
| multispectral satellite images (Landsat 8, sensed on 15th September 2021) |
vegetation | normalized difference vegetation index (NDVI) | [102] |
| enhanced vegetation index (EVI) | [103] | ||
| normalized green-red vegetation index (NGRDI) | [104] | ||
| soil | normalized difference soil index (NDSI) | [105] | |
| brightness index (BI) | [106] | ||
| moisture | normalized difference moisture index (NDMI) | [107] |
A comparative display of the modern soil prediction approach for fertilization in precision agriculture, along with the most accurate results of the conventional approach are displayed in Figure 6. Besides an improved prediction accuracy and resistance to the particular properties of input sample values, the modern approach included more soil heterogeneity in the result with higher CV values. Previous studies have also noted a superior prediction accuracy of the modern approach compared to conventional methods, especially in the cases of lower spatial autocorrelation indicated by high nugget values [38]. Besides the spectral indices and topographic indicators, which are applicable at both minor- and major-scales [82], climate data and auxiliary soil information are commonly included in the modern approach [73]. These values are generally more suitable for the macro-location studies due to their local homogeneity, as well as the lack of available spatial data at the higher spatial resolution to match those of satellite images and DEMs [2]. Despite the same spatial resolution of the P2O5 and K2O rasters produced by the conventional and modern approaches, modern machine learning methods have resulted in much less smooth areas, retaining specific local information about field conditions, which are a backbone for precision agriculture [7]. Chen et al. [37] noted the improved spatial resolution as one of the key advantages of the modern approach over the conventional interpolation methods, alongside improved prediction accuracy and time- and cost-efficiency.
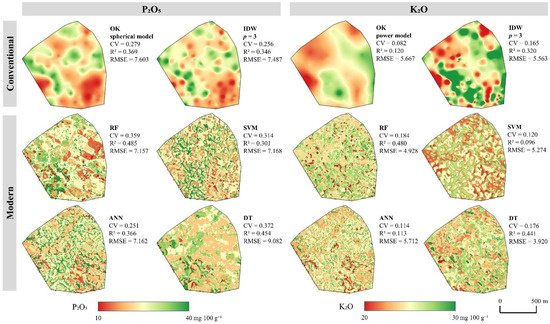
Figure 6. A comparative display of the modern soil prediction with the most accurate results of the conventional approach on a representative soil sample set.
This entry is adapted from the peer-reviewed paper 10.3390/rs14030778
This entry is offline, you can click here to edit this entry!