Your browser does not fully support modern features. Please upgrade for a smoother experience.
Please note this is an old version of this entry, which may differ significantly from the current revision.
Subjects:
Biochemistry & Molecular Biology
Published in Antioxidants 2022, 11(2), 278 https://doi.org/10.3390/antiox11020278
This study elucidates the effects of ferroptosis on the metabolome in H9c2 cardioblasts by gas chromatography-mass spectrophotometry (GC-MS).
- ferroptosis
- cardiomyocytes
- metabolome
- mitochondria
- glutaminolysis
- anti-ferroptotic compounds
- ferrostatin-1
- XJB-5-131
- TSM-1005-44
1. Introduction
Ferroptosis is a newly discovered iron-dependent non-apoptotic programmed cell death pathway. It is characterized by the accumulation of oxidized phospholipids due to the excessive oxygenation of polyunsaturated fatty acid (FA) residues of phospholipids by lipoxygenases and the limited capability of glutathione peroxidase 4 (GPX4) to neutralize oxidized phospholipids [1,2,3,4]. Mitochondria are the main source of reactive oxygen species (ROS); electron transport chain (ETC) complexes, monoamine oxidase, α-ketoglutarate dehydrogenase, NADPH oxidase 4, among others, produce superoxide (•O2−), which is reduced to hydrogen peroxide (H2O2) upon interacting with superoxide dismutase [5]. Normally, catalase and H2O2-specific glutathione peroxidases convert H2O2 into H2O; however, under pathological stimuli, free redox-active iron becomes available in the cytosol. Redox-active iron through the Fenton reaction further increases the accumulation of ROS and activates lipoxygenases, particularly 15-lipoxygenases. The latter stimulates oxidation of free polyunsaturated FA esterified into phospholipids followed by membrane damage, thus leading to ferroptosis [1,2,6].
Although there are eight isoforms of GPX enzymes, early studies have identified the inhibition of the GPX4 isoform to be the main contributor of ferroptosis due to its ability to reduce oxidized phospholipids, such as phosphatidylethanolamine hydroperoxides, FA hydroperoxides, and cholesterol, among others [4]. GPX4 reduces the hydroperoxy-phospholipids to stable hydroxy-phospholipids at the expense of reduced glutathione (GSH), which is oxidized in the process. GSH is a tripeptide produced from cysteine, glycine, and glutamate in the cytoplasm. Cysteine enters the cell through the cystine-glutamate exchanger known as the antiporter system xc-. Inhibition of cysteine import and depletion of the cellular GSH pool by system xc- inhibitors (e.g., erastin) have been shown to impair GPX4 function, leading to ferroptosis [4]. Another classic inducer of ferroptosis is the RAS-selective lethal 3 (RSL3), which promotes ferroptosis through the direct inhibition of GPX4 activity [7].
Recent studies suggested a direct link between ferroptosis and coronary heart diseases, particularly myocardial infarction and ischemia-reperfusion, in animal models and patients [8,9,10,11,12]. However, the mechanisms of ferroptosis signaling in the heart remain unknown, which represents a challenge for the development of new therapeutic strategies for coronary heart diseases. Inhibition of ferroptosis by the synthetic antioxidant ferrostatin-1 (Fer-1) demonstrated strong protective effects against cell death in cultured cardiomyocytes and isolated perfused hearts [8,9,10,12,13]. Fer-1 inhibits lipid peroxidation more effectively than other phenolic antioxidants since it scavenges alkoxyl radicals without being consumed in the process and then is regenerated by ferrous iron, reducing back the Fer-1 radical [14]. Furthermore, oxidized phosphatidylethanolamine, the major ferroptotic signaling phospholipid, was visualized in cultured H9c2 cardiomyocytes [15]. These studies suggest that the target components involved in ferroptosis are localized in cardiomyocytes. Ferroptosis induces significant alterations in cellular metabolism, including metabolites that are required for GSH synthesis and are involved in the synthesis of tricarboxylic acid (TCA) cycle intermediates in mitochondria [13,16]. In addition, lipid metabolism plays a regulatory role in cell death [17]. Monounsaturated FA, such as oleic and palmitoleic acids have been shown to potently suppress the toxic environment caused by lipid peroxidation in the plasma membrane, hence inhibiting ferroptosis [17]. On the other hand, saturated membrane lipids were less sensitive to oxidative stress in cancer cells, suggesting that high levels of the different saturated membrane phospholipids can protect against oxidative damage [18]. Altogether, these studies highlight the importance of evaluating the levels of different cell metabolites that can be affected during ferroptosis.
Mitochondria play a central role in the pathogenesis of human diseases [19]. They contain the main components and enzymes of the ferroptotic machinery, such as lipoxygenase, GPX4, GSH, glutamate, and iron. Mitochondria do not synthesize GSH and are therefore dependent on the synthesis of cytosolic GSH [20,21]. However, glutamate, a product of glutaminolysis in mitochondria, maintains the intracellular cysteine levels through the activation of the antiporter system xc− and thus, the cellular GSH pool. Glutaminolysis is a metabolic pathway that involves the initial deamination of glutamine by glutaminase C (GAC), a K-type mitochondrial glutaminase (GLS), which is highly expressed in the heart and pancreas [22,23]. Furthermore, besides GSH precursors, the role of other cellular and mitochondrial metabolites that could be altered in response to the ferroptotic stimuli remains vaguely understood.
2. The Effects of RSL3 on Cell Death
First, we established optimal concentrations of XJB and TSM that could exert maximum anti-ferroptotic effects in H9c2 cells. The cells were exposed to a ferroptotic stimulus by treatment with RSL3 (0.5 µM) for 3 h in the absence and presence of XJB or TSM in a concentration range from 0.1 to 1 µM. Results showed that XJB reached a maximum protective effect at 0.1 µM (Figure 1A), whereas TSM demonstrated the highest protection starting at 0.6 µM (Figure 1B). Next, based on the LDH activity in the cell culture medium to assess cell death, we determined an optimal exposure time in which H9c2 cardiomyocytes developed ferroptosis once exposed to RSL3. The cells were incubated with 0.5 µM RSL3 for 1, 2, and 3 h in the absence and presence of Fer-1, XJB, or TSM (Figure 2). Incubation of the cells with RSL3 for 1 and 2 h had no significant effects on cell survival, as evidenced by no significant differences in LDH activity between control and RSL3-treated groups. However, RSL3 induced approximately a 2.3-fold increase (p < 0.001) in LDH activity after 3 h of incubation compared to the control. Fer-1, XJB, and TSM protected the cells against RSL3-induced cell death and prevented LDH release to the culture medium. The antioxidants alone (no RSL3-treatment) had no detrimental effects on the cells (Figure S1).

Figure 1. The effects of XJB and TSM on ferroptosis in H9c2 cells. Different concentrations of XJB (A) and TSM (B) in the presence or absence of 0.5 µM RSL3. Cell death was calculated from the measurements by the Alamar Blue cell viability assay, and data are presented as a percentage of the control. GPX4 protein levels were calculated based on densitometry analysis using LI-COR Image Studio Lite and normalized to β-actin expression for each band. Data are presented as a percentage of the control group. ++ p < 0.01 vs. control; * p < 0.05 and ** p < 0.01 vs. RSL3. n = 3 per group.
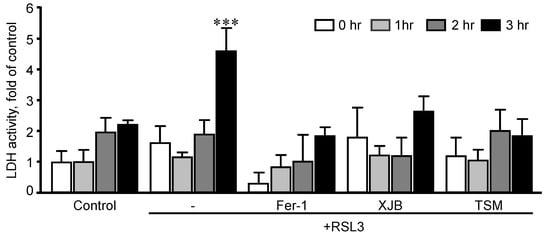
Figure 2. Time-dependence analysis of RSL3-induced cell death in H9c2 cells. LDH activity as a marker of cell death was measured in the culture medium containing H9c2 cells that were exposed to 0.5 µM RSL3 for 1, 2, and 3 h, in the presence and absence of 1 µM Fer-1, 0.2 µM XJB, or 0.6 µM TSM. Data were normalized to the control for each time-point and presented as a fold increase. *** p < 0.001 vs. control. n = 3 per group.
3. Identification of Metabolites
To identify and quantify cellular metabolites, cell lysates obtained from H9c2 cardioblasts after incubation with 0.5 µM RSL3 for 3 h in the absence and presence of Fer-1, XJB, and TSM were processed through GC-MS. A total of 52 metabolites were identified and classified in the following groups: amino acids (44%), TCA metabolites (11%), saturated FA (9%), unsaturated FA (6%), pyrroline carboxylic acids (6%), and 2% of pyrimidines, secondary, and sugar alcohols, short-chain acids, and cholesterol, among others (Figure 3A). The characterization of each identified metabolite, including chemical names, fragment ions, retention time, and classification, is detailed in Table S1, whereas information regarding the statistics that include the p.values and fold of change can be found in Table S2. The heatmap shows the results obtained from univariate analysis of metabolite concentration samples, considering the intensity of the color, as discrete variables (−2 to 2), by assorting them in bins (Figure 3B). The conditions (in the abscise axis) and the bins/metabolites (in the ordinate axis) have been arranged according to the Ward-clustering method. The fold change is color-coded according to the bar legend: a red/green value in the heatmap indicates an increase/decrease in average concentrations of the metabolites. The heatmap shows data clusters based on group similarities in which two superior clusters were identified. The first group contains only metabolites in the presence of RSL3, and the second group (control, TSM, RSL3 + XJB, Fer-1, RSL3 + TSM, RSL3 + Fer-1, and XJB) was clustered based on their data value proximity. Data shows the similarities of metabolites between the control and TSM; together with RSL3 + XJB, and Fer-1 with RSL3 + TSM. The latter altogether compares to a separate cluster containing RSL3 + Fer-1 and XJB. These results show how the RSL3-challenged group separates from the rest, indicating significant up- or downregulation of metabolites during ferroptosis. Interestingly, the control group shares a similar metabolite concentration with the TSM-treated group, while RSL3 + Fer-1 and XJB groups differentiate from RSL3 with the most distance, indicating opposing metabolite regulation compared to RSL3 alone. A one-way ANOVA followed by a post hoc test analysis revealed a total of 22 metabolites that had statistically significant differences in their concentrations between the treatment groups and the control. After performing Bonferroni correction, 12 metabolites were identified with a new p-value being p = 0.0022: stearic acid, glycolic acid, succinate, proline, palmitic acid, azelaic acid, beta-alanine, aspartic acid, glycine, alanine, (2R)-pyrrolidine 1,2-dicarboxilic acid [shown as (2R)-pyrrolidine in Figure 3B and Supplementary Materials], and lysine (Table S3). Particularly, in comparison with the control group, RSL3-treated metabolites’ concentration was increased in azelaic, glycolic, palmitic, and stearic acid, and decreased the levels of other metabolites. No changes were found in groups treated with RSL3 in combination with Fer-1 and TSM compared to the control. RSL3, in combination with TSM, decreased the concentrations of azelaic, glycolic, palmitic, and stearic acid slightly; and the same effect was observed in Fer-1 alone. XJB reduced the levels of all metabolites except azelaic, glycolic, palmitic, and stearic acid. In contrast, RSL3 supplemented with XJB reduced proline, (2R)-pyrrolidine 1,2-dicarboxilic acid, alanine, beta-alanine, glycine, and aspartate.
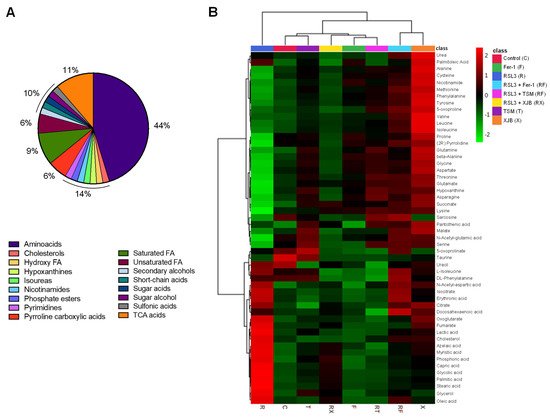
Figure 3. The metabolome of H9c2 cells exposed to ferroptosis. The constituent ratio of the 52 metabolites is identified by class (A). Heatmap for the different conditions as compared to the control and RSL3 displaying average metabolites concentration (mM) for each group (B). The conditions (in the abscise axis) and the bins/metabolites (in the ordinate axis) have been sorted according to cluster analysis. The fold change is color-coded according to the bar legend. C, control; R, RSL3; F, Fer-1; X, XJB; T, TSM; RF, RSL3 + Fer-1; RX, RSL3 + XJB; RT, RSL3 + TSM. Green represents lower concentration; red represents higher concentrations. n = 4–6 per group.
4. Effects of Ferroptosis on Cell Metabolites
4.1. GSH Precursor Amino Acids
Taking into consideration the important role that GSH plays in the development of ferroptosis, we sought to evaluate the precursor metabolites of GSH, which are glycine, cysteine, glutamate, and glutamine, and its degradation byproducts (5-oxoproline) (Figure 4). RSL3 decreased glycine, cysteine, and glutamine levels by 60% (p < 0.05), 64% (p < 0.001) and 76% (p < 0.05), respectively, compared to the control. No effects were observed in glutamate and 5-oxoproline levels in the presence of RSL3. Treatment with Fer-1 increased glycine, cysteine, and glutamine by 93% (p < 0.01), 94% (p < 0.05) and 141% (p < 0.001), respectively, in the presence of RSL3, with no changes in glutamate and 5-oxoproline. Additionally, XJB increased the levels of glutamine by 81% (p < 0.05). Similarly, to Fer-1, TSM significantly increased the levels of glycine by 96% (p < 0.01) and glutamine by 197% (p < 0.001) with no changes in other associated metabolites.
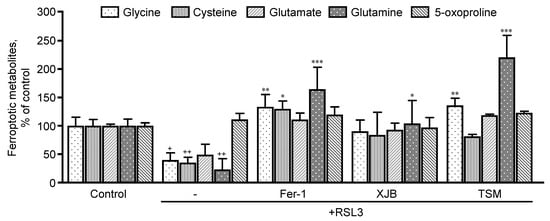
Figure 4. Precursor metabolites of GSH metabolism. Glycine, cysteine, glutamate, and glutamine represent GSH precursors, while 5-oxoproline is a marker of GSH degradation within the cell. Data are presented as a percentage of the control group. + p < 0.05, ++ p < 0.01 vs. control; * p < 0.05, ** p < 0.01 and *** p < 0.001 vs. RSL3. n = 4–6 per group.
4.2. Fatty Acids
Next, we evaluated the effects of ferroptosis in saturated and unsaturated FA. Analysis of saturated FA revealed that RSL3 increased the levels of capric, myristic, palmitic, and stearic acids by 184% (p < 0.001), 83% (p < 0.05), 126% (p < 0.001) and 153% (p < 0.001), respectively, compared to the control group (Figure 5A). However, treatment of the cells with Fer-1, XJB, or TSM significantly attenuated the effects of RSL3 on the saturated FA levels that were similar to the control group. Unsaturated FA exhibited a certain trend of increasing in RSL3-challenged cells, although the effect was not statistically significant (Figure 5B).
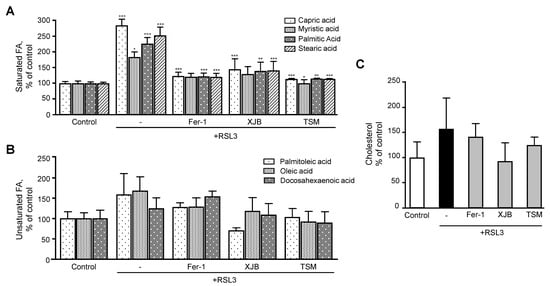
Figure 5. Fatty acids and cholesterol levels after ferroptosis. (A) Saturated FA. (B) Unsaturated FA. (C) Cholesterol. Data are presented as a percentage of the control group. + p < 0.05 and +++ p < 0.001 vs. control; * p < 0.05, ** p < 0.01 and *** p < 0.001 vs. RSL3. n = 4–6 per group.
4.3. TCA Metabolites
RSL3 induced significant changes in the levels of TCA intermediates, including citrate, isocitrate, 2-oxoglutarate, succinate, fumarate, and malate (Figure 6A). RSL3 increased isocitrate and 2-oxoglutarate levels by 130% (p < 0.01) and 73% (p < 0.05), respectively, compared to the control, whereas the level of succinate was decreased by 55% (p < 0.001). RSL3 had no significant effects on other TCA intermediates. Treatment with Fer-1, XJB, and TSM attenuated RSL3-induced changes in TCA metabolites, particularly, isocitrate, 2-oxoglutarate, and succinate levels. Treatment with Fer-1 and TSM decreased 2-oxoglutarate levels by 58% (p < 0.05) and 76% (p < 0.05), respectively, compared to the RSL3 group. Likewise, RSL3-induced increase in isocitrate levels was completely prevented in the presence of TSM. All three antioxidants significantly increased the levels of succinate in RSL3-challenged cells by 140% (p < 0.01), 130% (p < 0.01), and 113% (p < 0.05) for Fer-1, XJB, and TSM, respectively. Fumarate levels were decreased by 52% (p < 0.05) and 57% (p < 0.05), respectively, in Fer-1- and TSM-treated cells compared to the RSL3 group (Figure 6A). Thus, we observed significant changes in the levels of TCA metabolites induced by RSL3 that were ameliorated in the presence of Fer-1, XJB, and TSM.
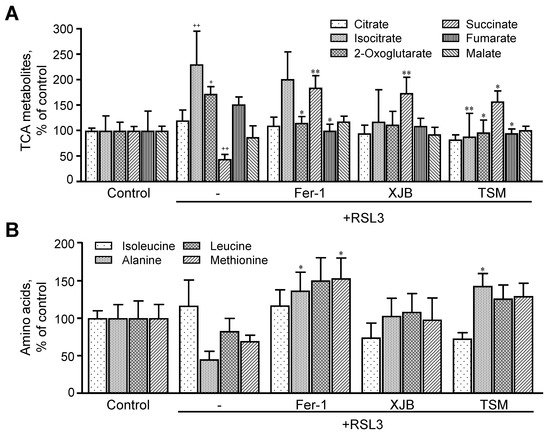
Figure 6. TCA metabolites and amino acids levels after ferroptosis. The TCA metabolites (A) identified were citrate, isocitrate, 2-oxoglutarate, succinate, fumarate, and malate. The amino acids represented are isoleucine, alanine, leucine, and methionine (B). Data are presented as a percentage of the control group. + p < 0.05, ++ p < 0.01 vs. control; * p < 0.05 and ** p < 0.01 vs. RSL3. n = 4–6 per group.
4.4. Amino Acids
Thereafter, we evaluated the effect of ferroptosis on the level of amino acids (isoleucine, alanine, leucine, and methionine) that are related to energy metabolism. We found that RSL3 did not change the levels of these amino acids compared to the control group (Figure 6B). However, treatment with Fer-1 significantly increased the levels of alanine by 36% (p < 0.05) and methionine by 53% (p < 0.05), compared to RSL3, with no changes in isoleucine and leucine. XJB did not affect the levels of any of the metabolites, whereas treatment with TSM significantly increased the levels of alanine by 43% (p < 0.05) in RSL3-challenged cells, with no changes in isoleucine, leucine, and methionine.
5. Glutaminolysis Is Involved in Ferroptotic Signaling in Mitochondria
In this section, we examined the effect of glutaminolysis in mitochondria isolated from H9c2 cardiomyocytes exposed to ferroptosis, and the activity of LDH in the medium was measured to estimate cell death at 1 and 3 h. First, the expression of the mitochondrial glutaminase GAC in the cells was silenced with a GLS1 siRNA. Control (NC, non-coding siRNA-treated) and GLS1 knockdown cells were incubated with 0.5 µM RSL3 to induce ferroptosis, in the absence or presence of 1 µM Fer-1. Results showed a 51% (p < 0.05) reduction of GAC protein levels in the cells treated with GLS1 siRNA compared to NC cells (Figure S4). Analysis of LDH release in NC showed no changes in LDH activity compared to the control at 1 h. However, in GLS1 knockdown cells, LDH activity was reduced in the RSL3 group, compared to NC. (Figure 7A). In contrast, the activity of LDH from RSL3-challenged cells was significantly increased compared to the control in both NC and GLS1 knockdown cells after 3 h of incubation (Figure 7B). Likewise, GSH levels were higher in GLS1 knockdown cells in response to RSL3 at 1 h; however, the effects were lost at 3 h of incubation (Figure 7C,D). These data suggest that glutaminolysis is involved only at the early stage (1 h) of ferroptotic signaling.
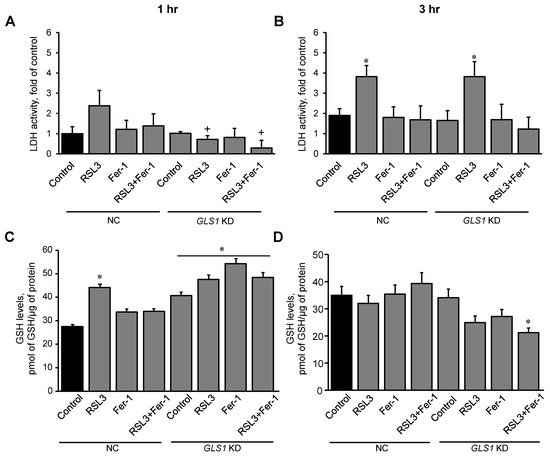
Figure 7. RSL3-induced cell death and GSH levels in GLS1 KD H9c2 cells after ferroptosis. H9c2 cells from non-coding (NC) and GLS KD groups were incubated in the presence and absence of 0.5 µM RSL3, 1 µM Fer-1, or both for 1 (A) and 3 h (B). LDH activity, as a marker of cell death, was measured in the culture medium containing H9c2 cells. Results were normalized to the control. GSH was quantified in mitochondria isolated from the cells after 1 hr (C) and 3 hr (D) of incubation. Data were normalized to a standard curve of GSH which ranged 1-10 µM. * p < 0.05 vs. control (NC), + p < 0.05 vs. RSL3 (NC). n = 3 per group.
This entry is adapted from the peer-reviewed paper 10.3390/antiox11020278
This entry is offline, you can click here to edit this entry!
