Your browser does not fully support modern features. Please upgrade for a smoother experience.
Please note this is an old version of this entry, which may differ significantly from the current revision.
Subjects:
Immunology
Trigonella foenum-graecum (Fenugreek) is a valuable medicinal plant belonging to the Fabaceae family. Plant seeds are mostly used in Asian, African, and Mediterranean countries as major ingredients of daily diets and in domains such as cosmetics, fragrances, beverages, nutrition, medicine and industry. The major pharmacological attributes of fenugreek are hypotensive, antioxidant, antiviral, anticarcinogenic, galactagogue, laxative, febrifuge, carminative, anticholesterolemic, antimicrobial, etc.
- T. foenum-graecum
- air pouch inflammation
- antioxidants
- oxidative stress markers
- cellular infiltration
- lipid peroxidation
- peritonitis
1. Introduction
Inflammation is the protective response of the body to noxious stimuli, microbes, and chemicals or irritants [1]. It causes change in vascular permeability, blood flow alteration and increased migration of leucocytes to the inflammatory area, and results in pain, heat, redness, swelling and functional failure of the affected tissue [2]. Several pathological processes, including arthritis, diabetes, cancer, and other severe inflammatory conditions, are usually characterized by pain and inflammation [3]. Although several antioxidant, antinociceptive, and anti-inflammatory medicines are available, these drugs are arguably inaccessible, costly, less effective, and have multiple side effects [4]. Non-conventional medicines occupy a significant place in healthcare systems, as more than 80% of people worldwide depend on them for their daily healthcare requirements, particularly in Asia and Africa [5].
Trigonella foenum-graecum (Fenugreek) is a valuable medicinal plant belonging to the Fabaceae family [6]. Plant seeds are mostly used in Asian, African, and Mediterranean countries as major ingredients of daily diets and in domains such as cosmetics, fragrances, beverages, nutrition, medicine and industry [7]. The major pharmacological attributes of fenugreek are hypotensive, antioxidant, antiviral, anticarcinogenic, galactagogue, laxative, febrifuge, carminative, anticholesterolemic, antimicrobial, etc. [8,9]. Overproduction of nitrogen and reactive oxygen species, as well as insufficient quenching/stabilization in the body, causes oxidative stress, which destroys important biomolecules (nucleic acids, lipids, and proteins) [10]. Several human diseases, including cardiac disorders, diabetes, cancer, inflammation, and neurodegenerative diseases, are exacerbated or triggered by oxidative damage to these biological molecules [11]. Plant-derived natural products, particularly polyphenolics, and related antioxidant phytochemicals have a diverse range of bioactivities, including anti-inflammation, owing to their ability to quench and alleviate oxidative stress in biological systems, thus restoring health [12]. As a result, the latest research focus has switched towards plant-based natural products as one of the most encouraging sources of curative agents of inflammation and pain [13].
Plants are an abundant source of bioactive compounds, including phenolics, phenolic acids, simple phenolics, flavonoids, derivatives of hydroxycinnamic acid, and anthocyanins [14]. Based upon their physiological properties, including scavenging of free radicals, as well as antimutagenic, anti-inflammatory, and anti-carcinogenic effects, phenolic compounds of different classes continue to attract much scientific attention [15]. Previously, anti-inflammatory properties of T. foenum-graecum have been reported against the carrageenan-induced paw edema model of inflammation, but there is no report available against carrageenan-induced air pouch inflammation and carrageenan-induced peritonitis. The antioxidant effects of polyphenolics are mainly due to their redox potential, serving as hydrogen donors, potent reducing agents, metal chelators, along with singlet oxygen quenchers [16,17,18]. Several phenolics and flavonoids have been demonstrated to have significant effects on the functioning of the immune system, including inflammatory processes [19]. Quercetin, luteolin, hesperidin, and apigenin are flavonoids containing potential anti-inflammatory activities [20].
2. Screening of Phytochemicals through HPLC-DAD
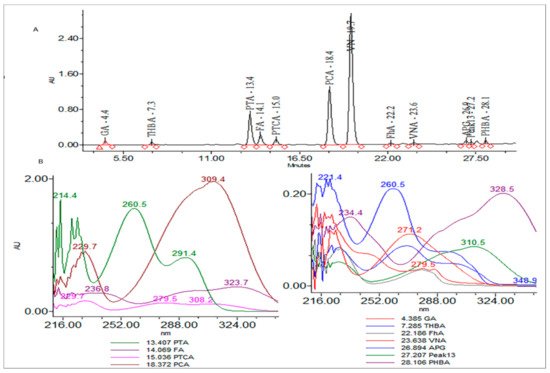
T. foenum extract was characterized for its bioactive constituents through HPLC-DAD using operating conditions previously discussed in the materials and method section (Figure 1). During the analysis, 13 compounds were identified in plant extract that were mostly phenolic acids and flavones. Peak 1 was identified as gallic acid having a response intensity of 0.17 AU (absorption unit), provided in Figure 1. When this peak was extracted for the PDA (photodiode array detector) spectrum, it showed lambda maximum (λmax nm) at 271.2 and 214.6 nm, which corresponds to a standard spectrum as well as the NIST library. The purity of the peak was also assured through the 3D spectrum as well as measuring the purity angle and purity threshold of the peak, which are given in Figure 2 as well as Table 1. The concentration of gallic acid was measured by comparing the area under the peak in comparison to the area under the peak of standard and determined 117.6 ± 1.5 mg/100 g DW. The other peaks that appeared in the chromatogram of the sample were investigated for their identification and quantification by comparison with the standards run as well as the NIST library, and the results are summarized in Table 1. The most abundant antioxidant and antimicrobial compound found was p-coumaric acid with a concentration of 256.7 ± 6.8 g/100 g of DE followed by ferulic acid 168.4 ± 1.8 g/100 g of DE. The results were in agreement with previous reports by [47,48], who reported the abundance of p-coumaric acid in plant extracts. The identification of phytochemicals indicates that antioxidant and other biological properties of extract could be due to the presence of these bioactive compounds. Almost all the phenolic acids identified have a hydroxyl group that could be responsible for the scavenging potential of these compounds [49]. Peaks of the chromatogram were identified through comparison with standards as well as the match index of the UV-visible spectrum of each peak using the NIST library. The identified compounds were presented in order of their elution on the reverse phase column.

Figure 1. (A) Chromatogram of high-pressure liquid chromatography equipped with diode array detector (HPLC-DAD) at 280 nm and (B) extracted spectrum (200–400 nm) of each peak.

Figure 2. Purity plots of representative peaks, (A) gallic acid, and (B) trihydroxybenzoic acid.
Table 1. High-pressure liquid chromatography equipped with diode array detector (HPLC-DAD) summary results of each peak.
| Peak No. | Compound Name | Retention Time | ʎmax (nm) | Concentration mg/100 g DW |
|---|---|---|---|---|
| 1 | Gallic acid (GA) | 4.4 | 271.2, 214.6 | 117.6 ± 1.5 |
| 2 | Trihydroxybenzoic (TBHA) acid | 7.3 | 260.5, 221.4 | 112.6 ± 5.6 |
| 3 | Protochateuic acid (PTA) | 13.4 | 291.4, 260.5, 214.4 | 103.8 ± 2.4 |
| 4 | Ferulic acid (FA) | 14.1 | 323.7, 236.8 | 168.4 ± 1.8 |
| 5 | Protocatechualdehyde (PTCA) | 15.0 | 308.2, 279.5, 229.7 | 98.4 ± 2.3 |
| 6 | p-coumaric acid (PCA) | 18.4 | 309.4, 229.7 | 256.7 ± 6.8 |
| 7 | Vanillic acid (VN) | 19.7 | 279.5, 246.4 | 57.9 ± 2.4 |
| 8 | Protocatechualdehyde (PhA) | 22.2 | 280.6, 224.3 | 116.8 ± 1.9 |
| 9 | Vaniline (VNA) | 23.6 | 87.5 ± 2.4 | |
| 10 | Apigenic acid (APG) | 26.9 | 294.6, 261.7, 219.8 | 117.7 ± 3.6 |
| 13 | Syringic acid (peak 13) | 27.2 | 310.5, 222.5 | 95.6 ± 11.3 |
| 14 | p-hydroxybenzoic acid (PHBA) | 28.1 | 328.5, 234.4 | 113.7 ± 3.8 |
3. UHPLC-Q-TOF Chromatogram of T. foenum
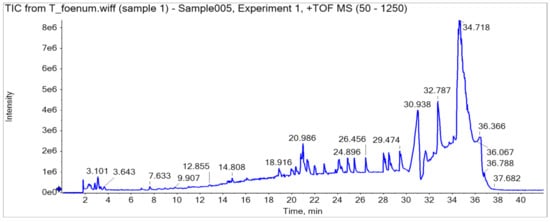
HPLC analysis of plant extract led to the identification and quantification of 13 phenolics, and samples were further characterized through LC-MS/MS (Q-TOF) profile (a detailed description is provided in Table 2, Figure 3). A total ion current (TIC)-based chromatogram of plant extract of T. foenum is presented in Figure 2, and the precursor ion of each peak was further processed for fragmentation pattern (MS/MS) and compared with the NIST library as well as literature reported for the identification of phytochemicals present in the sample. The results are summarized in Table 2, which described each component with retention time in order of their elution order and fragmentation pattern. Although numerous peaks were recorded in the chromatogram, we reported almost 18 compounds, which were identified through the NIST library or literature. MS profiling of peak 1 (RT 2.34 min) produced a parent ion peak at [M − H]+ m/z 441.0840 Da and daughter ions 251.0365, 233.0297 and 124.9848 Da, which corresponds to catechin gallate, and its fragmentation pattern revealed it would be catechin 3-O-gallate. MS spectra are provided in Supplementary Materials Figure S1. The other peaks appeared in chromatogram were also processed for MS1 as well as MS2 at both positive and negative ion mode, and the results were compared with literature and are described in Table 2. Almost 18 compounds were confirmed through literature and their detailed description is provided in Supplementary Materials Figures S1–S17.

Figure 3. UHPLC-Q-TOF chromatogram of T. foenum.
Table 2. Ultra-high-pressure liquid chromatography equipped with electrospray ionization-quadrupole time-of-flight mass detector (UPLC-ESI-Q-TOF-MS/MS) characterization of phytochemicals of T. foenum.
| Serial# | Compound Detected | Retention Time (min) | MS | M − H (Predicted) | M − H (Found) | MS2 | Formula | Reference |
|---|---|---|---|---|---|---|---|---|
| 1 | Catechin 3-O-gallate | 2.34 | 442.09 | 441.0827 | 441.0840 | 251.0365, 233.0297, 124.9848 |
C22H18O10 | [49,50] |
| 2 | 4-O-methylepigallocatechin | 11.20 | 320.0896 | 321.1569 | 321.1468 | 303.1364, 241.1007 | C16H16O7 | [50,51,52] |
| 3 | Sativanone | 12.84 | 300.1398 | 299.1425 | 299.1474 | 283.1462, 223.0883, 179.0974 | C17H16O5 | [50,52] |
| 4 | Gallic acid | 13.36 | 170.12 | 169.1345 | 169.1342 | 125.4622 | C7H6O5 | [50,52] |
| 5 | Kampferol | 18.34 | 286.23 | 285.1487 | 285.1425 | 245.1357 189.1109 |
C15H10O6 | [50,53] |
| 6 | Methylviolanone | 18.57 | 330.1103 | 329.1103 | 329.1539 | 311.1424, 279.1167 | C18H18O6 | [20,50] |
| 7 | homovanilic acid-hexoside | 19.23 | 344.138 | 343.1135 | 343.1762 | 279.1162, 255.1146, 181.0796, 163.0396 | C15H20O9 | [50,51] |
| 8 | 5-O-Feruloylquinic acid | 20.99 | 368.1568 | 367.1448 | 367.1648 | 337.1599, 293.1295, 191.0640 | C17H20O9 | [49,50,52] |
| 9 | Cyanidin | 25.17 | 288.2 | 287.2 | 287.1768 | 287.1768, 253.095, 167.1364, 149.1272 | C15H11O6 | [53,54] |
| 10 | Coumaroylquinic acid | 26.09 | 338.1002 | 337.1927 | 337.1900 | 265.1338, 173.1554 |
C16H18O8 | [51,52,53] |
| 11 | Quercetin | 27.15 | 302.236 | 301.1915 | 301.1950 | 295.1747 291.1551, 163.1428 |
C15H10O7 | [20,52] |
| 12 | Schisandrin C | 27.49 | 384.1573 | 385.1646 | 385.1393 | 339.1704, 137.0888, 123.0786 | C22H24O6 | [20,52] |
| 13 | p-coumaric acid O-hexoside | 27.95 | 326.1455 | 325.1529 | 325.1552 | 295.1080, 165.0856, 123.0763 | C15H18O8 | [20,52] |
| 14 | Hydroxytyrosol-4-o-glycoside | 29.29 | 316.2158 | 315.2085 | 315.2140 | 251.1190, 237.1404, 237.1042 177.1555 |
C14H20O8 | [50,55] |
| 15 | 3-Methoxysinensetin | 31.42 | 402.2315 | 403.2388 | 403.2755 | 399.2602, 383.2710, 199.0671 |
C21H22O8 | [52,54] |
| 16 | Pinoresinol | 31.74 | 358.1416 | 357.1343 | 357.2531 | 313.2297, | C20H22O6 | [52,54] |
| 17 | Glycitin | 32.45 | 446.3213 | 447.3286 | 447.3361 | 403.3065, 368.4185 | C22H22O10 | [20,52] |
| 18 | Dihydroferulic acid 4-O-glucuronide | 33.52 | 372.1156 | 371.1054 | 371.1674 | 291.1162, 266.9912, 73.0421 |
C6H20O10 | [50,55] |
4. Determination of TPC, TFC and In Vitro Antioxidant Activities
The results of the in vitro antioxidant profiling of T. foenum-graecum seed extract are presented in Table 3. The results reveal that T. foenum-graecum seed extract displayed excellent antioxidant potential with total phenolic contents of 454.93 ± 3.57 mg GAE/g, total flavonoid contents (TFC) of 135.04 ± 2.12 µg/CE and total antioxidant capacity (TAC) of 162.51 ± 3.81 per gram of dry plant extract. The extract represented a concentration-dependent activity of DPPH inhibition and ABTS scavenging assay with an IC50 value of 24.7 ± 2.70 and 15.8 ± 0.87 µg/mL, respectively, which is similar to standard.
Table 3. In vitro antioxidant activities and total phenolic and flavonoid contents of T. foenum-graecum seed extract.
| Antioxidant Assay | T. foenum-graecum | Ascorbic Acid |
|---|---|---|
| Total phenolic contents (GAE mg/g) | 454.93 ± 3.57 | - |
| Total flavonoid contents (CE µg/g) | 135.04 ± 2.12 | - |
| Total antioxidant capacity (AAE mg/g) | 162.51 ± 3.81 | - |
| DPPH inhibition assay (IC50) (µg/mL) | 24.7 ± 2.70 a | 25.05 ± 1.45 a |
| ABTS cation inhibition (IC50) (µg/mL) | 15.8 ± 0.87 a | - |
Each value is mean ± SD of three replicates. Alphabets a shows significant difference at (p < 0.05). -, not determined; AAE, ascorbic acid equivalents; CE, catechin equivalents; GAE, gallic acid equivalents; (µg/mL), microgram per milliliter.
5. Toxicological Analysis of T. foenum-graecum Seed Extract
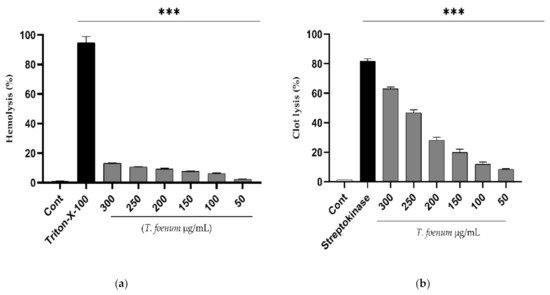
The results of hemolytic activity show that T. foenum-graecum seed extract has negligible toxicity in comparison to Triton-X (positive control), as shown in Figure 4. Further, the extract exhibits dose-dependent activity, and the hemolysis of erythrocytes increased with an increase in concentration of T. foenum-graecum seed extract. The concentration required for hemolysis of 50% RBCs (HC50 values) was estimated to be 2838 µg/mL, which is significantly (p < 0.001) different from HC50 of Triton-X-100 (64.98 µg/mL). Similarly, T. foenum-graecum extract showed a dose-dependent increase in clot lysis activity. Standard streptokinase (0.5 mL) and T. foenum-graecum extract at a high concentration (300 µg/mL) showed significant (p < 0.001) clot lysis activity of 81.82% and 63.01%, respectively comparing with the negative control (1.36%).

Figure 4. Hemolytic (a) and thrombolytic activity (b) of different doses (50–300 µg/mL) of hydroethanolic extract of T. foenum-graecum seeds through hemolytic and thrombolytic assays. (***, significant at p < 0.001).
6. Cytotoxicity Determination
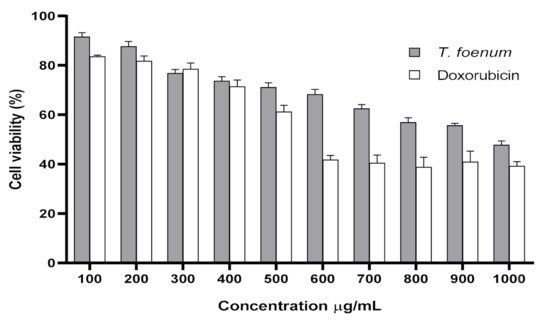
The results of cytotoxicity of T. foenum-graecum seed extract against RAW 264.7 cells are presented in Figure 5. Increased concentration of T. foenum-graecum seed extract has a negative impact on cell viability. The IC50 values for T. foenum-graecum seed extract and standard doxorubicin against RAW 264.7 cells were 1055 and 614.9 μg/mL, respectively. The results exhibit that plant extract showed low-to-moderate cytotoxicity in a concentration-dependent manner. Cell viability percentage was decreased with an increase in the concentration of plant extract. Cell viabilities in murine macrophages incubated with a different concentration (100–1000 µg/mL) of T. foenum-graecum seed extract were 91.53%, 87.64%, 76.79%, 73.67%, 71.06%, 68.25%, 62.47%, 56.87%, 55.60% and 47.78%, respectively. At concentrations (100–300 μg/mL), little cytotoxic effects were observed, and these concentrations were adopted further to examine the anti-inflammatory activity of T. foenum-graecum seed extract.

Figure 5. Cytotoxic activity (cell viability) of hydroethanolic extract of T. foenum-graecum and doxorubicin (standard) against RAW 264.7 macrophage through MTT assay.
7. Effect of T. foenum-graecum Extract on TNF-α and IL-6
The tested concentration (50–300 μg/mL) of T. foenum-graecum seed extract showed a substantial decrease in the production of IL-6 (1889.92 ± 19.32, 1338.73 ± 12.14, 1330.42 ± 10.56, 1108.32 ± 20.87, 947.33 ± 16.45, 748.52 ± 9.45, respectively) (Figure 4a and TNF-α (2158.12 ± 31.87, 1715.21 ± 28.68, 1518.68 ± 26.98, 1045.01 ± 23.55, 741.33 ± 18.84, 522.99 ± 19.03, respectively) (Figure 4b) in comparison to LPS-stimulated macrophages (2177.83 ± 37.56 µg/mL for TNF-α and 3894.42 ± 49.73 pg/mL for IL-6), suggesting significant in vitro anti-inflammatory potential. Figure 4a,b, demonstrates the effect of T. foenum-graecum seed extract on the production of TNF-α and IL-6 in RAW 264.7 cells after stimulation with LPS at various concentrations. The results indicate that the plant extract inhibited both TNF-α and IL-6 production significantly (p < 0.001) at different concentrations of 50–300 μg/mL, with inhibition rates of 13.21%, 38.91%, 38.52%, 49.10%, 56.50%, 65.62% and 44.58%, 55.95%, 61.03%, 73.16%, 80.96%, 86.57%, respectively, with IC50 values of 192.7 µg/mL and 72.03 µg/mL.
This entry is adapted from the peer-reviewed paper 10.3390/antiox11020364
This entry is offline, you can click here to edit this entry!
