Your browser does not fully support modern features. Please upgrade for a smoother experience.
Please note this is an old version of this entry, which may differ significantly from the current revision.
Southern Africa (SA) is rich in large river basin networks, from the over 1.4 million km2 Zambezi River Basin in the upper parts and extending further to the 0.4 million km2 Limpopo and 0.9 million km2 Orange River Basin systems southwards. Given that most SA river basins hold vast mineral deposits, the mining waste generated by artisanal and mechanised mining industries has significantly affected the health of its aquatic ecosystems.
- aquatic ecosystems
- Risk Assessment
- Heavy metals
- river basins
- southern Africa
- Rapid bioassessment
1. Introduction
Southern Africa (SA) is rich in large river basin networks, from the over 1.4 million km2 Zambezi River Basin in the upper parts and extending further to the 0.4 million km2 Limpopo and 0.9 million km2 Orange River Basin systems southwards [1,2,3]. Given that most SA river basins hold vast mineral deposits, the mining waste generated by artisanal and mechanised mining industries has significantly affected the health of its aquatic ecosystems [4,5,6,7,8]. Nevertheless, progress has been made in assessing the ecological risks of mining and mineral processing to characterise and manage geogenic and anthropic aquatic pollution in SA [9,10,11,12]. Ecological risk assessment (ERA) principally employs biological organisms to detect, evaluate, and predict ecological impacts of physical, chemical, and biological environmental changes in ecosystems. ERA comprises a logical process of assessing the occurrence or possibility of adverse ecological impacts from exposure to one or more undesired ecological effects [13,14]. The process incorporates problem formulation, exposure impact, effect analysis, risk characterisation, and risk-driven management decision-making [14]. Therefore, ERA provides a comprehensive mechanism for determining, monitoring, and sustainably managing ecosystem health and integrity.
Aquatic ecosystem health and integrity is critical, considering their role in providing physical and biologically mediated ecosystem goods and services [15,16]. Aquatic systems are environmental buffers to human health; they reduce the risks associated with pollutants and pathogenic microorganisms [17,18] that would otherwise impact human health. Therefore, monitoring natural and anthropic risks to these ecosystems using ecological indicators must be a priority for sustainable environmental management. Karr [19] described several ecological indicators (EIs) used to assess ecosystem stressors (e.g., contaminants), the exposure magnitude (e.g., pollutant concentration and habitat alteration), and response dynamics (e.g., community metrics and thermodynamics). Suitable EIs should be “measurable, integrative, ecologically and socially relevant, interpretable, cost-effective, anticipatory, collected at appropriate geographic and temporal scales, and able to detect trends” [19]. EIs must respond to multiple stressors and provide quantitative, comparable, and statistically reliable information based on sound ecological principles [20].
2. River Basins of Southern Africa and Environmental Threats
Africa’s metallic and non-metallic mineral enrichment accounts for nearly 30% of the discovered Earth’s reserves [28]. For instance, 55% of the global diamond production comes from the Democratic Republic of Congo (DRC) and Botswana. Gold mining in Africa contributes to 60% of her mineral production and 22% of the Earth’s total gold [29]. Despite this substantial endowment, Africa’s mineral production accounts for a dismal 5.5% of the global total, only second to Asia with 58.3% [30]. There are significant mineral deposits in SA and an extended exploration and exploitation history [4,31]. South Africa, in particular, contributes up to 50% of SA minerals [28]. In 2018, the region produced approximately 20.2% of the sub-Saharan Africa (SSA) minerals, principally as iron and ferro alloys (9.7%), nonferrous metals (0.6%), precious metals (0.1%), and industrial minerals (9.8%) [30]. There are also significant quantities of mineral fuel deposits, including coal (e.g., in Mozambique, South Africa, Zimbabwe, and Zambia); oil (e.g., in Angola and DRC); and uranium (e.g., in Namibia and South Africa) [30]. The fuels and mineral exports account for over 58% of Africa’s trade exchange [28].
Given the enormous mineral potential in SA, revenue from the mining industry has soared in recent years [32,33,34]. For instance, in 2018, South Africa produced over 380 million metric tons of mineral fuels, iron and ferro alloys, and ferrous metals of US $120 billion market value [30]. However, the intensification of mineral production in SA has exacerbated negative human and environmental health impacts [35]. The adverse effects include water pollution [36], atmospheric air contamination [37], land degradation [38], and threats to biodiversity [39,40] and animal and human health [41] and the disruption of ecosystems [8]. Rivers have been the most affected due to their lotic nature, hence receiving anthropic-derived effluents from adjacent ecosystems within mining catchments [12,42,43,44]. Detailed accounts of the vulnerability of lotic ecosystems to large-scale pollution sources are widely available in the published literature and scientific-based information repositories [45,46,47].
2.1. Southern Africa River Basin Systems
The Southern African Development Community (SADC) block comprises 16 member states, including neighbouring region members such as Tanzania (Eastern Africa) and DRC (Central Africa), on a total land area of 9,779,742 km2 inhabited by over 345 million people as of 2018 [48,49]. About 25% of the total land is suitable for agricultural production [50]. The Southern Africa region of SADC has 12 major transboundary river basins that extend from the 1.4 million km2 of the Zambezi Basin, south of the vast Congo Basin and the Limpopo Basin draining over 400,000 km2 of the land area to the 900,000 km2 of the Orange-Senqu Basin to the south (Figure 1). With a 1.39-million km2 land area, the Zambezi Basin transverses eight SADC states, where up to 70% transboundary water resources sharing occurs.
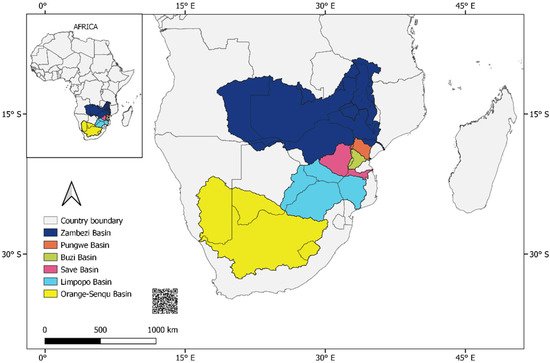
Figure 1. The river basins of Southern Africa threatened by aquatic pollution from heavy-metal mining and processing (Map shapefiles from FAO GeoNetwork [51]).
The SA basins face similar environmental challenges to most river basins worldwide. In particular, rapid human population increase and faster industrial development have exacerbated the impacts of climate change, causing extreme changes in basin hydrology; accelerating land degradation, agroindustrial (water, air, and soil) pollution; and biodiversity loss [3,49]. At least six basins (Zambezi, Pungwe, Buzi, Limpopo, Save, and Orange-senqu), with a total drainage area of 6.88 million km2 (88.1% of the SADC land area), have significant mining pollution among the environmental threats (Table 1). Over 158.1 million people across the seven basins comprise at least 45.8% of the SA population (2018 statistics).
Table 1. Basin characteristics, environmental threats, and selected studies on heavy-metal mining impacts to lotic systems of Southern Africa.
| No | Basin | Countries | Basin Overview [3,49] | Environmental Threats [3,49] | HM Pollution Threats and Selected Studies |
|---|---|---|---|---|---|
| 1 | Zambezi | Angola, Botswana, Malawi, Mozambique, Namibia, Tanzania, Zambia and Zimbabwe | Basin area: 1.4 million km2 (17.3% of SA). Zambezi river length: 2574 km. Important tributaries: Luena and Lungue-Bungo (Angola); Chobe (Botswana); Shire (Malawi); Luiana (Namibia); Kabompo, Kafue and Luangwa (Zambia). Basin population > 30 million. |
Climate change impacts; mineral mining and agricultural pollution; competing uses: agroindustrial and hydropower. | Sediment-water-biota [12,58,59,60,62,104] |
| 2 | Pungwe | Mozambique and Zimbabwe | Basin area: 31,150 km2 (0.45% of SA). Main tributaries located in Zimbabwe: Honde, Nyazengu, Chiteme, Nyamhingura, Nyawamba, Nyamukombe and Rwera. Population > 1.6 million |
Climate change and land degradation impacts; water pollution from alluvial gold mining. | Sediment-water-biota [74,75,78,80] |
| 3 | Buzi | Mozambique and Zimbabwe | Basin area: 31,000 km2 (0.45% of SA). Buzi river length: 250 km. Main tributaries: Revue and Lucite. Basin population > 1.2 million. |
Floods and drought events; pollution: agrochemicals, industries; deforestation; riparian degradation; unregulated alluvial gold and diamond mining and sedimentation; hydropower dam development; irrigation water overdraw. | Sediment-water-biota [77,78,80,81,84] |
| 4 | Save | Mozambique and Zimbabwe | Basin area: 110,420 km2 (1.4% of SA). Save river length: 740 km. Main tributary: Runde. Basin population > 3.3 million |
Climate change; ecosystem degradation; pollution: agroindustrial; mineral mining; hydrological flows: ca. 60 dams constructed. | Sediment-water-biota [82,83,84,85] |
| 5 | Limpopo | Botswana, Mozambique, South Africa, Zimbabwe | Basin area: 408,000 km2 (5.0% of SA). Limpopo river length: 1750 km. Important tributaries: Olifants/Elephant, Crocodile, Luvuvhu, Marico, Mzingwane, Mwenezi and Shashe. Basin population > 17 million. |
Climate change; agro-industrial and municipal pollution; mining expansion; water scarcity from irrigated agriculture. | Sediment-water-biota [46,86,87,88,91,92,96,105] |
| 6 | Orange-senqu | Botswana, Lesotho, Namibia, South Africa | Basin area: 900,000 km2 (11.1% of SA). Orange river length: 2300 km. Important tributaries: Senqu and Caledon (Lesotho); Vaal (South Africa); Fish River (Namibia). Basin population > 20 million. |
Climate change/variability; land degradation; increasing water demand; declining water quality: agroindustrial pollution, domestic and heavy mining; changes in hydrology; damming; population growth/settlements. | Sediment-water-biota [52,53,54,98,99,101] |
2.2. Environmental Threats to SA River Basins
Like river basins elsewhere, the SA basins’ environmental threats result from natural and anthropic pressures (Table 1). Environmental degradation, riparian population growth, and impacts from climate change and extreme hydrological events have caused alarming alterations to the basins’ ecosystem functioning. The environmental presence and persistence of pollution elements (contaminants), either in physical, chemical, biological, or energy forms, harm biodiversity, are hazards to human and animal health, and deter ecosystem processes and services. Elevated levels of environmental contaminants increase the probability of environmental pollution [52], which, if uncontrolled, can cause irreversible damages and alterations to ecosystem functionality and service delivery. The point and diffuse sources of surface water pollution in SA include agroindustrial effluents, mining waste, atmospheric fallout, and e-waste recycling [45,53,54,55,56]. However, this review focuses mainly on the human-mediated pollution of aquatic systems from metal and industrial mineral mining, knowing that mining is a critical economic activity in SA [28].
2.2.1. Aquatic Heavy-Metal Pollution
Zambezi Basin
The widely studied 1.4-million km2 Zambezi Basin, shared by at least eight SADC states (Figure 1), endowed with minerals, is the largest in SA, implying significant environmental impacts from agriculture, industrial development, population growth, and natural resource utilisation [1,57]. In the arid Gruben region of Namibia, there was pollution of the Gruben River water flowing through copper mining spoil heaps, releasing 94.7% Cu (36 mg L−1) and 90.5% Ni (35 mg L−1) and high Cu concentrations (10,500 mg L−1) in suspended sediments during episodic flows [58]. The surface waters of the “Yellow Jacket” (from Fe-hydroxysulphate precipitation) and Mazowe rivers in Zimbabwe have been observed to be highly acidic (pH < 2) following contamination by outflows from the Iron Duke pyrite mine containing Fe; Fe alloys (Co and Ni); and nonferrous metals (Cu, Pb, and Zn) and sulphates [59]. Similarly, Love et al. [60] emphasised the role of mineral ore geochemistry and mineral processing technology in accelerating acid mine drainage formation, cyanide (CN) formation, and the production of heavy-metal contaminants from waste rocks and slimes in the Zimbabwean Zambezi Basin. These groups of pollutants impact negatively aquatic biota communities (e.g., microbes, macroinvertebrates, fish, and macrophytes) [60,61].
Ikenaka et al. [62] clustered heavy-metal pollution in Zambia based on the pollution intensity, with Kabwe and Copperbelt dominating. In Kabwe, Cu, Pb, Zn, Cd, and As release from smelter processing has caused soil and atmospheric contamination [63,64,65]. Surface runoff, leaching from the slag heaps, senescing metallophyte vegetation, and atmospheric fallout further deposit the metal contaminants into surface water drainage systems, resulting in aquatic pollution.
The Kafue River Basin, occupying about 20% (743,000 km2) of Zambia’s land area, drains the Copperbelt Province, also heavily impacted by mining waste pollution [38,66,67]. The waste effluents pose potentially adverse ecological risks to aquatic biota and human health [66]. The water and sediment pollution of the Kafue River, mainly by Cu, Co, Cr, Pb, and Cd, significantly increases downstream in an alternate sink–source–sink pattern due to remobilisation and pH fluctuations, especially in the Kabwe transect [61,62]. Observable inputs of Cu and Co in bed sediments of the Mushishima Stream from HM processing plants and tailings in Chingola deserve attention to alleviate the potential environmental and health risks [59]. In Kitwe, aquatic HM contaminants originate from the Uchi Mine tailings, Nkana smelter, and the famous “Black Mountain” slag dumps in the town’s industrial area into the aquatic system via leaching, precipitation, and overland flow [66].
M’kandawire et al. [12] detailed the HM aquatic sediment pollution assessment of Kafue River and indicated high values for As, Co, and Mn and extreme enrichment with Cu within the industrial mining areas of the Copperbelt. The risk indices (RI) of the heavy metal pollution in the Kafue River were notably very high (RI > 600) across three seasonal transitions (warm-rainy, dry–cold, and dry–hot) in Chililabombwe and Chingola Districts, where industrial mining is predominant. In the Kafue area, the Kafue flats, however, serve as sinks of HM species, as reflected by the exceptionally low RI (<150) values [68,69,70]. Since wetlands absorb large amounts of contaminants, this observation should be a concern to environmentalists and wildlife managers due to the likely increased risks during changes in the water chemistry and subsurface seepage that may cause HM release [71]. High levels of Pb mg/kg dry weight (DW) have been observed in wildlife (a semiaquatic grazer antelope, the Kafue lechwe, 16–18; Tilapia and African catfish, 23–33; commonly grazed grass, Echinochloa sp. 26–48) of the Lochnivar and Blue Lagoon National Parks in Kafue flats, thereby posing a health risk to higher trophic organisms [12,72,73].
Pungwe, Buzi, and Save Basins
The three basins cumulatively draining a basin area of 172,570 km2 are shared between Mozambique and Zimbabwe, with the main tributaries originating from Zimbabwe (Figure 1). Artisanal alluvial gold mining is predominantly informal across the subregions. For instance, in the Mozambique Pungwe Basin, over 90% of gold production comes from a long history of artisanal and small-scale mining (ASM) [74]. The sector employs over 20,000 people in Central Mozambique and produces nearly 600 kg of gold annually [75]. Over 500,000 miners earned income from ASM in Zimbabwe, contributing almost 50% to the foreign earnings in 2016 [76]. However, uncontrolled ASM of gold and diamonds in the three basins exposes the surface waters to siltation, Hg, CN, and As contamination [77] and environmental degradation [41,78]. Such is the human health and environmental threats from unregulated gold prospecting in the Manica Province of Mozambique due to increased Hg amalgamation and CN toxicity [74,79]. Turbid water from suspended sediment and heavy-metal contaminants in transit from artisanal gold and diamond mining areas characterise River Buzi and its two major tributaries, Revue and Lucite [80,81].
Save River, a key source of drinking water for the riparian community, forms the primary drainage system for the Save Basin. In Zimbabwe’s Buhera District of the Save Basin, phosphate rock (fluoroapatite) mining pollutes the surface water and sediment with Cu, Pb, Co, Ni, Zn, Cd, and Tn via weathering and dissolution of metal-hosting heavy metals [82]. Since alkaline rock bedloads adsorb mineral pollutants, they act as repositories forming a potential source of stream water pollution in the future [83,84]. Diamond mining in the Marange-Odzi Region releases high Fe, Ni, and Cr from ferro-silicon (FeSi) sand used during extraction into the Save-Odzi River with potential carcinogenic (Cr and Ni) and Fe poisoning effects to consumers among the many environmental impacts to the basin [85].
Limpopo Basin
The 408,000 km2 Limpopo Basin transcends ecologically important conservation zones of high biodiversity and supports a sizeable rural-urban population and farming communities. Mining and mineral processing in the basin contributes to physical and chemical environmental degradation, acid mine drainage, metal toxicity, erosion, and sedimentation [46,86]. The mining pollution threat has extended into aquatic systems of protected areas in the basin, e.g., South Africa’s 2 million ha Kruger National Park [87]. In the Blyde and Steelport tributaries of the Olifants River, high mg L−1 Fe (0.01–0.4), Ni (0.03–0.14), and Zn (0.004–0.054) in the surface water coupled with elevated mg kg−1 sediment concentrations for As, Cr, Fe, Mn, Ni, Pb, and Zn, indicated high metal enrichment [88]. Similarly, in Mvudi River of the lower Limpopo Basin, average concentrations of HM contaminants in mg L−1 water (Pb, 0.287; Al, 0.602; Fe, 0.947; Mn, 0.202; Cr, 0.406) and mg kg−1 sediments (Cr, 0.115; Cu, 0.701) surpassed the recommended South African/WHO guidelines for potable water [89,90]. These contaminants pose potential aquatic and human health risks to riparian water resource users [91].
Wolmarans et al. [92] affirmed the deteriorating condition of the Olifants River system. Out of 35 macroinvertebrate taxa sampled, only seven were highly sensitive to pollution. Additionally, Marr et al. [86] and Addo-Bediako et al. [91] noted that the consumption of Ba, Co, Cr, Sb, Pb, and V metal-contaminated tilapia and catfish from surface waters in the basin expose humans to health risks. In Dzindi River, the mg L−1 heavy-metal contaminations from Fe (1.33), Al (0.3), Mn (0.15), Zn (0.10), Cr (0.06), Cu (0.05), and Pb (0.03) revealed probable health risks from drinking water use without pre-treatment [93]. In the Mkuvisi River in Harare, Zimbabwe, increased Fe, Cr, Cu, and Zn pollution from industrial and municipal waste effluents caused a sharp decline in macroinvertebrate taxa. The South African Scoring System (SASS-4) for the aquatic habitat assessment average score per taxon (ASPT) ranged from 2.74 (poor) to 3.61 (fair) for Mkuvisi River, indicating negative impacts on the aquatic biodiversity [94]. Additionally, the persistence of high Pb levels in sewage effluents into Sebakwe River, Zimbabwe, is a significant human health risk from Pb poisoning [95]. However, in the Nyl River floodplain Ramsar site, Greenfield et al. [96] attributed the low ug L−1 heavy-metal concentrations (Zn, As, Cu, Cd, Fe, Se, Pb, Al, Cr, and Mn) in the Nyl River to geogenic origins with values below the South African maximum allowable limits for water quality [89].
Orange-Senqu Basin
At about 900,000 km2 and the second-largest, the Orange-Senqu Basin covers nearly half of South Africa in the central region, entire Lesotho (Senqu Basin), Southern Botswana, and parts of Southern Namibia [97]. A basin-wide study by UNDP-GEF [98] on human-mediated heavy-metal and risk assessments noted high-risk areas (and risk elements), including Molo Eye (Cr, Mn, Ga, Ni, Ag, and Se); Vaal (U); Riet and Koranna Spruit; Caledon and Makbomatso (several elements); Skoon Spruit (Fe and Ni); and Fish River (As). The elemental bioavailability to aquatic biota was in the order Rh < Ag < Sn < Au < Rb < Pt. Additionally, As and Be were detected in fish tissue and bird eggs during the study. Recent findings in the Vaal Basin by Moloi et al. [99] from two Maluti-a-Phofung Municipality rivers, Eland and Wilge, and Iloms et al. [54] from Vaal River indicated increased noncarcinogenic human health risks from the consumption of water containing elevated levels of As, Cu, Pb, and Zn. A similar study on the Sand River, Limpopo Province noted the increased risk to the Pb levels from consuming the river’s fish [100]. In KwaZulu-Natal, agroindustrial pollution is a significant source of Cr, contamination, mobility, and enrichment in the Palmiet and Sezela Rivers [101].
In Lesotho, mining at Letseng Diamonds mines has negatively impacted the ecosystems of Mokhotlong District via soil erosion, site contamination, surface water pollution from mining waste, land degradation from nonbiodegradable litter, and the accumulation of toxic waste landfills [102]. Separately, a major tributary to Orange River, Lesotho’s Caledon (Mohokare) River, a key water supply source to Lesotho and South Africa (Lesotho Highlands Water Project), received above allowable mg L−1 limits for Fe (0.5) and Mn (0.7) in untreated effluents from textile industries around Maseru, raising concerns about the rising aquatic pollution [53,103].
2.3. Threats to Southern African Lotic System Biodiversity from Metal Mining and Processing
Despite containing a dismal 0.01% of Earth’s water, freshwater ecosystems support over 6% and above 10% of the global biodiversity and known species, respectively [22,106]. However, the increased global demand for freshwater resources threatens these ecosystems and their inherent biodiversity [107]. Such threats include water pollution, habitat destruction and degradation, resource overexploitation, streamflow modification, and species invasions or introductions [106]. Africa’s freshwater biodiversity is more than ever under threat from multiple anthropic factors exacerbated by climate change impacts, leading to species and habitat loss [108]. In the mining rivers basins of SA, the most important anthropogenic threats include water pollution (e.g., acid mine drainage and metal ions/metalloids); habitat degradation/destruction (e.g., open-cast, ground, and alluvial mining); and flow modification (abstraction, diversion, and effluent discharges). The magnitude of these threats depends on the source, type, nature, and quantity of mining-generated contaminants entering the aquatic systems. For instance, both hydraulic and hard rock mining accelerates the release of toxic metals (e.g., Pb, Zn, and Hg); metalloids (e.g., As and CN); and other substances (e.g., acids) via runoff or leaching (Figure 2), causing physical and chemical disturbances to stream ecosystems and exacerbating the biodiversity loss [109]. Additionally, minerals like diamonds and gold, frequently mined in water-scarce environments, demand the abstraction of significant volumes of water for extraction [110], exposing aquatic ecosystems to increased water stress and shrinking habitats, already exacerbated by episodic stream drought and climate change events [111,112,113].
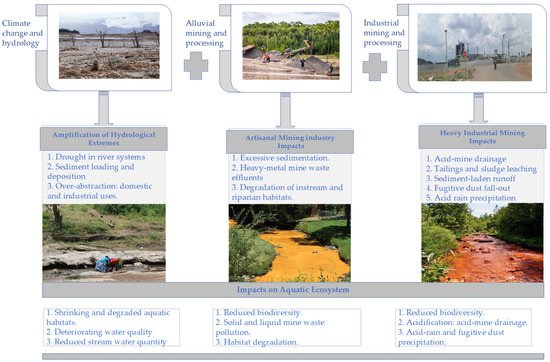
Figure 2. Threats to aquatic biodiversity and stream ecosystem functions from artisanal and industrial mining in river basins. The impacts of mining are further accentuated by the negative influences of climate change on stream hydroecology. Photo credits and copyrights: A. Hendricks; J. Houston; X. Rana; K. O. Ouma; L. Iaccino.
2.3.1. Source-Receptor Pathways of Metal Mining Pollutants in Aquatic Systems
In mining-dominated river basins, stream water and sediment pollution result from the surface and subsurface runoff/leaching of excessively heavy-metal-laden solid and liquid wastes, mostly anthropogenic (Figure 3). Acid mine drainage (AMD) is of environmental concern to aquatic systems in such regions. Besides transporting elevated concentrations of heavy metals and metalloids, AMD alters the streamwater chemistry by increasing the acidity to pH < 4 [114,115]. At low water pH/Eh in an anoxic environment, the bioavailability and toxicity of HM (e.g., Pb and Zn) in AMD is enhanced, more so by the presence of organic matter, carbonate minerals (e.g., hydrocerussite), and iron(III) hydroxides and oxides [116]. Ettler et al. [63] observed an increase in the percentage of orally bioaccessible Pb (24–95), V (21–100), and Zn (54–81) at pH < 1.5 in slag–dust-contaminated air at the Kabwe mining town of Zambia, indicating a potential environmental and human health risk. In the Kombat, Berg Aukas, and Tsumeb polymetallic mining areas of Northern Namibia, the exceptionally high oral bioaccessibility of Pb and As in mining dust was triggered under highly soluble phases and acidic gastric conditions [117].
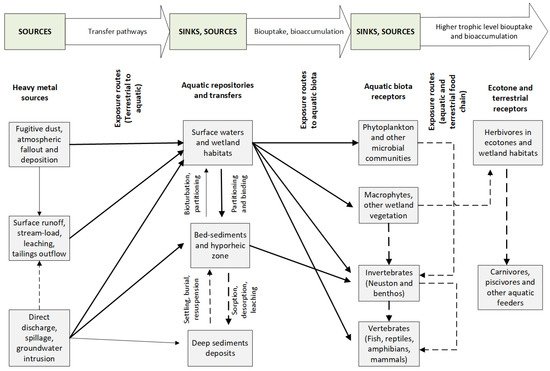
Figure 3. Conceptualised exposure pathways of aquatic biota to heavy metal pollution in surface and ground waters draining mining landscapes. The arrow density directly correlates to the importance of the respective exposure pathway. Based on the interplay between biotic and environmental components, the model is developed from the contaminant exposure concept in Giddings et al. [133].
In the aquatic environment, the low pH of water similarly lowers the diversity of communities of aquatic biota, including microbes [118], periphyton, macroinvertebrates, and fish, by increasing the bioavailability and toxicity of HM [119,120,121]. Additionally, the ecotoxicity of streamwater to aquatic biota increases with elevated levels of ionic and complexes of heavy metals, which can bioaccumulate and bioaugment in the aquatic ecosystem [122,123]. Aquatic microbiota; benthos; and larger organisms (e.g., fish, amphibians, and reptiles) tend to bioaccumulate and subsequently biomagnify heavy metals and increase their toxicity to other secondary consumers, including terrestrial wildlife and humans [104,124,125,126]. Further, the thermodynamic solubility characteristics and local chemistry of contaminant-containing mineral waste effluents in the aquatic media influence their mode of transport, chemical reactivity, and toxicity to aquatic biota [127,128].
Depending on the water chemistry, stream sediments can act as sinks and sources of heavy metals in polluted rivers (Figure 3). This dual role depends on the dissolution and precipitation processes of the discrete heavy-metal phases, as determined by the ambient stream water chemistry and thermodynamic properties [129]. In Pb-contaminated sediments, “the mineral forms (e.g., PbSO4, PbCO3), and Pb2+ adsorbed to Fe and Mn (hydr)oxides are comparatively inert” [128]. However, the carbonates, oxides, and sulphates of Pb readily dissolve under a highly acidic environment, posing significant environmental risks [130]. An increased accumulation of sediment-associated heavy-metal nanoparticles (HM-NPs) subsequently increases the ecotoxicity risk due to bioaccumulation in stream benthic communities. For example, oxidative hepatopancreatic and gonadal damage has been observed in the gastropod Bellamya aeruginosa after exposure to Cu (180-μg g−1 dry weight (DW)) as CuO-NPs over 14 days [131]. The sediment toxicity to aquatic biota can also be monitored using genetic and metabolic changes among various species of the benthic communities, e.g., chironomids and gastropods [132].
Figure 3 illustrates the pathways through which heavy-metal contaminants enter the aquatic ecosystem from multiple sources. Runoff, leaching, erosion, and wastes from tailings dams are highly significant metal contaminant sources. Atmospheric gases and other HM waste-laden fugitive dust are also significant pollution contributors. Exposure to heavy-metal contaminants in an aquatic environment can occur at different interphases: from allochthonous sources (e.g., surface runoff, spills, direct application, and groundwater intrusion); within the various aquatic repositories (e.g., water and sediment); biouptake by aquatic receptors (e.g., microbiota, invertebrates, macrophytes, and vertebrates); and export into the terrestrial food chain by wildlife and other tertiary consumers (e.g., humans). Surface waters and wetlands contribute significantly to biologically available heavy-metal contaminants to biota within aquatic systems. In contrast, surface and deep sediments serve as temporary sinks (e.g., adsorption and burial) or sources (e.g., desorption, bioturbation, and resuspension), as determined by the water chemistry, thermodynamic, and hydrological processes [129].
2.3.2. Toxicity of Selected Heavy-Metal Pollutants to Macroinvertebrate and Macrophyte Communities
The elevated presence of heavy metals beyond geogenic concentrations in aquatic systems is traceable to human-mediated agroindustrial pollution. Heavy metals biocentrate and bioaccumulate in aquatic biota and persist in the water-sediment matrix [134]. High and toxic levels of As, Cr, Hg, Pb, Cu, Ni, and Zn are frequently reported in aquatic environments [135]. Some elements, such as Ni, Cu, Cr, and Zn, are essential metabolic components at trace concentrations but cause systemic toxicity above permissible thresholds [61,136]. Other elements (e.g., Pb, Hg, and As) are toxic to aquatic organisms, even at trace levels [137].
Arsenic (As)
Due to the high bonding affinity with other natural elements, As naturally occurs as a major ingredient in over 200 mineral ores, mainly as elemental As, arsenide, arsenate, phosphate, sulphide, arsenite, and oxide mineral forms released biogeochemically during oxidation, reactive desorption, or chemical and bioleaching processes [137,138]. As is also introduced anthropogenically via agrochemical processing byproducts and mining effluent discharges into natural water systems [139,140]. The inorganic As forms are considered more toxic than the organic derivatives, with marked differences in their biochemical effects on aquatic biota [141].
In the aquatic matrix, the As toxicity varies with the water chemistry (e.g., pH and redox potential), presence of oxides (e.g., Fe and Mn) [142], and microbial activities (e.g., algal biosorption) [137]. As exists mainly in four oxidation and pH-dependent states as arsenite (As(III)), arsenate (As(V)), and arsenic (As(0)) and arsine (As(-III)) [143]. As(III) and As(V)) are the most abundant inorganic forms, where the transformations between the two are pH- and Eh-dependent. Microbial biochemical processes in water convert the dominant inorganic As species to methylarsenicals and high-order organoarsenic forms such as arsenosugars, which bioaccumulate in living tissues [144]. Under anoxic conditions, anaerobic bacteria reduce biomethylated inorganic As to the organic monomethlyarsonic (MMA) and dimethlylarsinic (DMA) acid metabolites that are more mobile in water [145,146]. In the agricultural sector, the two organic compounds MMA and DMA, the active ingredients of organic herbicides, enter the aquatic environment via point or diffuse sources [146].
As (III) is more soluble and, hence, more readily bioavailable and toxic than As(V) to aquatic organisms under reducing Eh conditions and low pH, particularly the metallophytic hyperaccumulator macrophytes (e.g., Water hyacinth, duckweeds, water ferns, water cabbages, and watercress) [140]. Falinski et al. [147] recorded As bioaccumulation up to 0.572 and 0.075 mg L−1, respectively, for two edible macrophytes, Nasturtium officinale (watercress) and Diplazium esculetum (vegetable fern), of Hawaii. The corresponding potential human health risk quotients were 0.12 and 0.03. In the coontail (Ceratophyllum demersum L.), tissue accumulation of 0.302-mg As g−1 DW exhibited necrosis and biomass reduction over 48-h exposure to As(III) [142].
As toxicity on macroinvertebrate communities results in lower biodiversity, reduced population densities, changes in population structure, and ultimately, lower community biomass. Canivet et al. [148] and Chi et al. [149] observed a significant absence of sensitive EPT (Ephemeroptera, Plecoptera, Trichoptera) taxa (e.g., Heptagenia sulphurea and Hydropsiche pellucidula), the abundance of more tolerant Chironomidae (e.g., Cardiocladius sp.), and transition to tolerant predator functional feeding combined with the disappearance of filter feeders, scrappers, and collectors from As toxicity in an aquatic environment.
Chromium (Cr)
Chromium occurs naturally in the nontoxic trivalent (Cr3+) state. However, Cr3+ oxidises to the toxic hexavalent (Cr6+) form on exposure to water and air. Cr3+ is soluble over a wide pH range [150,151]. Prolonged exposure of freshwater crustacean amphipods (e.g., Gammarus and Niphargus sp.) and isopods (e.g., Asellus sp.) to a half-maximal lethal concentration (LC50) of Cr6+ exhibited toxic sensitivity [148]. However, the trait-based evaluation of physiological sensitivity to Cr and other heavy metals ranked crustaceans (molluscs and bivalves) above cladoceran and trichopteran insect orders [152]. Cr pollution has caused a longitudinal decline in macroinvertebrate taxa richness in river systems [94]. For instance, in Hex River draining the Bushveld Igneous Complex platinum mining region of South Africa, the Cr body loads for macroinvertebrate taxa increased downstream. The benthic Tubificidae accumulated the highest Cr (92 µg g−1), followed by Libellulidae (69 µg g−1), per DW [153].
In macrophytes (e.g., Pistia stratiotes and Salvinia herzogii), Cr bioaccumulation occurs via ion exchange, adsorption, and chelation processes [154]. Toxicity from Cr in macrophytes manifests as changes in the chloroplast ultrastructure and cell malignancy. Cell death, tissue necrosis, and root wilting may also result from Cr poisoning [150,154]. Different macrophyte species display varying tolerance levels to Cr toxicity. For instance, in China’s Taihu Basin aquatic systems with a mean 92.4 mg kg−1 of sediment and 5.4 ug L−1 of Cr concentrations, Potamogeton malaianus, Nymphoides peltata, Eichhornia crassipes, and Hydrilla verticillata, Cr6+ phytouptake ranged between 4.2–44.2, 1.5–8.4, 1.7–5.5, and 3.4–10.4-mg kg−1 DW, respectively, against the 5–30-mg kg−1 DW toxic level criteria [155]. Macrophytes have been used extensively in the phytoremediation of Cr6+ toxicity, e.g., Pistia stratiotes is a better hyper-accumulator for Cr in an aqueous Co–Cr environment, hence significantly reducing the Cr toxicity over two-fold compared to Co removal [156].
Copper (Cu)
Jeppe et al. [132] examined sediment-derived Cu toxicity to stream macroinvertebrates at the subindividual and population levels. The authors noted genetic and metabolomic changes in Chironomus tepperi (Chironomidae) at EC50 and 60-mg kg−1 Cu. However, this taxon was most tolerant to Cu toxicity at EC50 with up to 94.5% survival. A rapid decline in the highly sensitive mayfly (Rithrogena sp.) population coupled with Cu bioaccumulation in caddisfly (e.g., Brachycentrus sp.) tissues indicates the heavy-metal toxicity of aquatic insect communities [157,158]. Additionally, Joachim et al. [159] observed a reduced abundance, richness, and diversity of macroinvertebrates, emergent insects, and zooplankton on prolonged exposure to 25–75-ug L−1 Cu concentrations.
Macrophytes are suitable for biomonitoring and phytoremediation due to their ability to bioaccumulate and bioconcentrate heavy metals in aquatic environments. Lemna minor, Elodea canadensis, and a moss (Leptodictyum riparium) have excellent biouptake and removal capabilities for Cu, Cd, Pb, and Zn [160]. E. canadensis has been used to monitor Cu toxicity [161]. However, sublethal heavy-metal doses alter the chloroplast ultrastructure, cause cell plasmolysis, and eventually reduce the biomass [160,161]. There is evidence of Cu build-up inducing oxidative stress by limiting the antioxidant enzymatic activity and chlorophyll content in free-floating coontail (Ceratophyllum demersum L.) and duckweed (Spirodela polyrhiza) [162,163].
Mercury (Hg)
Methylmercury (MeHg) is considered the most bioavailable and toxic form in aquatic environments [164]. This organomercury forms rapidly in aquafauna since MeHg is lipophilic, passes through cells, and has a high affinity for amino acids [165]. MeHg toxicity in the aquatic food web is amplified in the organic form through bioaccumulation and biomagnification. For instance, the shoots of Elodea nuttallii can accumulate up to 60% MeHg intracellularly from water and sediments, hence availing it to higher trophic levels [166]. Mercury toxicity is an environmental cause of systemic imbalance in aquafauna, e.g., oxidative stress and neurotoxicity [167].
MeHg uptake by stream macroinvertebrates can be used to predict bioaccumulation and the lateral–vertical transfer of Hg in the aquatic food web [168,169]. Macroinvertebrate functional feeding groups (e.g., obligate predators) can also be used as surrogates to monitor Hg pollution in heavy-metal-polluted streams [170]. Mercury methylation in macroinvertebrates mainly occurs from stream sediment repositories [164].
Zinc (Zn)
Most Zn in freshwater systems increasingly adsorbs into sediments and humic substances at high temperatures, low oxygen levels, and low pH. In dissolution, hexa-aqua zinc (Zn(H2O)2+6) is the most stable and highly toxic to aquatic biota [171]. Most aquatic organisms can tolerate bioavailable Zn concentrations below 100 µgL−1 [172]. However, at elevated levels, Zn toxicosis lowers the metamorphosis and emergence rate of adult stages of freshwater insect communities [173]. The presence and toxicity of Zn in ternary mixtures of heavy metals in streams lowers the abundance of pollution-sensitive mayflies (Ephemeroptera) in aquatic species-sensitivity distribution (SSD) profiles [158].
3. Monitoring and Assessment of Aquatic Heavy-Metal Pollution in SA River Basins
A multidisciplinary approach to analysing aquatic ecosystems in river basins is more impactful in monitoring and assessing ecosystem integrity. Monitoring involves sampling and analysis to determine the ecological status, while assessment interprets the data to establish the system’s ecological integrity [174]. This multidisciplinary consideration provides an ecological platform for a holistic study and a better understanding of “catchment ecology” under the five main ecological components [175]:
-
System conditions, which incorporate climate-related structures, characteristics, and processes.
-
System hydrology, the catchment hydrological and hydraulic processes, including lateral and longitudinal instream and terrestrial flows. Surface and groundwater interactions are also considered.
-
Structures, the morphological features that influence catchment hydrology, energy and material transfers, and retention/recycling potentials.
-
Substances, the longitudinal qualitative and quantitative determination of dissolved components, such as pollutants, gases, ions, and nutrients as load transport in lotic ecosystems.
-
Biotic, the response of living components to the functioning of the above controlling abiotic factors. This component includes the taxonomic and ecosystem responses and biotic processes, like primary production, respiration, competition, reproduction, and trophic relationships. Biotic responses to the controlling factors are an essential indicator for catchment management and biodiversity conservation.
Building on the five components, a TRIAD assessment of the ecological integrity of catchment ecosystems, which integrates the biological, ecotoxicological, and physicochemical data, has been proposed [176,177].
3.1. Physicochemical Monitoring and Assessment
In most environmental assessment initiatives, physical and chemical surveys frequently take precedence to determine the pathways for further investigations, including biological method integration. Physicochemical monitoring provides feedback mechanisms since fluctuations in the water quality can be rapidly detected and further reference-based monitoring action taken when or where necessary. Any aquatic system’s physical and chemical attributes significantly influence its biotic structure and functions [178].
SA river systems’ physical and chemical water qualities have been extensively documented and used to categorise their ecological statuses [43,62,179]. Heavy-metal pollution in the different aquatic matrices of SA lotic systems has received increasing attention over the past decades due to the associated negative ecological impacts [96,180,181,182,183]. The pollution intensity and environmental impact of HM contamination will likely increase with the demand for raw materials, advances in industrial mining and processing technologies, and expansion of areal mining in the SA region.
3.2. Bioindicators, Biomonitoring, and Bioassessment
Biological monitoring (biomonitoring) initiatives have gained popularity in SA due to their cost-effectiveness, eco-friendliness, rapid application, and integration into aquatic assessment programmes [26]. While physical and chemical monitoring can be used to reveal the direct and instantaneous effects of HM pollutants in the aquatic matrices, biotic communities offer the advantage of revealing the integrated and “historic” impacts of pollutants on both the biota and the ecosystem. Biomonitoring uses bioindicators such as free-floating algae, the periphyton complex, macrophytes, invertebrates (zooplankton, insects, molluscs, and gastropods); and vertebrates (fish, amphibians, reptiles, and large mammals) to evaluate contaminations in the environment. Zhou et al. [184] defined biomonitoring as a “scientific technique for assessing the environmental and biotic exposures to pollutants, based on sampling and analysis of the target matrix”. Biomonitoring uses markers (biological or chemical signatures) to reflect the potential impact or ecotoxicity of anthropogenically produced pollutants on the bioindicators and the environment.
Suitable bioindicators are based on several desirable biological and physical attributes. However, since it is virtually impractical to find such organisms, a bioindicator with representative qualities may serve the specific objectives of biomonitoring. For instance, in using fish, the abundance, ubiquity, tolerance or sensitivity, sedentary nature, trophic status, and life history can be considered when selecting appropriate species [184]. Bioindicators can be categorised based on the objectives of bioindication as diagnostic, compliance, and early warning indicators or, according to their application, into biodiversity, environmental, and ecological indicators [185].
3.2.1. Macroinvertebrate and Fish-Based Assessment
The suitability of macroinvertebrates as bioindicators in lotic systems lies in their ability to reflect the magnitude of aquatic degradation spatiotemporally using well-established assessment methods and indices [50,186,187,188,189,190]. The sedentary macroinvertebrate communities, particularly Ephemeroptera, Plecoptera, and Trichoptera (EPT), have been widely used as bioindicators of aquatic pollution, integrating both water and habitat qualities [87,184,191]. Macroinvertebrates have been used to assess heavy metal contamination in Southern African riverine systems [26,92,188,192,193]. In South Africa’s Bushveld platinum mining complex, metal accumulation varied in different functional feeding groups of macroinvertebrates. The epibenthic taxa (Tubificidae and Chironomidae) accumulated higher concentrations of Cr and Pt than the water column feeders, scraper grazers (Lymnaediea), shredders (Baetidae), and predators (Coenagrionidae) [153]. Phiri [94] noted a sharp decline in macroinvertebrate taxa along the lower reaches of Mukuvisi River in Harare, Zimbabwe, which was dominated by tolerant oligochaetes and chironomids due to elevated Fe, Cr, Cu, and Zn loads in the streamwater.
Fish, due to their desirable biological attributes, such as size, habitat variability, life cycle, ease of culture and taxonomic identification, trophic level, and socioeconomic significance, qualify their relevance, preference, and wide application in the biomonitoring and bioassessment of aquatic ecological integrity [174]. Fish as bioindicators can represent aquatic degradation at local and regional scales. The behavioural (growth, reproduction, metabolism, and feeding), biochemical (biomarkers), and the sublethal response of fish to metal pollution have been suggested for biomonitoring [194]. High metal (Co, Cd, and Zn) concentrations have been detected in tissues of the highly adaptive African catfish (Clarias gariepinus) and the Nile Tilapia (Oreochromis niloticus) in an HM-polluted reservoir, Eleyele Lake, in Nigeria [195]. Histopathological studies on fish have also established the relationship and the severity of heavy-metal pollution on fish health and susceptibility to diseases [196]. HM bioaccumulation in the endocrine system of fish in Kafue River, Zambia, has potentially negative effects on reproduction by depressing sex hormones [197]. Further, the sequestration of HM in fish tissues and organs is emerging as a human and aquatic ecological health concern [198,199,200].
3.2.2. Microphytes, Periphyton, and Macrophytes
All three groups respond to water quality changes by variations in the species spectrum and abundance. However, the microphytes (phytoplankton and phytobenthos) and periphyton display quicker reactions more appropriate for short-term investigations. Microphytes, other heterotrophic microbes, and organic matter complexes form a periphytic matrix attached to submerged surfaces in the aquatic environment. Due to their very short life cycles and high reproduction rates, periphyton respond quickly to environmental pollution. Besides the individual plankton communities, periphyton can also be suitable for detecting short-term and sudden environmental variations.
Additionally, the ubiquitous nature and extensive knowledge of periphyton ecology within the scientific community makes periphyton suitable for monitoring and assessing aquatic HM pollution [18,184,201,202,203]. Benthic diatoms and filamentous green algal assemblages are useful in evaluating biotic responses to mining pollutions in stream ecosystems [204,205,206]. Respectively, several diatom-based biotic indices have been developed to assess the ecological integrity of SA river systems, including the Trophic Diatom Index (TDI) and the South African Diatom Index (SADI) [26,204].
Several macrophyte species, including Eichhornia, Ludwigia, Polygonum, Pistia, Cyperus, Lemna, Elodea, Typha, and Azolla, have been used to study HM contamination dynamics in tropical aquatic environments [135,160,207,208]. Macrophytes are appropriate bioagents for the long-term monitoring of aquatic ecosystem health due to their sedentary nature, high diversity, abundance, ease of identification and handling, and tolerance to HM pollution [105,209,210]. Changes in the macrophyte community structure and composition can also be a valuable indicator of pollution trends and alterations of the stream water quality [184,211].
3.3. Approaches in Biomonitoring and Bioassessment of Aquatic Ecosystems
3.3.1. Ecological Tools and Models
Ecological assessment tools employ a cocktail of physical, chemical, and biotic components to evaluate the ecosystem integrity. Oberholster et al. [205] used the Ecological Screening Tool (EST) comprising physical-chemical and biological phases. The EST used a weight-of-evidence approach to determine the impact of acid mine drainage (AMD) on the health of the Bloubane Stream in South Africa. Beyond the ecological assessment tools, ecological models are developed to explain the composition and variability of ecosystems’ aquatic communities. For instance, the step-wise stress model uses indicators in the pressure–state–impact–response (PSIR) chain at ecosystem-level responses, using biodiversity and sustainability parameters [185]. Other complex models for ERA have also been developed, from food web- and ecosystem- to socioecological-based scales [212]. The ecosystem model is the most relevant in our context since it evaluates the response of biotic and abiotic components to perturbations, e.g., pollutants or ecosystem modifications. Ecosystem models are developed from the input of multivariate, multimetric, and population or community biotic response indices.
3.3.2. Multivariate Methods
Multivariate indices (MIs) are model-oriented predictive systems that compare the observed ecological status and referenced conditions projected from pristine environmental conditions from environmental parameters (e.g., reference condition approach). The multivariate approach requires in-depth knowledge of the ecology of the target biotic community, the ecosystem, and the evaluation criteria.
3.3.3. Multimetric Indices (MMIs)
The MMIs build on the multivariate approach and combine several quantifiable biological attributes (biometrics) and ecological characteristics of the ecosystem. The four common types of biometrics are abundance/composition, diversity/richness, sensitivity/tolerance, and functional diversity [213,214]. In an MMI, individual metrics are related predictably and reasonably to environmental pressures and impacts. Therefore, the method combines several metrics and different categories to generate a single assessment index, making the method more robust than single-metric approaches. However, there are some drawbacks during the development of the MMIs: (1) some information is lost, (2) redundancy of certainty, (3) vulnerability to compound errors, and (4) rigidity to method updates [215].
3.3.4. Biotic Indices
A biotic index is a numerical equivalent of biotic assemblage responses (sensitivity or tolerance) to anthropic disturbances [214,216]. Biotic indices assign different types of taxa to different sensitivity or tolerance levels based on numeric expressions (scores) of human-induced disturbances. Biotic indices rely on the diversity approach that characterises an ecosystem based on abundance, richness, and evenness as descriptors of the community structure. Less disturbed communities usually exhibit high diversity (taxa richness) and evenness among species in an ecosystem. Biotic indices have been widely used for the rapid bioassessment of aquatic ecosystems in SA due to their robustness, sensitivity, cost-effectiveness, ease of application, and interpretation [26,81,204,217].
SA has seen the development of biometric-based sampling protocols and rapid bioassessment schemes (RBS) [26]. The South African Scoring System, SASS-5 [189], uses stream macroinvertebrates to rapidly evaluate the aquatic ecosystem conditions [94,191,192,218]. Other national and regional RBSs have also been derived from the Chutter [219] SASS-1 model: the Zambian Invertebrate Scoring System (ZISS) [190], Botswana’s Okavango Assessment System (OKAS) [220], the Namibian Scoring System (NASS) [221], and the Tanzania River Scoring Systems (TARISS) [222].
The South Africa fish assemblage integrity index (FAII) integrates multiple fish and habitat ecological attributes [223]. The FAII was developed from the Karr 1998 [224] fish index of biotic integrity (F-IBI) and later modified by Kleynhans [225] into the fish response assessment index (FRAI). The FRAI measures the responses of fish assemblages to the cumulative effect of environmental changes in lotic systems.
Flora-based stream integrity assessment indices have also been developed: the Zambian Macrophyte Trophic Ranking (ZMTR) system [226] and the Harding and Taylor [227] South African Diatom Index (SADI). The SADI has been successfully applied to assess the Wemmershoek River catchment and river basins in South Africa [228].
3.3.5. Integrated Ecological Assessment (IEA)
The IEA refers to the simultaneous linkage of biological, ecotoxicological, and physical-chemical data and ecosystem components during the ecological assessment to define an ecosystem’s integrity [25,176,177]. Due to its compounded nature, the IEA provides “all-rounded and detailed” risk assessment feedback as a basis for implementing holistic aquatic ecosystem management plans. One of the increasingly adopted IEA systems is the ERA framework [14,229,230]. Several studies have investigated the ecological risks of mining pollution to biotic communities in different environmental matrices [12,231,232,233,234,235,236,237] and human health [10,24,195,238,239,240,241,242]. Nevertheless, the scope of this paper is limited to the aquatic ecological risk assessment (AERA) of heavy-metal pollution as an emerging concern and threat to the sustainability of the health and functioning of surface water systems of SA.
4. Aquatic Ecological Risk Assessment (AERA)
Aquatic ecosystems are integral to the biosphere’s survival since they provide requisite ecosystem goods and services. However, the ecological integrity of these systems is consistently under threat since the components providing benefits to nature and society are also highly vulnerable to deleterious anthropogenic impacts [15,243]. For instance, in mining environments, the major threats to freshwater ecosystems include heavy metals and metalloids [244,245], mine drainage [246,247], the fallout from atmospheric contamination [248], and sediment-laden waste pollution [249,250,251]. Hence, there is a need to develop an integrated method to monitor the health of aquatic ecosystems to ensure the sustained provision of benefits to nature and society [16]. AERA provides a comprehensive and reasonable approach to evaluating the current and potential anthropogenic impacts on aquatic resources [23,252].
A risk assessment determines the impact of a stressor(s) on the environmental (ecological risks) or human well-being (human health risks) [253]. An ecological risk assessment (ERA) evaluates the probability of present or potential risks driven by human actions and the likely environmental impacts [14,254]. Risks arise from a combination of the severity (nature and magnitude) and the probability (depending on the frequency of exposure) of effects from a proposed action(s) or stressor(s) [255]. The probabilities of risks may result from variability or uncertainty arising at the different tiers of the assessment framework. An action or stressor category may range from hydrological, geophysical, or biological to a chemical matrix, mostly anthropogenically mediated. Therefore, the ERA framework applies scientific knowledge and tools to evaluate the associated effects of stressors on receptors to generate useful information for a collaborative expert-guided risk management decision-making process to mitigate the different environmental stressors/risk factors [212]. The principal focus of an ERA is to minimise the probability of ecological risks evolving into possibilities (i.e., hazards) with deleterious effects by providing stakeholders with practical decision support and management tools [256].
The ERA principle was founded on three aspects of scientific inquiry: what events can occur, how they are likely to happen, and the endpoints from the set of events [257]. Therefore, the ERA process integrates three fundamental and logical phases: problem formulation, risk analysis, and risk characterisation [256,258]. Reporting to risk managers and other relevant stakeholders sets the stage for risk management or reevaluation, depending on the risk significance level [259]. The prevailing economic, social, technological, and political dynamics must be considered during risk management. Suter II et al. [255] prescribed the sociopolitical purposes of an ecological risk assessment: serving as a basis for technical decisions, providing legitimate redress to stakeholder concerns, and facilitating a common platform for stakeholder engagement and involvement in decision-making.
4.1. Application of Pollution Factors/Indices in ERA of Aquatic Systems
Environmental pollution indices are useful in establishing or estimating the ecological risks posed by contaminants naturally or anthropogenically introduced into different ecosystem matrices [260,261]. Numerous studies have applied contaminant pollution indices, such as the contamination factor (CF), degree of contamination (DC), geoaccumulation index (Igeo), enrichment factor (EF), pollution load index (PLI), potential ecological risk factor ((Eri), potential ecological risk index (PERI), and the combined pollution index (PLI), for ERA and monitoring of the impacts of anthropogenic activities to the levels of HM in the environment [101,200,238,262,263,264,265,266,267].
Table 2 describes the commonly used pollution indices and their applications, strengths, and weaknesses in ERA programs. Virtually all the indices described have wide applications and provide the criteria for classifying risk levels. From Table 2, however, it is apparent that a significant proportion of these factors/indices only consider the abiotic environmental matrix as a surrogate for evaluating the current and future ecological risks. This biasedness frequently results in lopsided conclusions and recommended remedial actions concerning risks to biotic communities [268,269].
Table 2. Characteristics and applications of environmental pollution factors and indices in the ERA of heavy-metal pollution.
| Index/Factor | Description and Classification | Application | Strengths (S) and Deficiencies (D) [260] | References | |
|---|---|---|---|---|---|
| 1 | Contamination Factor (CF) | Evaluates the ratio of contamination to that of background environmental HM levels. CF = CmCb, where cm is the concentration of metal m; cb is the pre-industrial concentration of metal m. Classification: CF < 1, low contamination; 1 ≤ CF ≤ 3, moderate contamination; 3 < CF≤ 6, considerable contamination; CF ≥ 6, very high contamination |
Reflects preliminary contaminant enrichment in the environment. | S: Simple and direct; individual factor determined per metal; compares between sample and reference concentrations; precise classification scale. D: No account for variability from natural processes; excludes the potential availability of other HM; requires the incorporation of background reference values. |
[232,251,261,263,272,273,274,275] |
| 2 | Degree of Contamination (DC) | DF is the sum of all HM contamination factors in a particular location. DC = ∑ni=1CF Classification: DC < 6, low degree; 6 ≤ DC < 12, moderate; 12 ≤ DC < 24, considerable degree; DC ≥ 24, very high degree |
Estimates extent of contamination from derived contamination factors. | S: Analysing unlimited HM possible; evaluates a sum of CF; classification scale available. D: Not widely used; no account for natural geochemical processes; inclusion of background HM reference values mandatory. |
[12,239,250,260,261,263,276,277,278] |
| 3 | Geo-accumulation index (Igeo) | Useful in evaluating HM contamination based on the ratio of the concentration in the soil/water to the geogenic background levels. Igeo = log2(Cn1.5Bn), where Cn is the measured concentration of the HM; Bn is the environmental background value of the metal; 1.5 is the background matrix correction coefficient to moderate the impact of possible variations due to lithogenic and anthropogenic influences. Classification: Igeo ≤ 0, uncontaminated; 0 < Igeo ≤ 1, uncontaminated to moderately contaminated; 1 < ≤ 2, moderately contaminated, 2 < ≤ 3, moderately to strongly contaminated; 3 < ≤ 4, strongly contaminated; 4 < ≤ 5, strongly to extremely contaminated; Igeo > 5, extremely contaminated. |
Evaluates the degree of metal contamination or pollution in the environment. | S: Wide usage; allows historical comparison of HM contamination; simplified quantitative index; correction for lithogenic interferences accounted for via the 1.5 correction coefficient; precise classification scale available. W: No account for the availability of HM of no interest; no account of the variability of natural geochemicals. |
[234,236,238,250,263,279,280] |
| 4 | Enrichment Factor (EF) | Evaluates the severity/ pollution state of anthropogenic enrichment of individual HM. EF = (Ms/Cref)(Mcr/Ccr), where Ms/Cref is the ratio of metal concentration in the sample to reference metal C; Mcr/Ccr is the ratio of the background value of metal M to the reference metal C. In ER determination, the reference values are included for normalisation (to compensate for distortions from geogenic/anthropogenic activities). Classification: EF < 2, none to minor enrichment; 2 ≤ EF < 5, moderate enrichment; 5 ≤ EF < 10, significant enrichment; 10 ≤ EF < 25, severe enrichment; 25 ≤ EF < 50, very severe enrichment; EF > 50, extremely severe enrichment. |
Determination of degree and status of pollution of individual HM by natural and anthropogenic factors. EF values of 0.5–1.5 indicate enrichment from natural geogenic processes. EF values > 1.5 reflect the influence of anthropogenic activities on the levels of HM present. The use of reference elemental values makes the EF index a more reliable indicator of HM pollution. |
S: HM source tracking; reduces HM variability; estimates anthropogenic impacts; evaluates pollution impact of individual metals; precise classification scale. W: Relies on reference values; choice of appropriate geochemical background critical. |
[272,273,275,280,281,282,283] |
| 5 | Pollution Load Index (PLI) | PLI is an empirical pollution indicator expressed geometrically as a mean (nth root) of the EF of all the metals evaluated in a particular site. PLI for a single site = (EF1 × EF2 × EF3 ×…× EFn)1/n, where n is the number of elements involved. Classification: PLI < 1, no or low pollution level; PLI = 1, baseline/background pollution; PLI > 1, progressive pollution. |
Empirical index for comparative assessment of environmental pollution. PLI accounts for the overall effect of all the HM per site. |
S: Combines multiple HM analyses; easy application and wide usage; allows site comparison; precise classification scale available. D: Omits the influence of natural geochemical processes; relies on the geochemical background and EF values; no account for the availability of other HM outside the scope of interest. |
[12,183,210,247,275,280,284] |
| 6 | Potential Ecological Risk Factor (Eri) | The Eri determines ecological risk as influenced by HM contamination and responses of biocoenosis to toxicity. Eri = TRF × CF, where TRF is the toxic response factor calculated individually for each HM and depends on the sediment toxic factor; CF is the contamination factor for each metal. Classification: Eri <40, low ER; 40< Eri < 80, moderate ER; 80< Eri < 160, considerable ER; 160 < Eri < 320, significant ER; Eri > 320, severe ER. |
Quantitatively estimates the potential ecological risk of an environmental contaminant. | S: Widely used; easy application; accounts for HM impact on biota; precise classification scale. D: Relies on CF and TRF estimators for determination; excludes the potential availability of other HM in the environment. |
[68,236,261,263,275,285] |
| 7 | Potential Ecological Risk Index (PERI) | Summation of all Eri values calculated for a contaminant in an area. PERI = ∑ Eri, where Eri is a single index for each element evaluated. Classification: PERI <150, low risk; 150 ≤ PERI < 300, moderate risk; 300 ≤ PERI < 600, high risk; PERI > 600, significantly high ER. |
PERI evaluates the degree of environmental risks from HM pollution based on the sensitivity of biotic communities to contaminant concentrations. | S: Widely used comprehensive index; accounts for toxicity and ecological sensitivity of HM; precise scale of classification. D: Requirement for TRF (only Cd, Hg, Pb, As, Cr, Cu, Ni, and Zn available) and CF values. |
[249,261,263,267,275,286,287,288,289] |
| 8 | Combined Pollution Index (CPI) | A combined PLI (CPI) determines the overall pollution for all the sites of interest. CPI for a study area = ∑ PLIkm, where PLIk are the PLI values for k sites; m is the number of HM considered. |
CPI estimates the integrated pollution status of an area based on the individual PLI values. | S: Overall pollution estimator; easy application. D: Heavy reliance on other estimators (TRF, CF, Eri); no distinction of variability due to natural and anthropogenic influences. |
[183,279,290] |
To address this challenge, Grapentine et al. [270] proposed four lines of evidence (LOE) (i.e., surface sediment chemistry, laboratory toxicity bioassays, benthic community structure, and benthic bioaccumulation and biomagnification gradients). The LOE incorporates exposure, effect, weight of evidence (WOE), and risk elements in the ERA process. Therefore, the LOE selected depends on the environmental stressors of potential concern (SOPCs) and the biological receptors of potential concern (ROPCs), based on the spatiotemporal considerations and ecological relevance. Chapman and Hollert [271] recommended that the application of a sedimentological analysis in ERA should ensure that the LOE applied adequately accounts for critical ERA components (Problem Formulation, Exposure, and Impacts); addresses cause-and-effect; and sufficiently considers other “nonchemical” stressors [14,255].
4.2. Conceptualisation and Potential Application of AERA in Freshwater Systems of SA
4.2.1. The five-Tiered AERA Concept for Aquatic Systema in Degraded Mining Landscapes
Based on the risk hypothesis, the AERA framework is conceptualised around the interrelationships between the risk elements, risk exposure pathways, receptor exposure, endpoint impact measurement, and characterisation of ecological risks in aquatic environments [255]. The aim is to identify and map the potential ecological risks of mining waste, predisposing factors, monitoring mechanisms, and management options for the hazards to aquatic resources in mining-generated wastelands. Hence, a triad approach, modified from the 1998 US Environmental Protection Agency ERA guidelines [258], has been adopted and modified to optimise the potential risks assessment framework for aquatic systems draining these wastelands (Figure 4). The conceptual model defines the risk assessment framework from problem formulation, risk assessment, risk characterisation, and transitions to management decision-making and risk management. These components, further elaborated below, are classified at three main levels: stakeholder engagement in planning, expert(s) participation, and management evaluation and decision-making sessions. These subcomponents are integrated to establish a holistic risk assessment framework that incorporates the key environmental indicators in the three constituents of the aquatic ecosystem matrix: water, sediment, and biota.
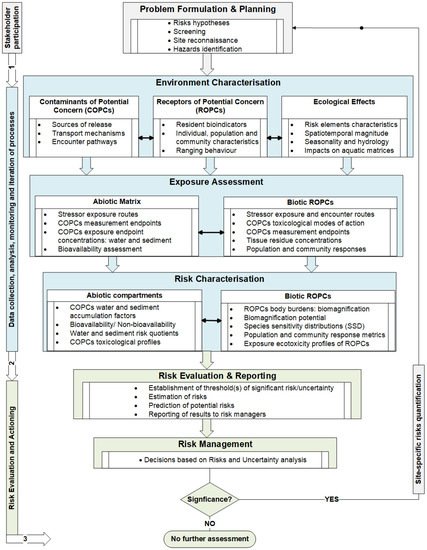
Figure 4. A conceptual framework to assess the potential ecological risks to aquatic systems draining heavy-metal mining landscapes.
Problem Formulation and Risk Hypothesis
The assessment is on the potential aquatic ecological risks linked to post-mining landscapes. It is hypothesised that there is a high potential ecological risk to the resident biotic communities in aquatic ecosystems due to exposure to particular risk factors, the environmental stressors of potential concern (SOPCs), associated with mining wastelands. Since mine waste elements enter aquatic systems either as a solid flow (e.g., collapsed waste rock pile) or semisolid (e.g., tailings from dams); liquid (e.g., surface mine drainage, contaminated plumes in groundwater, or heap and dump leach); or direct atmospheric fallout (e.g., fugitive dust), the exposure pathways are initially defined. An aquatic ecosystem’s risk factors and likely impacts can be physical, chemical, biological, or combined. The representative ecological receptors are the resident aquatic biota exposed to the potential risks at the spatial and temporal scales and can provide “historical evidence” of the SOPCs. The risk questions formulated from this theory are used to address the complete exposure pathways, assessment, and measurement endpoints in risk evaluation and characterisation.
Exposure Assessment
The potential environmental stressors (SOPCs) are identified by analysing the physicochemical properties of water, sediment, and sediment-associated contaminants (SACs) to quantify contamination levels compared to reference sites and respective quality guidelines. This information is also important in interpreting endpoint ROPC responses to physicochemical environmental fluctuations and stressors. Toxicity tests on streamwater will provide supporting indications of episodic anthropogenic pollution events. Sediment analyses of toxicity determine whether the responses observed in the representative ROPC communities are related to the SACs of concern rather than other multiple environmental risk factors. Water and sediment tests are also employed to discriminate contaminated or impacted sites from the reference sites.
Effects Assessment
Representative biotic communities serve as bioindicators or receptors of potential contaminants (ROPCs). In addition, the variability in the community structure of benthic ROPCs between impacted and reference sites is used to indicate the biological responses to the spatial and temporal magnitudes of environmental contaminations. The toxicity factors (TFs), body burdens (bioaccumulation), and trophic transfer (biomagnification) profiles of the ROPCs explain the toxicity endpoints or observed effects (OEs) (e.g., growth, mortality, survival, or reproductive rates) on representative receptor populations and community structure [256]. Additionally, sediment-associated contaminants (SACs), biota–sediment accumulation factors (BSAFs), and biota–water accumulation factors (BWAFs) are determined to estimate the magnitude and likelihood of SOPC transfer from the abiotic matrix to ROPC populations and communities [254]. The level of SOPCs in the tissues of receptor biota give evidence of the contaminant bioavailability and stressor origin [291] or nonbioavailability [270]. Dissolved SOPCs usually indicate the bioavailability of chemical stressors. However, nonbioavailability does not negate the associated potential risks since the bioaccumulation and biomagnification of toxic materials can be detrimental at higher trophic levels in the aquatic food web.
Risk Characterisation and Sources of Unpredictability
The characterisation of risks is both on the observed effects (qualitative) and outcomes of different risk quantification methods (e.g., community metrics, biota–water accumulation factors, toxicity factors, and biota–sediment accumulation factors) at predefined “significant risk levels” [255]. The causality between receptor exposure profiles and exposure endpoint effects are derived and employed to develop potential ecological risk index(es). Index development considers the diversity and complexity of aquatic ecosystems, which may increase the unpredictability of the outcomes. The unpredictability of endpoints can arise from uncertainty, measurement and analytical errors, and ignorance or confusion during certain developmental stages (e.g., conceptualisation and risk characterisation) [255]. For instance, uncertainty usually determines the confidence level in developing and applying the indices in a risk management toolkit [212]. An illustration of uncertainty is the spatiotemporal influence on foraging, breeding, or reproduction interdependencies that periodically determine community population dynamics and composition patterns.
Additionally, the presence or absence of a keystone predator(s) or multiple environmental stressors besides the SPOCs under consideration may significantly affect the community characteristics’ diversity. Such uncertainties will be factored in during risk description, index development, and the building of risk management scenarios. Variabilities can arise from events (e.g., climate and seasonality) or entities (e.g., stressor properties) that cannot be manipulated, making them indeterminate. Errors can be incurred at any stage in the risk assessment process from design, measurement, sampling, analysis, or the interpretation of data. Efforts are geared towards minimising or estimating potential errors statistically [292]. Ignorance (“unknown unknowns”) and confusion due to the complexity of the existing environmental problem(s) may introduce unrecognisable uncertainty during the risk description process [255].
Risk Mitigation and Management
The assessment outcome provides information on the ecological status, potential risk factors and risks, and mitigation and management options. This process is based on the established comprehensive ecological risks assessment framework for aquatic systems in the mining-generated wastelands. Implications for current and future uses of the impacted sites are clearly defined to enhance the informed judgements for risk mitigation and management. However, decision-making lies with the risk managers and policy managers. Nevertheless, significant uncertainty levels usually warrant site-specific characterisation and further reassessment to develop reevaluated potential risk indices through a step-wise risk assessment iteration process [17,259].
This entry is adapted from the peer-reviewed paper 10.3390/min12020225
This entry is offline, you can click here to edit this entry!