Your browser does not fully support modern features. Please upgrade for a smoother experience.
Please note this is an old version of this entry, which may differ significantly from the current revision.
Subjects:
Health Care Sciences & Services
The technological developments and the rise in highly processed food availability have introduced the concept of ultra-processed food (UPF). Food classification systems based on processing are now a new basis for epidemiological research. Different results from these classifications might influence conclusions on the population’s consumption of UPF or its association with health outcomes.
- food processing
- food classification systems
- household surveys
- ultra-processed food
1. Introduction
The replacement of minimally processed food and culinary home preparations for ready-to-eat products is increasing worldwide, which has been overlooked as a cause of concern [1,2]. These changes in the population’s dietary patterns have been accompanied by increases in the prevalence of obesity and other chronic diseases [3]. Many studies have linked the consumption of highly processed food with several chronic diseases such as cardiovascular disease, cancer, diabetes, metabolic syndrome, anxiety, asthma, autism, in addition to overweight and obesity [4,5,6,7,8,9,10].
Food technologies are commonly developed to preserve and keep food quality attributes [11,12]. Some positive impacts of food processing are, for example, the increase in shelf life and in nutrient bioavailability [13]. However, food processing can also have negative impacts, such as high content of artificial additives and loss of nutrients [14]. Similarly, the content of food in vitamins and minerals, sodium and fibers can be affected by industrial processing [15]. Furthermore, the industry also uses food technology to make food more palatable and with different textures, increasing its consumption [16].
The significance of the techniques and ingredients developed or created by food technology, on the nature of food and on the state of human health, was generally understated previously. Lately, technological developments and the rise in the availability of highly processed food have introduced the concept of ultra-processed food (UPF) to classify these kinds of products [17]. A new approach to industrial food processing and its impact on human health was developed. New food classification systems have been created, due to changes in the scope and purpose of food processing. According to our knowledge, as to the degree of processing, seven different food classification systems have been proposed by researchers worldwide [1,18].
The importance of these food classification systems is that they are a new basis for epidemiological and experimental research and, therefore, for official reports that include dietary guidelines, with the purpose of promoting and protecting health [1,19].
As far as we are concerned, only a few studies performed comparisons between different processing-based food classification systems using the same database [20,21]. One of these studies evaluated the classification of a list of 100 of the most consumed foods [21], the other assessed the contribution of UPF on the overall diet [20], and both used individual-based dietary measures.
Food frequency questionnaires, 24-h recalls, and food diaries are examples of direct methods of individual-based dietary assessments. Individual-level assessment measures food intake, while indirect methods refer to food supply or availability, usually estimated at the national or household level [22]. Household budget survey (HBS) data are particularly relevant once often they are the only tool available to assess food consumption and time trends of populations [23,24]. Since HBS data are freely available and their detailed information allows its use to assess UPF availability contribution, they were used in this study [3].
2. Comparison of Different Food Classification Systems
2.1. Comparing the Different Groups among Classification Systems
Table 1 highlights the similarities and differences between the 5 classifications under study. These classification systems differ from each other in the number of groups: IARC and IFPRI classify foods into 3 groups, NOVA and UNC into 4, and IFIC into five groups. In these classifications, group 1 is mainly “raw food”. Group 2, named “processed culinary ingredients” by NOVA, shows similarities to groups “primary processed foods” by IFPRI, and “basic processed food” by UNC. Group 3, named “processed foods” by NOVA, has some similarities to the group “moderately processed foods” by IARC and UNC and “mixtures of combined ingredients” by IFIC. For IFIC, the group “food for preservation”, was also considered in Group 3; although presented as the second group of IFIC classification, the examples refer to processed foods and not culinary ingredients. For NOVA, IARC, and UNC, this group contains foods that are minimally processed, but with the addition of salt, sugar, oils, and other culinary ingredients, in vacuum-package or under a controlled atmosphere. Group 4 is comprised of industrial formulations or foods prepared by the industry, packaged, ready for consumption and with a high content of salt, sugars and fat. For IFIC classification system these foods may contain preservatives used with the aim of promoting safety, flavour, and visual appeal. For these four classification systems, these foods are considered ready-to-eat foods. In the IFIC classification, for better comparison with the other classification systems, both groups (ready-to-eat and prepared meals) were joined in group 4 named highly or ultra-processed food. In this group, the five classification systems have similarities: IARC, IFPRI and UNC have named this group as highly processed foods, and NOVA as ultra-processed food.
Table 1. Comparison among food processing classification systems: summary of differences and similarities.
| Classification Systems | Degree of Processing Groups | |||
|---|---|---|---|---|
| 1 | 2 | 3 | 4 | |
| IARC—Europe (2009) | Non Processed Food | Moderately PF | Highly PF | |
| NOVA—Brazil (2010, 2016) | Unprocessed food or Minimally PF | Processed culinary ingredients | Processed food | Ultra-processed food |
| IFPRI—Guatemala (2011) | Unprocessed Food | Primary PF | Highly PF | |
| IFIC—USA (2012) | Minimally PF | FP for preser-vation | Prepared foods/meals | |
| Mixtures of combined ingredients | Ready-to-eat processed | |||
| UNC—USA (2016) | Unprocessed food | Basic PF | Moderately PF | Highly PF |
Figure 1 presents the comparison among the percentage contribution obtained for each food and beverages category within the different degree of processing groups proposed by each classification system. In Figure 1 the differences and similarities among classification systems are pictorially highlighted, being clear that IFPRI, IFIC and UNC show a very similar configuration while NOVA and IARC present considerably different ones.
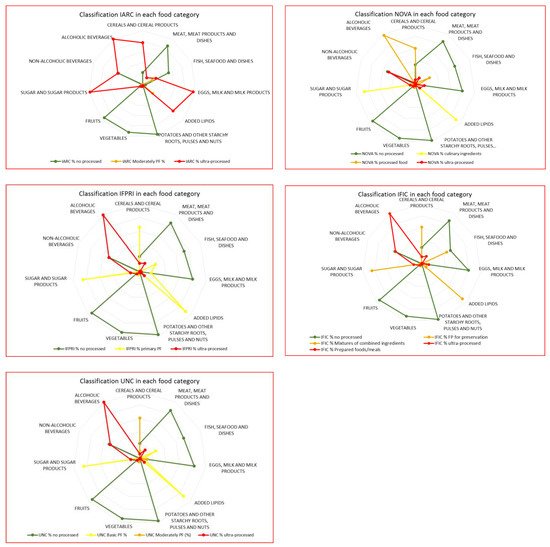
Figure 1. Comparison among food processing classification systems: percentage contribution of their different degree of processing groups by food and beverages categories—Portuguese household budget survey, 2000.
2.2. Comparing the Results for Highly/Ultra-Processed Food and Beverages among Classification Systems
For the global diet, the highly/ultra-processed availability contribution according to each one of the classification systems was: NOVA 10.2%, UNC 15.2%, IFPRI 16.7%, IFIC 17.7% and IARC 47.4% (Table 2).
Table 2. Contribution of highly/ultra-processed food and beverages according to different classification systems: global and by food and beverages categories—Portuguese household budget survey, 2000.
| % of Highly/Ultra-Processed Food | ||||||||
|---|---|---|---|---|---|---|---|---|
| Global and by Food and Beverages Categories |
IARC | NOVA | IFPRI | IFIC | UNC | Average | St Dev | Discrepancy Range (DR) |
| Global | 47.40 | 10.20 | 16.70 | 17.70 | 15.20 | 21.26 | 14.97 | 38.1 |
| CEREALS AND CEREAL PRODUCTS | 77.70 | 7.10 | 12.10 | 11.50 | 6.40 | 23.48 | 30.39 | 71.3 |
| MEAT, MEAT PRODUCTS AND DISHES | 14.60 | 12.30 | 14.60 | 14.60 | 14.60 | 14.14 | 1.03 | 2.3 |
| FISH, SEAFOOD AND DISHES | 27.00 | 1.10 | 1.30 | 1.20 | 1.10 | 6.34 | 11.55 | 25.9 |
| EGGS, MILK AND MILK PRODUCTS | 94.80 | 15.30 | 2.80 | 12.00 | 0.60 | 23.68 | 40.01 | 94.2 |
| ADDED LIPIDS | 74.90 | 9.80 | 9.30 | 0.00 | 9.30 | 20.66 | 30.60 | 74.9 |
| POTATOES, PULSES AND NUTS | 2.10 | 2.10 | 2.10 | 2.00 | 0.70 | 1.66 | 0.61 | 1.4 |
| VEGETABLES | 4.00 | 0.00 | 0.00 | 0.00 | 0.00 | 0.80 | 1.79 | 4.0 |
| FRUITS | 5.10 | 5.10 | 5.10 | 4.90 | 4.90 | 5.02 | 0.11 | 0.2 |
| SUGAR AND SUGAR PRODUCTS | 98.80 | 8.70 | 13.80 | 13.80 | 13.80 | 29.78 | 38.65 | 90.1 |
| NON-ALCOHOLIC BEVERAGES | 50.20 | 48.60 | 50.20 | 48.70 | 48.70 | 49.28 | 0.84 | 1.6 |
| ALCOHOLIC BEVERAGES | 100.00 | 2.60 | 100.00 | 100.00 | 100.00 | 80.52 | 43.56 | 97.4 |
Table 2 shows the precise percentages of highly/UPF in each food and beverages category, by food classification system. The highest discrepancies in results were observed for five categories: Cereals and cereal products, Eggs, Milk, and milk products, Added lipids, Sugar and sugar products, and Alcoholic beverages. The categories with the most homogeneous results among the five classification systems were Meat, Potatoes, Fruits, and Non-alcoholic beverages.
In four of the five most discrepant food categories, it was observed that IARC presented the highest percentages, whereas for alcoholic beverages, only NOVA presented a value (2.6%) different from 100% (Table 2). Details about these five categories are highlighted in Table 3.
Table 3. Contribution of highly/ultra-processed food and beverages according to different classification systems by food and beverages subcategories—Portuguese household budget survey, 2000.
| % of Highly/Ultra-Processed Food | ||||||||
|---|---|---|---|---|---|---|---|---|
| Global and by Food Categories | IARC | NOVA | IFPRI | IFIC | UNC | Average | StDev | Discrepancy Range |
| CEREALS AND CEREAL PRODUCTS | ||||||||
| Bread and Rolls | 100.00 | 1.20 | 0.00 | 0.00 | 0.00 | 20.24 | 44.59 | 98.80 |
| Bakery products | 100.00 | 100.00 | 100.00 | 87.80 | 100.00 | 97.56 | 5.46 | 12.20 |
| Rice, cereals and products | 7.30 | 7.30 | 7.30 | 7.30 | 7.30 | 7.30 | 0.00 | 0.00 |
| Flour | 100.00 | 0.00 | 0.00 | 0.00 | 0.00 | 20.00 | 44.72 | 100.00 |
| Pasta | 100.00 | 0.00 | 100.00 | 100.00 | 0.00 | 60.00 | 54.77 | 100.00 |
| EGGS, MILK AND MILK PRODUCTS | ||||||||
| Eggs | 0.00 | 0.00 | 0.00 | 0.00 | 0.00 | 0.00 | 0.00 | 0.00 |
| Milk | 98.70 | 4.20 | 0.00 | 0.00 | 0.00 | 20.58 | 43.71 | 94.50 |
| Cheese | 100.00 | 8.30 | 0.00 | 0.00 | 0.00 | 21.66 | 43.94 | 91.70 |
| Yogurts | 97.30 | 96.40 | 23.60 | 100.00 | 5.20 | 64.50 | 46.21 | 94.80 |
| ADDED LIPIDS | ||||||||
| Lipids of animal origin | 100.00 | 10.10 | 0.00 | 0.00 | 0.00 | 22.02 | 43.81 | 89.90 |
| Vegetable fat and margarines | 100.00 | 100.00 | 100.00 | 0.00 | 100.00 | 80.00 | 44.72 | 100.00 |
| Olive oil | 30.10 | 0.00 | 0.00 | 0.00 | 0.00 | 6.02 | 13.46 | 30.10 |
| Seed oils (olive oil excluded) | 100.00 | 0.00 | 0.00 | 0.00 | 0.00 | 20.00 | 44.72 | 100.00 |
| SUGAR AND SUGAR PRODUCTS | ||||||||
| Sugar | 100.00 | 0.00 | 0.00 | 0.00 | 0.00 | 20.00 | 44.72 | 100.00 |
| Sugar products | 92.20 | 58.40 | 92.20 | 92.20 | 92.20 | 85.44 | 15.12 | 33.80 |
| ALCOHOLIC BEVERAGES | ||||||||
| Wine | 100.00 | 0.00 | 100.00 | 100.00 | 100.00 | 80.00 | 44.72 | 100.00 |
| Beer | 100.00 | 0.00 | 100.00 | 100.00 | 100.00 | 80.00 | 44.72 | 100.00 |
| Spirits | 100.00 | 100.00 | 100.00 | 100.00 | 100.00 | 100.00 | 0.00 | 0.00 |
For the cereals and cereal products category, the higher resemblance is in the Rice subcategory. Bakery products also showed similar results. The higher discrepancies were observed in subcategories of bread and rolls, pasta and flour, where some systems classify 100% of the products and none of them. (Table 3)
Unanimity is observed in the Eggs subcategory classification, never considered as UPF. The yogurt subcategory is almost fully included as UPF for NOVA, IARC, and IFIC but not for IFPRI and UNC. The IARC system classifies 100% of cheeses and 98.7% of milk as highly processed, while the NOVA classifies only 8.3% of cheeses and 4.2% of milk as UPF. The other classification systems (IFPRI, UNC, IFIC) do not classify any type of cheese as highly/UPF. (Table 3)
For the category of Added lipids, it is visible that all classification systems consider the vegetable fat and margarine subcategory as UPF, except the IFIC, which classifies this subcategory as mixtures of combined ingredients. Relevant discrepancies were observed in the subcategories of lipids of animal origin, seed oils and olive oil. (Table 3)
The highest discrepancy in the category of Sugar and Sugar products was observed in the sugar subcategory, as only the IARC system classifies sugar as highly processed. All other classifications (NOVA, IFPRI, UNC, IFIC) classify this subcategory as basic/primary processed food or culinary ingredients. Sugar products contribution is similar and almost total in all classification systems but not in NOVA, with a much lower contribution (58.4%). (Table 3)
The discrepancy in the category of Alcoholic beverages is concentrated in the NOVA system, which does not classify Wine and Beer as UPF but instead as processed food, while all other classifications consider 100% of these two subcategories as highly/UPF. Unanimity was observed for Spirits, all considered as UPF in the five classification systems. (Table 3)
This entry is adapted from the peer-reviewed paper 10.3390/nu14040729
This entry is offline, you can click here to edit this entry!