Your browser does not fully support modern features. Please upgrade for a smoother experience.
Please note this is an old version of this entry, which may differ significantly from the current revision.
Bangladesh has substantially increased aquaculture production over the last few decades, and the exotic species share a significant portion of the total fish production. Although exotic species are contributing to aquaculture production, a few of them are causing biodiversity loss and genetic erosion of native species. The African catfish Clarias gariepinus is a highly carnivorous species and predates small indigenous freshwater fishes when escaping into natural water bodies.
- catfish
- Claris batrachus
- C. gariepinus
- aquaculture
- Bangladesh
1. Introduction
The walking catfish Clarias batrachus belonging to the Clariidae family, commonly known as walking catfish, is a popular food fish in the Indian sub-continent, including Bangladesh [1,2,3]. Catfish are a diverse group of fishes distributed from freshwater to marine environments, such as Clarias batrachus in freshwater [4] and Arius maculatus in brackish water [5]. Three species of the Clarias genera are important aquaculture candidates in Asia, namely C. batrachus in the Indian subcontinent [6], C. fuscus in Taiwan region [7,8], and C. macrocephalus in South-East Asia [9]. The native range of C. batrachus is Asia but Clarias aff. Batrachus from Indochina and Sundaland has been incorrectly identified as Clarias batrachus from Java [10]. The widely distributed African catfish C. gariepinus expanded its native range from the South to the Middle East and Eastern Europe [11].
Many exotic species have been introduced in Bangladesh for aquaculture in the past few decades, and some species are playing important roles in aquaculture production. A few of the exotic species have been proven detrimental to aquatic biodiversity and eventually banned for aquaculture in Bangladesh. The African magur, Clarias gariepinus, was introduced in Bangladesh in 1989 from Thailand by the Ministry of Fisheries and livestock (MoFL), but banned from aquaculture since 2014. The introduction of C. gariepinus caused native biodiversity loss due to its predatory nature [12]. The feasibility of hybrid vigor production between C. batrachus × C. gariepinus has been assessed but attained limited success [13]. Hybridization of C. gariepinus male × C. macrocephalus female in Vietnam has been widely practiced [14]. However, the potential of hybrids for a decline in the abundance of C. batrachus in the Chao Phraya and Mekong Basins has been considered [13]. Although aquaculture of C. gariepinus has been banned in Bangladesh [15], the availability of this species has been reported by consumers and farmers. Hybridization of C. batrachus × C. gariepinus has been known to occur in India [16] and in the Mekong Basin of Vietnam and Thailand [13]. Unplanned hybridization between C. gariepinus and C. batrachus is considered illegal in Bangladesh. Hybrids are less accepted by consumers due to differences in appearance and taste. In addition, the escape of the hybrids in natural water bodies could cause irreversible loss of the native biodiversity. If the purity of native stock is compromised in the natural population, it would be an irreversible problem for the future.
2. Sequence Analysis of COI and Cytb Genes
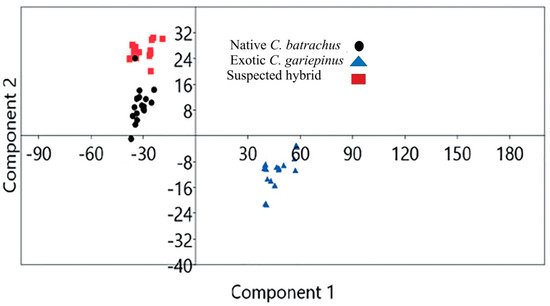
Validation of morphological identification by geometric morphometry: Based on geometric morphometry, the scattered plot of the landmark points showed that native C. batrachus, suspected hybrid and exotic C. gariepinus were morphologically distinguishable (Figure 3). The principal component 1 (PCA 1)_and PCA 2 of landmark points showed that native C. batrachus, suspected hybrid exotic C. gariepinus formed a separate cluster.

Figure 3. Scatter plot generated 13 landmark landmark points based on geometric morphometry of native Clarias batrachus, suspected hybrid and exotic C. gariepinus.
3. Sequence Analysis of COI and Cytb Genes
In the COI gene, 751 sites were identified where 76 (10.12%) were conserved; 670 (89.88%) were variable, which indicated a high level of variation among C. batrachus, C. gariepinus, and the hybrid. The average nucleotide composition of the COI gene was 29.3%, 26.6%, 24.6%, and 19.5% for T, C, A, and G, respectively. The AT content was higher than GC content in all the samples. Higher differences were observed between the sequence pair of C. batrachus of Bangladesh and reference C. batrachus from the Philippines and Indonesia, Sequenced C. gariepinus, and reference C. batrachus from the Philiphines and Indonesia. Higher differences were not observed between the sequenced C. gariepinus and suspected hybrid (Table 2).
Table 2. The estimated net base composition bias disparity between COI nucleotide sequences of native Clarias batrachus suspected hybrid and exotic C. gariepinus.
| No | Species Name | 1 | 2 | 3 | 4 | 5 | 6 | 7 |
|---|---|---|---|---|---|---|---|---|
| 1 | C. batrachus 1 (MG988399) | |||||||
| 2 | C. batrachus (Philiphine) | 0.189 | ||||||
| 3 | C. batrachus (Indonesia) | 0.691 | 0.000 | |||||
| 4 | C. batrachus (India) | 0.000 | 0.000 | 0.000 | ||||
| 5 | C. gariepinus (MG988400) | 0.000 | 1.328 | 1.961 | 0.900 | |||
| 6 | C. gariepinus (Indonesia) | 0.318 | 0.000 | 0.000 | 0.000 | 1.370 | ||
| 7 | C. gariepinus (Nigeria) | 0.146 | 0.000 | 0.000 | 0.000 | 1.068 | 0.000 | |
| 8 | Suspected hybrid (MG988401) | 0.000 | 1.258 | 1.909 | 0.923 | 0.000 | 1.440 | 1.235 |
The values (>0) in the table indicate the larger differences in base composition biases than the expected bases between the studied COI nucleotide sequences [31].
4. Transition/Transversion Bias
The estimated transition/transversion bias (R) among the COI gene sequences of the Clarias genus was 1.12. The rates of transitional and transversional substitutions are presented in bold and italics, respectively (Table 3). The nucleotide frequencies were A = 24.91%, T/U = 29.34%, C = 26.39% and G = 19.36%. The rates of transitional substitution from A to G, T to C, C to T, and G to A were 8.76%, 15.39%, 17.11%, and 11.27%, respectively (Table 2). The rates of transversional substitution from A to T, A to C, T to A, T to G, C to A, C to G, G to T, and G to C were 6.96%, 6.26%, 5.9107%, 4.59%, 6.96%, and 6.26%, respectively (Table 3). The rates of transitional substitution of the COI nucleotide sequences were higher (52.547%) than transversional substitution (47.453%).
Table 3. The estimated maximum likelihood pattern of nucleotide substitutions.
| A | T | C | G | |
|---|---|---|---|---|
| A | - | 6.9605% | 6.2622% | 8.7613% |
| T | 5.9107% | - | 15.3969% | 4.5926% |
| C | 5.9107% | 17.1140% | - | 4.5926% |
| G | 11.2759% | 6.9605% | 6.2622% | - |
The rates of different transitional substitutions are presented in bold, and transversions substitutions are presented in italics.
5. Homogeneity of Substitution Patterns of COI Sequences
The estimated p values smaller than 0.05 (considered significant and marked with an asterisk) are presented above the diagonal in Table 4. The estimated disparity index per site is presented for each sequence pair above the diagonal in Table 4. The p-values were larger than 0.05 between sequence pairs of reference C. batrachus from the Philippines and Indonesia; the reference C. batrachus from India and Bangladesh relative to the reference from the Philippines and Indonesia; the Bangladeshi sequence of native C. batrachus and C. gariepinus; the C. gariepinus from Nigeria, Indonesia and C. batrachus from India, Indonesia, and the Philippines; the sequence of suspected hybrid and native C. batrachus and exotic C. gariepinus. The sequences of the COI gene in native C. batrachus evolved with the same pattern of substitution like the species originating from other counties (Table 4).
Table 4. Test of the homogeneity of substitution patterns between COI sequences of native Clarias batrachus, suspected hybrid and exotic C. gariepinus.
| Sl.No | Species Name | 1 | 2 | 3 | 4 | 5 | 6 | 7 | 8 |
|---|---|---|---|---|---|---|---|---|---|
| 1 | C. batrachus 1 (MG988399) | 0.189 | 0.691 | 0.000 * | 0.000 * | 0.318 | 0.146 | 0.000 * | |
| 2 | C. batrachus (Philiphine) | 0.194 | 0.000 * | 0.000 * | 1.328 | 0.000 * | 0.000 * | 1.258 | |
| 3 | C. batrachus (Indonesia) | 0.108 | 1.000 | 0.000 * | 1.961 | 0.000 * | 0.000 * | 1.909 | |
| 4 | C. batrachus (India) | 1.000 | 1.000 | 1.000 | 0.900 | 0.000 * | 0.000 * | 0.923 | |
| 5 | C. gariepinus (MG988400) | 1.000 | 0.044 | 0.012 | 0.100 | 1.370 | 1.068 | 0.000 * | |
| 6 | C. gariepinus (Indonesia) | 0.234 | 1.000 | 1.000 | 1.000 | 0.032 | 0.000 * | 1.440 | |
| 7 | C. gariepinus (Nigeria) | 0.332 | 1.000 | 1.000 | 1.000 | 0.050 | 1.000 | 1.235 | |
| 8 | Suspected hybrid (MG988401) | 1.000 | 0.024 | 0.022 | 0.082 | 1.000 | 0.026 | 0.046 |
Note: * means the p values smaller than 0.05 (p < 0.05) are considered as significant, which indi-cating the rejection of the null hypothesis that the sequences have evolved with the same pattern of substitution.
6. Genetic Distance
The lowest genetic distance was found between suspected hybrid and C. gariepinus (0.295). The highest genetic distance (6.238) was found between C. gariepinus from Indonesia and Bangladeshi C. batrachus. Low levels of genetic divergence (0.295–0.339) were found among sequenced native Clarias batrachus, suspected hybrid and exotic C. gariepinus (in Bangladesh, whereas interspecies genetic divergence was found between C. batrachus and C. gariepinus from other countries (Table 5). The pairwise genetic distances based on nucleotide sequence divergences are presented in Table 5.
Table 5. Pairwise genetic distances of Clarias species from different countries based on a Kimura-2 parameter (KP2) model.
| No | Species Name | 1 | 2 | 3 | 4 | 5 | 6 | 7 | 8 |
|---|---|---|---|---|---|---|---|---|---|
| 1 | C. batrachus 1 (MG988399) | ||||||||
| 2 | C. batrachus (Philiphine) | 4.931 | |||||||
| 3 | C. batrachus (Indonesia) | 3.283 | 3.110 | ||||||
| 4 | C. batrachus (India) | 4.122 | 2.137 | 2.302 | |||||
| 5 | C. gariepinus((MG988400) | 0.339 | 5.005 | 4.400 | 4.635 | ||||
| 6 | C. gariepinus (Indonesia) | 2.837 | 4.987 | 4.638 | 6.238 | 2.594 | |||
| 7 | C. gariepinus (Nigeria) | 4.055 | 4.636 | 5.095 | 3.147 | 4.025 | 2.315 | ||
| 8 | Suspectred hybrid (MG988401)) | 0.311 | 4.706 | 4.297 | 4.763 | 0.295 | 2.631 | 4.629 |
7. Phylogenetic Tree Using COI Nucleotide Sequences by Maximum Likelihood Methods
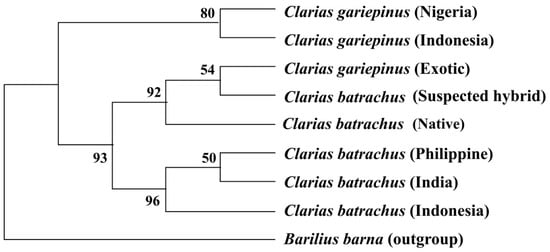
The phylogenetic tree inferred from COI nucleotide sequences based on the maximum likelihood method showed that all the sequenced native C. batrachus and exotic C. gariepinus formed a single clade, where C. gariepinus and suspected hybrid and C. gariepinus formed a sister clade. The sequenced C. batrachus of Bangladeshi did not cluster with any of the reference sequences C. batrachus originated from other countries. However, C. batrachus from India, Indonesia, and the Philippines formed one clade. C. gariepinus from Nigeria and Indonesia formed a sister clade (Figure 4).

Figure 4. Rooted phylogenetic tree inferred from COI nucleotide sequences using maximum likelihood method. The numbers indicate the bootstrap value, which validates the sister taxa and clade formation in the phylogenetic tree.
8. Phylogenetic Tree Using Cytb Nucleotide Sequences by Maximum Likelihood Method
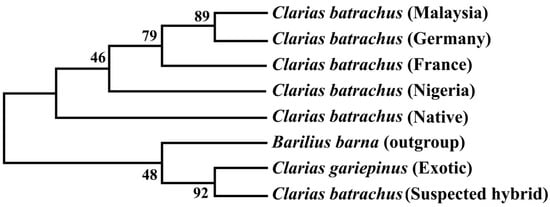
The phylogenetic tree based on the Cytb nucleotide sequences was used to validate the phylogenetic tree inferred from the COI nucleotide sequence (Figure 5). The results showed that sequenced suspected hybrid formed sister taxa with the sequenced C. gariepinus. The native C. batrachus formed a clade with C. batrachus of originated from different countries (Nigeria, France, Germany, and Malaysia) except suspected hybrid and C. gariepinus. The formation of sister clade of suspected hybrid with native C. batrachus and C. gariepinus confirmed the occurrence of hybridization of C. batrachus and C. gariepinus in Bangladesh, which validated the results based on COI gene.

Figure 5. Unrooted phylogenetic tree inferred from Cytb nucleotide sequences using a maximum likelihood method. The numbers indicate the bootstrap value, which validates the sister taxa and clade formation in the phylogenetic tree.
This entry is adapted from the peer-reviewed paper 10.3390/biology11020252
This entry is offline, you can click here to edit this entry!
