Your browser does not fully support modern features. Please upgrade for a smoother experience.
Please note this is an old version of this entry, which may differ significantly from the current revision.
Subjects:
Dentistry, Oral Surgery & Medicine
Periodontal disease represents a progressive destruction of tooth-supporting tissues. Recently, paraprobiotics are regarded as an adjunctive therapy to non-surgical periodontal therapy (Scaling and Root Planing, SRP). Paraprobiotics are defined as “inactivated microbial cells (non-viable) that confer a health benefit to the consumer" and their use for oral health deserves to be further tested.
- dentistry
- oral hygiene
- periodontitis
- scaling and root planing
- probiotics
- paraprobiotics
- tyndallized probiotics
1. Introduction
Periodontal disease represents an inflammation of both soft and hard tooth-supporting tissues which is regarded as one of the major causes of tooth loss worldwide [1]. It originates from an untreated gingivitis, a reversible process linked to bacterial plaque accumulation, clinically characterized by an inflammation of the marginal gum with bleeding on probing. In case this process is not reversed, it may lead to periodontitis, presenting irreversible periodontal attachment loss, pockets, recessions, and eventually tooth mobility and even loss [2].
Several factors have been related to periodontal disease, including smoke [3], leukocyte alterations [4], immunosuppression or drugs [5], diabetes [2], and specific genetic polymorphisms associated with inflammatory processes [6]. Anyway, the abovementioned ones are considered predisposing factors, whereas bacterial plaque formation and accumulation are regarded as the main aetiological factors [7].
Periodontal treatment focuses on the removal of the bacterial deposits in order to reverse the inflammatory process. Scaling and Root Planing (SRP) is the non-surgical gold standard procedure which is aimed at removing dental plaque/calculus as well as at smoothing root surfaces, respectively [8]. The most relevant flaw of SRP is the absence of a long-term effect due to an eventual bacterial recolonization after the therapy [9]. Accordingly, adjunctive treatments have been introduced in addition to SRP, e.g., the use of antibiotics, the photodynamic therapy, the administration of antioxidants, natural compounds [10], supplements (e.g., melatonin) [11], and, in recent years, probiotic therapy [12]. Particularly, this last approach is gaining attention in the scientific community because of the absence of the side effects commonly related to antibiotics intake [13]. In accordance with the Food and Agriculture Organization (FAO) and the World Health Organization (WHO), probiotics are “live microorganisms which when administered in adequate amounts confer a health benefit on the host” [14]. Different mechanisms have been proposed to explain probiotics’ actions, such as the competition with periodontopathogens, the production of antimicrobial substances, the enhancement of the mucosal barrier, and an immunomodulant effect [15].
Despite their efficacy, several concerns on the use of probiotics have been raised in recent years. In particular, the safety of live microorganisms should be taken into account, especially when they are administered to vulnerable people, such as the elderly and immunodeficient individuals [16,17]. Based upon these drawbacks, new products based on non-viable probiotics have been proposed, such as paraprobiotics (tyndallized probiotics) and postbiotics. In particular, paraprobiotics are inactivated microbial cells which thus confer a benefit to the consumer without presenting any risk health risk; they are able to regulate both the adaptive and innate immune systems, to exert an antagonistic effect against pathogens, as well as anti-inflammatory, antiproliferative, and antioxidant action [16]. Probiotics and paraprobiotics should not be confused with postbiotics which include any substance released by or produced through the metabolic activity of the microorganism without containing the viable microorganisms itself [18]. As an example, according to a recent study, a postbiotic-based gel, also containing lactoferrin and Aloe Barbadensis Leaf Juice Powder, resulted in an effective tool for the domiciliary treatment of periodontitis [19]. Moreover, immunoodulants effects of paraprobiotics have been assessed in an in vitro study evaluating cellular and inflammatory parameters [20].
The concept of “biotics” should be also discussed taking into account the more general term “metabiotics”, which is used to describe the structural components of probiotic microorganisms and/or their metabolites and/or signalling molecules with a determined chemical structure able to improve host-specific physiological functions, regulator, metabolic, and/or behaviour reactions connected with the activity of host indigenous microbiota [21,22].
2. Participant Flow and Baseline Data
A total of 40 patients responding to the inclusion criteria were asked to participate in the study. They all agreed to participate and received the allocated interventions. No patient was excluded from analysis. The flow chart of the study is shown in Figure 1. At baseline, the sample showed a mean age of 55.2 ± 13.1 years (17 females, mean age 51.6 ± 13.6; 23 males, mean age 57.8 ± 13.7).
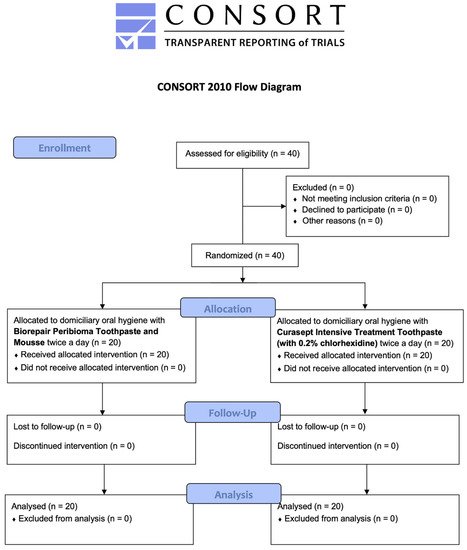
Figure 1. CONSORT flow-chart of the study.
Descriptive and inferential statistics are reported in the following sections. Inter- and intra-group comparisons are shown with letter-based comparisons [31].
3. Periodontal Parameters
The periodontal indices collected are shown in Table 3 and Figure 2.
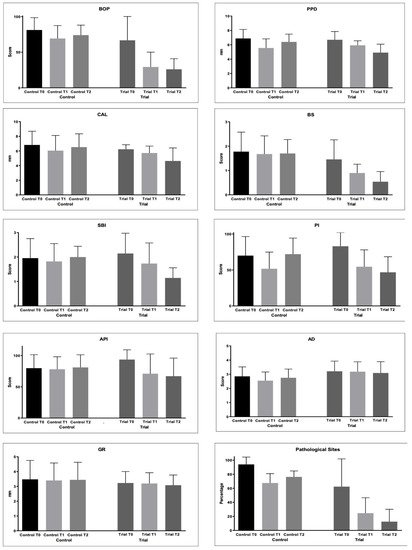
Figure 2. Periodontal parameters collected during the study: Bleeding on Probing (%); Probing Pocket Depth (mm); Clinical Attachment Loss (mm); Bleeding Score (0–4); Sulcus Bleeding Index (0–5); Plaque Index (0–4); Approximal Plaque Index (presence/absence); Adherent Gingiva (mm); Gingival Recession (GR); Pathological Sites (%).
Table 3. Descriptive statistics of periodontal clinical parameters.
| Group | Time | BOP | PPD | CAL | BS | SBI | API | PI | AG | GR | PS |
|---|---|---|---|---|---|---|---|---|---|---|---|
| Mean | Mean | Mean | Mean | Mean | Mean | Mean | Mean | Mean | Mean | ||
| (SD) | (SD) | (SD) | (SD) | (SD) | (SD) | (SD) | (SD) | (SD) | (SD) | ||
| Control | T0 | 81.25 (17.23) a | 6.88 (1.26) a,d | 6.83 (1.87) a | 1.78 (0.80) a | 1.96 (0.80) a | 79.75 (21.61) a | 70.00 (26.56) a,b,c | 2.85 (0.67) a,b | 3.48 (1.28) a | 94.00 (10.46) a |
| T1 | 69.25 (18.16) b | 5.55 (1.27) b,e | 6.05 (2.07) b,c | 1.68 (0.75) a | 1.82 (0.73) a | 78.00 (20.03) a | 51.75 (23.13) b | 2.55 (0.61) b | 3.40 (1.18) a | 67.50 (13.33) b | |
| T2 | 74.00 (14.01) b | 6.40 (1.08) c,f | 6.53 (1.82) a | 1.70 (0.57) a | 2.00 (0.44) a | 81.00 (20.17) a | 72.00 (22.33) a,c | 2.75 (0.62) a,b | 3.44 (1.19) a | 76.25 (8.41) c | |
| Trial | T0 | 66.75 (33.41) a,b | 6.69 (1.15) b,c,d | 6.23 (0.62) a,b | 1.46 (0.80) a | 2.15 (0.83) a | 93.50 (15.65) a | 83.00 (18.95) c | 3.21 (0.72) a | 3.23 (0.78) a | 62.35 (39.55) b,c |
| T1 | 29.25 (20.82) c | 5.92 (0.64) a,e,f | 5.73 (0.94) a,b | 0.90 (0.36) b | 1.74 (0.84) a,b | 71.00 (31.48) a,b | 54.50 (23.50) a,b,d | 3.18 (0.70) a | 3.20 (0.73) a | 24.55 (21.98) d | |
| T2 | 26.00 (14.85) c | 4.91 (1.18) e | 4.64 (1.78) c | 0.54 (0.42) c | 1.15 (0.41) b | 67.00 (28.95) b | 46.75 (21.66) b,d | 3.09 (0.80) a,b | 3.08 (0.69) a | 12.46 (17.62) d |
For each variable tested, groups with different letters (a, b, c, d, e and f) show significantly different means between them.
BoP decreased in both the groups from baseline to T1 and T2 (p < 0.05). However, significantly lower values were found at T1 and T2 in the Trial group with respect to the Control group (p < 0.05).
The PPD values significantly decreased in the Trial group from T0 to T1 (p < 0.05) and with no significant difference from T1 to T2 (p > 0.05). In the Control group, significantly lower values were found at T1 and T2 (p < 0.05), but an intergroup comparison at T2 shows significantly lower values in the Trial group after 6 months of treatment (p < 0.05).
As regards the CAL values, a significant decrease was found only at T1 in the Control group. In the Trial group, the values significantly decreased until T2 (p < 0.05). After 6 months of treatment, significantly lower values were found in the Trial group (p < 0.05).
The BS values did not change in the Control group (p > 0.05). In the Trial group, the values became significantly lower from T0 and T1 (p < 0.05) and from T1 and T2 (p < 0.05).
For the SBI values, statistically significantly lower values were found at T1 and T2 if compared to T0 in the Trial group (p < 0.05). The same happened for API.
PI significantly decreased at T1 in the Control group (p < 0.05), but at T2, a significant increase was observed (p < 0.05). In the Trial group, a significant decrease was found at T1 and T2 (p < 0.05), with no significant differences from T1 of the Control group (p > 0.05).
As regards AG, significantly lower values were found at T1 Control if compared to T0 and T1 of the Trial group (p < 0.05). Other comparisons were not significant (p > 0.05).
Differences in the GR values among the groups were not significant (p > 0.05).
PS significantly decreased in both the groups from T0 to T2 (p < 0.05). In the Trial group, significantly lower values were found at T1 and T2 if compared to T1 and T2 of the Control group (p < 0.05).
4. Microbiological Assessment
As regards bacterial samples, multiple comparisons were performed. The percentages of bacterial count, total and per single strain were compared. The results are shown in Figure 3 and Table 4.
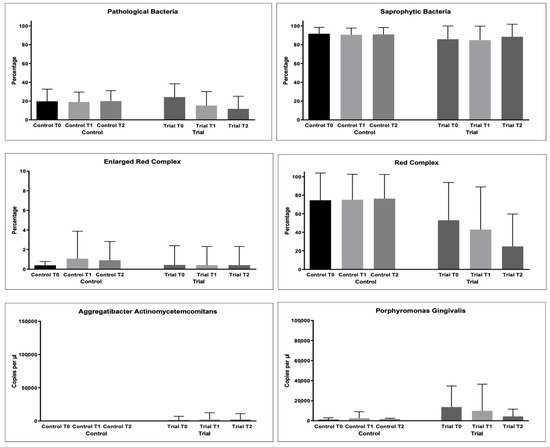
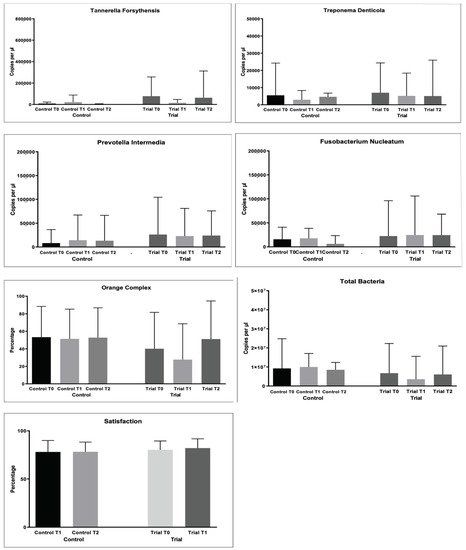
Figure 3. Microbiological variables collected during the study: Pathological Bacteria (%); Saprophytic Bacteria (%); Enlarged Red Complex (%); Red Complex (%); Orange Complex; Aggregatibacter actinomycetemcomitans (copies/microliter), Porphyromonas gingivalis (copies/microliter), Tannerella forsythensys (copies/microliter), Treponema denticola (copies/microliter), Prevotella intermedia (copies/microliter); Fusobacterium nucleatum (copies/microliter).
Table 4. Descriptive statistics of microbiological parameters (1).
| Group | Time | Total Bacteria Count | AAE | PG | TF | TD | PI | FN |
|---|---|---|---|---|---|---|---|---|
| Mean | Mean | Mean | Mean | Mean | Mean | Mean | ||
| (SD) | (SD) | (SD) | (SD) | (SD) | (SD) | (SD) | ||
| Control | T0 | 9,225,901.65 (15,558,308.5) a |
0.83 (2.20) a |
1053.05 (1842.44) a |
8416.22 (13584.71) a |
5505.00 (18730.81) a |
8295.00 (28278.05) a |
15,792.48 (25232.49) a |
| T1 | 9,986,050.23 (7,074,899.18) a |
0.64 (2.61) a |
2567.22 (6425.14) a |
21,956.85 (65,796.72) a |
2959.11 (5366.56) a |
14,227.38 (52,965.73) a |
17,811.83 (20,803.62) a |
|
| T2 | 8,502,000.00 (3,858,474.75) a |
1.05 (2.14) a |
1695.80 (794.89) a |
4099.00 (1993.82) a |
4651.00 (2158.87) a |
13,304.81 (53,130.25) a |
6275.86 (17,221.46) a |
|
| Trial | T0 | 6,732,956.50 (15,565,648.5) a |
1315.00 (5669.24) a |
13,634.51 (21,032.74) a |
77,338.46 (179,432.46) a |
7023.45 (17,331.05) a |
26,163.01 (78,205.03) a |
22,547.43 (73,550.18) a |
| T1 | 3,577,611.70 (12,004,436.6) a |
2300.00 (10,074.20) a |
9933.55 (26,547.19) a |
14,984.63 (31,781.70) a |
5189.00 (13,216.46) a |
22,916.50 (58,000.75) a |
24,758.25 (81,217.50) a |
|
| T2 | 6,038,339.10 (14,922,620.2) a |
2045.00 (8933.82) a |
4362.55 (7230.12) a |
62,514.97 (250,286.56) a |
5095.50 (20,882.84) a |
24,086.56 (51,657.98) a |
24,483.45 (43,599.34) a |
For each variable tested, groups with the same letter (a) show no significantly different means between them.
For the % of pathological bacteria counts, significantly lower values were found at T2 in the Trial group (p < 0.05), as shown in Table 5. The same was found for Red Complex bacteria counts (p < 0.05).
Table 5. Descriptive statistics of microbiological parameters (2).
| Group | Time | Pathogen Bacteria | Enlarged Red Complex | Red Complex | Orange Complex |
|---|---|---|---|---|---|
| Mean | Mean | Mean | Mean | ||
| (SD) | (SD) | (SD) | (SD) | ||
| Control | T0 | 19.71 (12.93) a |
0.4 | 74.58 | 53.27 |
| (0.39) a | (29.41) a | (35.14) a | |||
| T1 | 18.92 (10.64) a |
1.08 | 75.19 | 51.38 | |
| (2.79) a | (27.52) a | (33.83) a | |||
| T2 | 19.90 (11.20) a |
0.91 | 76.38 | 52.69 | |
| (1.91) a | (26.10) a | (34.08) a | |||
| Trial | T0 | 24.20 (14.09) a |
0.44 | 52.95 | 40.09 |
| (1.95) a | (40.85) a | (41.49) a | |||
| T1 | 15.24 (14.87) a,b |
0.42 | 42.86 | 27.66 | |
| (1.89) a | (46.10) a,b | (40.87) a | |||
| T2 | 11.70 (13.40) b |
0.42 | 24.69 | 51.09 | |
| (1.89) a | (35.02) b | (43.52) a |
For each variable tested, groups with different letters (a and b) show significantly different means between them.
For the other microbiological variables, multiple comparisons resulted as non-significant (p > 0.05).
This entry is adapted from the peer-reviewed paper 10.3390/microorganisms10020337
This entry is offline, you can click here to edit this entry!