1. Introduction
Disease diagnosis is conventionally conducted using expensive, time-consuming, invasive techniques, applied by appropriately trained health care professionals. For instance, gastroscopy, laryngoscopy, and coronary angiography are used for gastric cancer (GCa), lung cancer (LC), and myocardial infraction diagnosis, respectively [
1]. Other commonly used methods, such as computed tomography [
2] or mammography, used for breast cancer (BC) [
3], may also be harmful due to radiation exposure. As a result, patient compliance and utilization of such diagnostic methods are remarkably reduced for a significant part of the population. However, disease and especially cancer early-stage diagnosis via effective high-risk population screening, renders treatment easier [
4]. For this reason, ameliorated diagnostic methods are imperative.
Metabolomics, one of the ‘-omics’ disciplines that have progressively become a promising diagnostic tool in medical research, offer a comprehensive analysis of the metabolites contained in biological samples by the combination of analytical techniques with bioinformatics [
5]. On the other hand, the term volatolomics is referred to the chemical processes that correlate with volatile organic compounds (VOCs) emitted by body fluids [
6], such as peripheral blood, urine, and sweat as well as feces, nasal mucous, gaseous skin excretions, and exhaled breath [
6,
7,
8]. Apart from VOCs (e.g., acetone, isoprene, ethane, pentane), inorganic gases (e.g., CO
2, CO and NO) and non-volatile compounds/exhaled breath condensates (e.g., peroxynitrite, cytokines, and isoprostanes) constitute the human breath [
1,
9,
10]. Decreased sample complexity, the highly developed appropriate analytical techniques, and the ability of direct or continuous breath analysis using gas sensors render exhaled breath as an exceptional source of gas-biomarkers (VOCs predominantly but also inorganic gases) [
8,
11]. More than 2000 VOCs have been detected in the exhaled breath [
12] and appertain to hydrocarbons, alcohols, aldehydes, ketones, esters [
12,
13], ethers, carboxylic acids, heterocyclic hydrocarbons [
12], aromatic compounds, nitriles [
12,
13], sulfides, and terpenoids [
12] and may be endogenous or exogenous.
Exogenously originated VOCs are correlated with the environment and the habits of the person [
14]. VOCs related with cleaning fluids, personal care products, plastic-related VOCs [
14], blazes, or air pollution due to industrial/transport gas emissions [
12] enter human organism through extended inhalation and are excreted via exhaled breath. Smoking [
15], food habits and food supplements, drinks, or medication also consist important sources of VOCs [
14,
15]. Other important confounding factors affecting the profile of exhaled VOCs are age, gender, ethnicity, living place, and lifestyle [
15,
16]. Consequently, immediate and recent environmental exposure should be taken into consideration during breath analysis [
14].
Endogenously created VOCs comprise high vapor pressure (body and room temperature (RT)) (fragments of [
14]) byproducts of normal or pathophysiological metabolic pathways [
7,
14,
17], as well as of microbiome metabolism [
14]. They are produced either in the airway region or in other parts of human body, representing the metabolism of the whole organism. In the first case, VOCs are released in the exhaled breath in a direct way [
17]. In the second case, produced VOCs enter and circulate in the bloodstream, and, during gas exchange in the alveoli or the airways, excretion to the exhaled breath occurs [
15,
17] via the alveolar pulmonary membrane [
9,
10]. Depending on blood solubility, VOCs are exchanged in different sites of the respiratory tract. Nonpolar VOCs with poor blood solubility (blood–air partition coefficient (
λb:a) < 10) are exchanged in the alveoli, in contrast to blood soluble VOCs (
λb:a > 100) that are exchanged in lung airways. VOCs of intermediate solubility (10 <
λb:a < 100) undergo pulmonary gas exchange in both sites [
12,
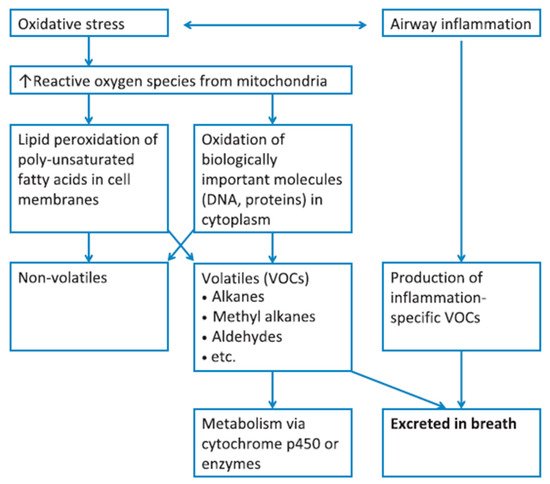
15]. Oxidative stress, lipid peroxidation, and reactions catalyzed by cytochrome p450 (CYP450), and liver enzymes are the main biochemical processes correlated with endogenous VOCs [
15,
18,
19]. The correlation of oxidative stress and airway inflammation with exhaled VOCs is summarized in
Figure 1. Different VOC classes are potentially correlated with different biochemical reactions and exogenous sources.
Figure 1. Diagram summarizing the correlation of VOCs present in the exhaled breath, with oxidative stress and inflammatory conditions; metabolic breakdown of larger molecules leads to the formation of exhaled VOCs. Reprinted with permission from ref. [
17]. Copyright © 2012 John Wiley & Sons Ltd.
VOCs of exhaled breath are regarded as normal [
12]. However, concentration differences for some exhaled VOCs could potentially be associated with an abnormal condition of the body [
12], as the metabolic processes producing the VOCs are altered in a distinctive way by different diseases [
1,
10]. Disease-related concentration alternations conventionally concern a group of VOCs rather than a single compound [
17]. Apart from this, the concentration of a single compound may vary due to more than one pathophysiological processes, thus being non-specific [
20]. Consequently, diagnosis of complex, heterogeneous diseases is scarcely achieved by the recognition of one characteristic stand-alone VOC [
7,
20]. A mixture of exhaled VOCs, called VOC pattern or ‘breathprint’, consists the signature of a specific disease, correlating with the underlying pathophysiology; this pattern should therefore be recognized so as to achieve disease diagnosis [
7,
17,
20].
Thus, the analysis of the exhaled breath holds a great promise for non-invasive early disease diagnosis [
1,
21]. Several diseases are investigated via breath analysis [
7] for potential diagnosis, the main types of which are presented on
Table 1. Specifically in the case of infections by specific species or strains of bacteria, the combination of bacteria-derived VOCs [
22] and VOCs produced by the host due to immune response to bacterial antigens as well as VOCs formed due to the host response to bacterial products/metabolites (and vice versa) is detected. Differentiation of the origin of those VOCs is not clinically important [
23]. Recently, research interest focused on the diagnosis of SARS-CoV-2 viral infection via breath analysis with remarkable results [
24,
25,
26], employing a diagnostic test, i.e., “BreFence Go COVID-19 Breath Test System” developed by Breathonix [
27] and “TracieX Breathalyser” developed by Silver Factory Technology, which have been already provisionally approved by the HSA [
28,
29]. Apart from early diagnosis, screening of high-risk populations and assessment of therapy efficiency can be permitted using breath analysis, due to being an inexpensive [
6] and rapid method, characterized by increased patient compliance [
30].
Table 1. Diseases investigated for diagnosis using breath analysis.
| Disease Type |
Diseases |
Ref. |
| Respiratory |
Asthma, COPD, obstructive sleep apnea syndrome, pulmonary arterial hypertension, cystic fibrosis |
[19] |
| Malignant |
Lung, gastric, head and neck, breast, colon, prostate cancer |
[15] |
| Neurodegenerative |
Alzheimer’s disease, Parkinson’s diseases, multiple sclerosis |
[15] |
| Metabolic |
Diabetes, hyperglycemia |
[12,31] |
| Bacterial infections |
Upper respiratory tract infection, Mycobacterium tuberculosis, Pseudomonas, Helicobacter pylori infection |
[32,22] |
| Viral infections |
SARS-CoV-2 |
[24,25,26] |
For the analysis of exhaled VOCs and disease diagnosis, two different methods can be used; analytical techniques and sensors. Gas chromatography combined with mass spectrometry (GC-MS) comprises the gold-standard method for the analysis of VOCs patterns in exhaled breath [
1,
17,
33]. Both quantitative analysis (characterized by high sensitivity in the ppb to ppt range [
1]) and qualitative analysis (providing information concerning the potential metabolic disease pathways [
33]) can be achieved [
4,
17]. For the detection of very low concentrations of VOCs, the pre-concentration of the breath sample is imperative. Pre-concentration techniques commonly combined with GC-MS include thermal desorption [
31,
33] (using sampling bags/sorbent tubes [
33], mainly Tenax tubes [
31]), headspace solid-phase microextraction (HS-SPME) [
10,
31] (using silica fibers, coated with polymeric nanofilm, mainly Carboxen (CAR)/Polydimethylsiloxane (PDMS) [
31]) and the needle trap device [
31,
34] (sorbent polymer—CAR, PDMS, and/or divinylbenzene (DVB)—packed in a needle [
31]). Apart from GC-MS, selected ion flow tube-mass spectrometry (SIFT-MS), ion mobility spectrometry (IMS), proton transfer reaction-mass spectrometry (PTR-MS) [
17,
35], proton reaction transfer time-of-flight mass spectrometry (PRT-TOF-MS) [
1], GC coupled with ion mobility spectrometry (GC-IMS), and flame ionization detector (GC-FID) [
31] are also common techniques for breath analysis. However, spectrometry and spectroscopic methods exhibit important limitations [
15], such as the use of bulky and expensive equipment by appropriately trained personnel, while the analysis is also time-consuming [
15,
36], providing no real-time results [
33]. In addition, pre-concentration methods, required before the analysis, could potentially lead to sample loss/contamination [
34,
36]. Thus, despite the advantages of those analytical techniques, their use in clinical practice for point-of-care [
37] or screening [
33] is limited.
During recent years, however, sensors and e-Noses, have exhibited the prospect of becoming strong diagnostic tools via breath analysis and are rising up to the existing clinical challenges [
34,
35,
37]. Gas sensors comprise inexpensive and simple [
12,
34,
37] easy-to-use devices that are small in size and thus portable [
12,
34]. In addition, short response time and direct acquisition of results, as well as short sensor recovery time [
12], render gas sensors attractive for point-of-care and personalized screening, diagnosis, and disease follow-up [
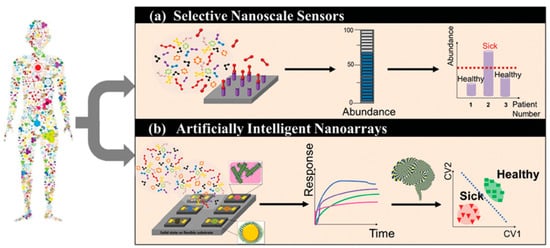
34]. Exhaled gas-target analysis using sensors can be achieved by two different approaches (
Figure 2). In the first case, a targeted approach is applied, using a selective mechanism [
7,
14]. The target is recognized by a selective chemical sensor, designed to measure this single compound in a complex mixture, based on lock-key mechanism [
7]. Such selective sensors have been developed for NO, NH
3, acetone, H
2O
2 [
6,
15], H
2S, and CH
3SH [
15]. On the other hand, the detection of a unique gas-target pattern, rather than a single exhaled compound, is also possible. Semi-selective/ cross-reactive sensors are artificially intelligent nano-arrays [
15] mimicking natural sensing systems [
38,
39] and are also called “electronic noses” (e-Noses), “artificial olfactory systems” (gas analytes), or “electronic tongues” (liquid analytes). The array consists of distinctive sensors that respond to all/large part of the components of a complex mixture [
38], at the same time, in a complementary way [
39]. Due to their diversity each individual sensor of the array responds differently (yet not chemically selectively) to a given mixture. Statistical pattern-recognition algorithms and classification techniques are used for the establishment of analyte-specific response patterns, combining the responses of the sensor array elements [
38]. It is worth noting that even analytical techniques, e.g., GC-MS, are progressively used for the analysis of total patterns of VOCs, instead of targeting a stand-alone biomarker [
17].
Figure 2. Schematic representation of the working principle of selective sensors and artificially intelligent cross-reactive sensor arrays. Selective sensors contain highly selective elements in order to detect a specific gas-analyte in the presence of a composite gas-mixture. Cross-reactive arrays feature sensors that are sensitive to the majority of the gases present in the gas-mixture. In any case, detecting analyte concentration above a critical value leads to the differentiation between sick and healthy subjects. The response of gas-sensing arrays can be then processed by employing artificial intelligence, machine-learning, and pattern recognition techniques. Reprinted with permission from Ref. [
6] Copyright © 2015 Wiley-VCH Verlag GmbH & Co. KGaA, Weinheim.
Multivariate data analysis, a fundamental tool in breath analysis, improves the human perception of experimental data [
16]. Response data obtained after sensor array exposure to a complex chemical mixture are processed by multivariate data analysis [
40] in order to assess the discriminating ability of the sensor array [
16,
41], as well as for the elimination of potential confounding variables (i.e., environmental temperature and humidity) [
40]. Multivariate data analysis is also useful for breath analysis using analytical techniques, permitting the identification of the most discriminant VOCs between the different groups studied [
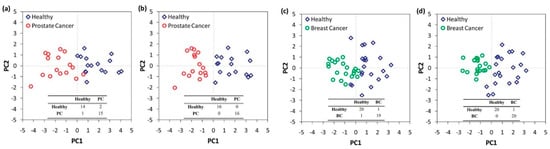
32]. Numerous multivariate analysis methods are used in e-Nose systems, including canonical discriminate analysis (CDA), partial least squares regression (PLS regression), discriminant function analysis (DFA), and principal component analysis (PCA) (
Figure 3) [
40]. PCA comprises the most commonly used method in e-Nose systems [
40], while DFA is also frequently used.
Figure 3. Statistical analysis of the response of a nanomaterial-based, cross-reactive chemiresistor for real-world samples of sick and healthy subjects. The use of PCA permits the differentiation of the groups. Notably, relative humidity compensation reduces the dispersion of different clusters thereby improving the discrimination between healthy and sick subjects. Representative 2D breath-analysis PCA plots for prostate cancer diagnosis: (
a) without relative humidity compensation; (
b) with relative humidity compensation. PCA plots for breast cancer diagnosis: (
c) without relative humidity compensation; (
d) with relative humidity compensation. Adapted with permission from Ref. [
42] Copyright © 2012, American Chemical Society.
PCA is an unsupervised learning technique in which the multidimensional data space is reduced to its main components [
16]. Linear combinations of original data (i.e., sensor values) capturing the maximum variance between all data points are acquired [
16,
42], leading to a reduced set of variables [
41], called principal components (PCs). The differentiation of the PCs maintaining most of the original data information from the PCs with the minimum effects, which are excluded, is achieved by employing an appropriate algorithm [
41]. PCs define new orthogonal axes for the representation of multidimensional data only in two or three dimensions [
16,
42]. Thus, a visualized statistical analysis is obtained, permitting discrimination of otherwise entangled data [
41]. PC1 is characterized by the greatest response variance, while the magnitudes of variance are diminished from PC2 to PC3 and so on [
16,
42]. DFA is a linear supervised pattern recognition method, also used for multidimensional experimental data reduction [
43]. DFA aims to separate known data groups to the best possible extent [
44]. The determination of the discrimination classes is conducted prior to the analysis [
43]. Input variables are linearly combined to achieve the maximum variance between classes and the minimum variance for each class [
43,
44]. DFA output is a set of canonical variables (CVs) that fulfill the above two requirements. The first CV is the most powerful discriminating dimension [
43].
In order to evaluate sensor array suitability for disease diagnosis and to assess the ability to correlate VOCs with the appropriate disease, machine learning techniques [
43] such as support vector machines (SVM), k-nearest neighbor (k-NN), and artificial neural networks (ANN) [
40] are also needed. Machine learning techniques and artificial intelligence in general aim at enabling machines to mimic a specific behavior by designing and developing algorithms based on empirical data that are representative of the relation between the observed attributes [
45]. The automated “learning” of complex patterns and intelligent decision-making based on current data comprise one of the principal research fields in machine learning [
45] and are especially useful in the development of e-Noses for disease diagnosis. ANN is a commonly used machine learning technique, inspired by the human nervous system. The most discriminant sensing features are firstly determined and comprise the input data of the ANN. The input data are connected with the output (i.e., the classification of samples to specific disease) by the ANN, using a set of appropriate functions. The classification from the available inputs is improved by optimizing specific parameters, such as the number of neurons (calculation centers) that are responsible for the system calculations [
43].
A number of requirements have to be fulfilled for the use of a sensor in breath analysis and therefore disease diagnosis. Reproducibility [
6], high sensitivity, and good resolution [
15], are three fundamental parameters. Low limit of detection (LOD) [
13,
15] (ppb [
38]), wide range of response [
38], and increased selectivity are also of great importance, in order to detect the exhaled VOCs in the presence of water vapor found in the humidified clinical samples [
15]. The stable baseline in the absence of gas-target biomarkers [
6], short response, and recovery times are imperative [
13,
15], while full recovery of the sensor after analyte removal is also essential. Alternatively, disposable sensors that are simple, cost-effective, and therefore suitable for mass-production can be used [
15]. Last but not least, operation at RT is important [
38].
In the context of this fast-growing field, novel nanomaterials and sensing devices are constantly being developed. The first part of this review aims to provide an up to date overview of the main classes of sensors investigated for the analysis of exhaled gas-analytes (i.e., VOCs, inorganic gases) for disease diagnosis. After highlighting the importance of nanomaterials, examples of applications of either selective or cross-reactive self-developed and commercial sensing devices are discussed. The second and final part of the paper discusses and highlights the capacity of breath analysis towards differential diagnosis, disease staging and phenotyping.
2. Differential Diagnosis and Disease Phenotyping and Staging in Breath Analysis
As can be observed on
Table 2, exhaled VOCs have been used not only for disease diagnosis in comparison to healthy subjects, but also for the discrimination between different diseases (e.g., GCa, LC, and asthma/COPD [
43]) or even for the discrimination between the different stages of a particular disease (e.g., CKD stages [
113]). One of the main prerequisites for the development of clinically applicable diagnostic tests is the effective discrimination between different diseases with similar symptoms and biochemical pathways [
200]. The uncertainty in the differentiation of patients with distinct diseases comprises one of the main drawbacks for studies distinguishing a specific disease from HC [
201]. Thus, the use of breath analysis for differential diagnosis as well as disease staging or phenotyping, using either analytical techniques or sensing devices (
Table 4), attracted significant research interest over the last years. As expected, the contribution of nanomaterials is of great importance with many recent publications of nanomaterial-based sensors focusing on disease differentiation, staging or phenotyping, rather than the simple discrimination between patients and HC (
Table 4).
2.1. The Case for Lung Diseases
Chronic and acute lung diseases such as asthma, COPD, idiopathic pulmonary fibrosis (IPF), LC, mesothelioma, and sarcoidosis have been connected with similar metabolic alternations [
202]. Especially asthma and COPD are also characterized by similar symptoms [
37] with COPD being commonly underdiagnosed or diagnosed at late stages [
203]. Concerning LC, no symptoms are expressed in early stages [
204] while disease manifestation is limited to non-specific symptoms [
204] including cough, short breath, chest pain, and weight loss [
37]. Disease phenotyping, on the other hand, is mandatory in some cases. Asthma subtypes such as eosinophilic, neutrophilic, mixed granulocytic, and paucigranulocytic asthma [
205] are characterized by similar symptoms while different treatment is required [
206]. Similarly, immunosuppressive, antifibrotic, or a combination of medications may be needed for fibrotic interstitial lung diseases (ILDs), depending on the respective phenotype (inflammatory, more fibrotic, or combination) [
207]. Thus, reliable phenotyping is needed for appropriate medication to be administered [
33,
206,
207]. LC is subdivided into different categories with different clinical characteristics as well. Small cell LC (SCLC), with 20–25% percentage of occurrence [
208], is characterized by increased metabolic and proliferation rates compared to other cancer cells [
209], while non-small cell LC (NSCLC) accounts for 70–75% of LC cases and is subdivided into the smoking-related [
37,
210] squamous cell carcinoma (SCC) [
208] and the non-squamous cell carcinomas [
37] including adenocarcinomas (ADC) (minor smoking correlation) and large-cell carcinoma (LCC) [
208]. Consequently, the accurate discrimination of different lung diseases and subtypes of a lung disease, especially using breath analysis of exhaled VOCs, is of particular importance.
The use of GC-MS has rendered lung disease differentiation, phenotyping and staging feasible in many cases. To be more specific, LC discrimination from patients with other lung diseases has been investigated in several studies. In an attempt to discriminate between NSCLC, COPD, and HC patients, by taking smoking habits into account, 4 VOCs were identified (in varying concentrations) for NSCLC and COPD [
211]. In another study, Wang et al. attempted to discriminate LC from COPD, asthma, pneumonia, pulmonary embolism and benign lung tumor patients; however, the selected 10 VOCs could not discriminate accurately between the two groups, implying their potential confounding role during LC-biomarkers determination [
18]. Koureas et al. have also attempted to discriminate LC from other respiratory diseases, using 19 distinctive VOCs, based on the underlying disease mechanisms (targeted method); only the discrimination of LC patients from HC, using ethylbenzene, toluene, styrene, 2- and 1-propanol was achieved [
200]. However, in a more recent study of the same group, the discrimination of LC patients from patients suffering from sarcoidosis, hypersensitivity pneumonitis, interstitial lung diseases or pulmonary infections was achieved with an increased accuracy of 75.3%; the 29 VOCs were selected following a hypothesis-generating non-targeted strategy [
212]. In a different study, LC was accurately distinguished from pulmonary non-malignant diseases (PNMD; COPD, pulmonary tuberculosis, asthma) using 10 VOCs while 5 were selected as characteristic of LC in contrast to both PNMD and HC [
213].
The differentiation of LC patients from patients with benign pulmonary nodules (BPN) has also been extensively reported. Apart from a study by Wang et al. [
18] which included patients with benign lung tumors, Fu et al. have investigated the respective discriminant ability of carbonyl VOCs [
214,
215,
216]. Four carbonyl VOCs, captured by a silicon micro-reactor, were found to present increased concentration in LC patients when compared to BPN patients and HC [
214]. In a subsequent study, the same group achieved the differentiation of both early and III, IV stage LC patients from BPN patients, with high sensitivity (83%) and particularly increased specificity (74%) in comparison to positron emission tomography (90% and 39%, respectively) [
215], while 6 carbonyl VOCs have permitted a classification accuracy of 89% of LC vs. BPN patients [
216]. More recently, Chen et al. identified 19 VOCs able to distinguish not only LC and BPN patients (this with an accuracy of 80.9%) but also early-stage LC patients from BPN (with an accuracy of 75.6%), being remarkably promising for early LC diagnosis [
204].
LC histology and staging characterization using analytical methods is another important target of this research field. It was reported that 1-butanol, 3-hydroxy-2-butanone [
9], as well as 4-hydroxyhexenal [
214], can differentiate SCC from ADC patients with the former being decreased for SCC in contrast to the other 2 VOCs. Similarly, SCLC and NSCLC can be potentially distinguished from 4-hydroxynonenal and C
5H
10O [
214]. Hexanal has also been found in higher concentrations for SCLC patients compared to NSCLC, potentially due to increased metabolic rates [
209]; Chen et al. have achieved NSCLC and SCLC differentiation, with an accuracy of 93.9%, using a pattern of 20 VOCs [
204]. Concerning LC staging (I, II, III, or IV), a pattern of 19 VOCs was used to distinguish between early (I, II) and advanced LC stages (III, IV) with 82.7% accuracy [
204] while Fu et al. demonstrated that exhaled 2-butanone concentration is significantly different between stages I and II–IV [
214].
Apart from LC, other lung diseases are also studied for accurate diagnosis. A series of studies have focused on asthma phenotyping using GC-MS. Brinkman et al. identified 3 VOCs significantly correlated with sputum eosinophils [
90], while Ibrahim et al. identified VOC-patterns differentiating eosinophilic from non-eosinophilic (6 VOCs) and neutrophilic from non-neutrophilic (7 VOCs) [
217]. Recently, Schleich et al. identified 4 VOCs discriminating eosinophilic from neutrophilic, eosinophilic from paucigranulocytic and neutrophilic from paucigranulocytic asthma, with accuracy similar to blood eosinophils and FeNO tests [
205]. In a more recent study, the same group used two-dimensional GC-high resolution-time-of-flight-MS, selected ion flow tube mass spectrometry (SIFT-MS), 10 VOCs, and 9 ion channels so as to achieve asthma phenotyping with an accuracy of 75% [
206]. COPD phenotyping and staging has also been attempted using analytical techniques. Fens et al. identified 8 eosinophils- and 17 neutrophils-related VOCs, with only one VOC overlapping between the two subgroups. More VOCs were related with cell counts for Global Initiative for Obstructive Lung Disease (GOLD) stage II, in comparison to GOLD stage I [
120]. In another study, 11 COPD patients with >1% and 6 with >2% eosinophil count were discriminated from non-eosinophilics (<1% and <2% eosinophil count, respectively) with accuracies of 79% and 92% [
218]. Exacerbation prediction of both asthmatic children [
219,
220,
221] and adults [
90,
217] as well as COPD patients [
222] also comprises a subject of study.
Following the promising applications of analytical methods that highlight the potential capabilities of breath analysis in phenotyping, staging and differential diagnosis of lung diseases, sensing devices have also been used in respective applications with remarkable results. Research interest has focused on LC discrimination from other lung diseases such as COPD and asthma. Cyranose 320 has achieved separation of NSCLC from COPD (GOLD stage I–III) with an accuracy of 85%, in an article by Dragonieri et al. [
223]. Tirzīte et al. have used this e-Nose to effectively discriminate, not only LC patients from COPD, asthma, pneumonia, pulmonary embolism, benign lung tumor patients, and HC, with 87.3% accuracy, but also between LC patients, COPD patients, LC patients suffering also from COPD and HC with 77.4% accuracy, and totally correct classification of the 79 LC/COPD patients [
224]. In a more recent study, the same group discriminated LC from patients with non-malignant lung diseases as well as bronchiectasis, tuberculosis, and HC by taking into account smoking habits. An overall sensitivity and specificity of 95.8% and 92.3% for smokers and 96.2% and 90.6% for non-smokers, respectively, was observed using Cyranose 320 [
225]. More recently, the same e-Nose was used by Rodriguez et al. for the discrimination of COPD from LC and BC, achieving an overall correct classification of 91.35% while LC correct classification in relation to COPD was equal to 96.47% [
201]. Interestingly, the contribution of the 32 sensors in the discrimination was also assessed [
201]. Tor Vergata e-Nose has been used effectively for discriminating LC patients from COPD, Interstitial lung disease, Pleurisy and Bronchitis patients, with a sensitivity of 89.3% for LC patients [
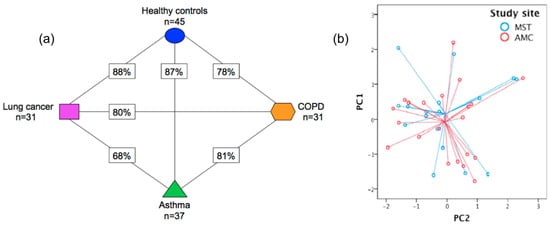
175]. In a particularly promising study, SpiroNose discriminated LC, asthma, COPD, and HC, with the respective accuracy values presented in
Figure 14a (68–88%) [
91]. The applicability of breath sampling and analysis was tested as the collection of asthma breath samples at two different sites led to similar results (
Figure 14b) [
91]. In the field of non-commercial and self-developed sensors, Tan et al. have attempted to develop a cross-reactive alkane-based chemiresistor combining carbon powder and tetracosane, achieving not only high affinity for alkanes and low sensitivity for polar VOCs (water, ethanol, ethanal) but also effective differentiation of 12 LC patient from 13 HC and 12 COPD patients [
108]. In a more recent study, researchers attempted to differentiate LC, COPD, and asthma patients from HC, using an array of 8 sensors of 4 different types (MOS, electrochemical, hot wire, and catalytic type). The array achieved accuracy between 76.9–84.75%, using different machine learning methods [
226]. Accuracy values were greater for LC and COPD prediction; however, the maximum accuracy value of 84.75% was attained using kernel principal component analysis—extreme gradient boosting (KPCA-XGBoost), which indicates excellent discriminatory capability for LC and COPD patients [
226]. Similarly, using an array of 11 sensors of 4 different types (namely MOS, electrochemical, hot wire, and catalytic type), Liu et al. differentiated non-smoking LC and COPD patients, with the best discriminatory accuracy (96%) being achieved using the same machine learning technique [
227]. The discrimination of LC from asthma and COPD patients was also achieved by Haick’s group with particularly high classification accuracies [
43]. Early-stage LC discrimination from BPN has been reported by Haick et al. using an array of 40 chemiresistors based on MCNPs (Au NPs) and molecularly-coated SWCNTs, achieving an accuracy of 87%. Considering that the required treatment may change in the occurrence of genetic alternations, the differentiation of patients with and without epidermal growth factor receptor (
EGFR) mutation was also attempted with an accuracy of 83% [
228].
Table 4. Sensing devices used for differential diagnosis, staging, and phenotyping of different categories of diseases.
Figure 14. (
a) Presentation of the cross-validation percentages of the differentiation of asthma, COPD, LC patients, and HC, using SpiroNose; (
b) PCA plot of breathprints collected from asthmatic patients at the Academic Medical Center (AMC), Amsterdam and Medical Spectrum Twente (MST), Enschede, for which no significant differentiation is observed (
p = 0.892). Adapted with permission from Ref. [
91]. Copyright © 2015 IOP Publishing Ltd.
Concerning LC histology and staging with sensing devices, promising studies have been reported in the literature. The discrimination of NSCLC subtypes ADC and SCC has been permitted using Tor Vergata e-Nose with an accuracy of 75%, by applying endoscopic breath sampling [
132] as well as by using a colorimetric sensor-array of 24 elements developed by Mazzone et al. ultimately achieving an accuracy of 86.4% [
127]. SCLC and NSCLC differentiation and LC staging (I/II vs. III/IV) were also examined by Mazzone et al. though with moderate accuracies [
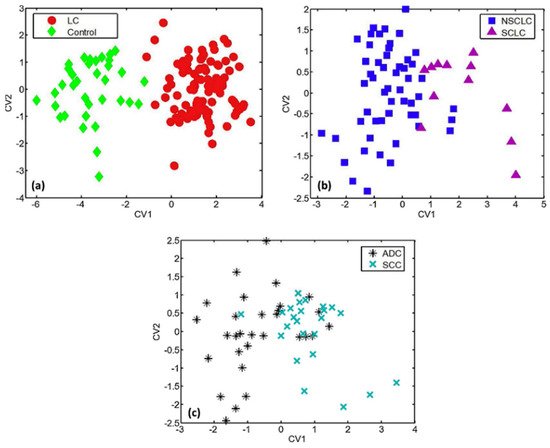
127]. A 6-sensor-array based on UV-irradiated (394 nm) pristine or metal-doped WO
3NWs (
Table 4) differentiated effectively not only ADC from SCC, but also between SCLC and NSCLC with 77.5% and 84.5% accuracy values, respectively (
Figure 15) [
246]. In another study aiming at the discrimination of LC patients from HC while taking into account the existence of metabolic comorbidities, Tor Vergata e-Nose exhibited far higher sensitivity for stage I LC in comparison to the rest of stages, either in the presence or absence of metabolic diseases (
Table 4) [
133]. LC staging was recently attempted by Liu et al. along with COPD discrimination as mentioned above, with stage III LC being effectively discriminated from stage IV with an accuracy higher than 80%, using KPCA-XGBoost [
227]. Haick’s team has achieved LC staging with an accuracy of 81% and with low sensitivity, using a molecularly modified Si NW FET (
Table 4) [
43].
Figure 15. DFA plots representing the discrimination of (
a) LC patients from HC; (
b) SCLC from NSCLC patients; and (
c) SCC from ADC patients, using a 6-sensor array of UV-irradiated (394 nm) pristine or metal-doped WO
3NWs. The arrays achieved the detection of lung cancer but also the prediction of LC histological subtypes. Reprinted with permission from Ref. [
246]. Copyright © 2020 Published by Elsevier B.V.
As in the case of breath analysis with analytical methods, precise diagnosis of lung diseases other than LC via sensing devices is an extensive field of research. The effective discrimination of COPD and asthma has been reported in the literature by Fens at al. using Cyranose 320 and taking into consideration smoking habits, leading to high cross-validated accuracy values (
Table 4) [
229,
230]. More recently, asthma and CF discrimination was also reported for pediatric population using AeoNose and with high accuracy values, excluding the confounding factors of diet, exercise, comorbidities and inhaled drugs [
235]. Concerning ILDs, Krauss et al. used the AeoNose in an attempt to differentiate between ILDs subgroups (
Table 4), with moderate accuracy, as well as between ILDs cryptogenic organizing pneumonia and connective-tissue diseases-associated ILD from COPD patients with good sensitivity and specificity [
234]. COPD and IPF differentiation has been recently investigated by Dragonieri et al., with a high accuracy of 80%, verified by external validation using Cyranose 320 [
231]. In contrast to Krauss et al., Moor’s group achieved to reliably discriminate patients suffering from different ILDs by using SpiroNose as well as greater cohorts of ILD-patients (
Table 4) [
207]; the group demonstrated the applicability of e-Noses in ILDs differential diagnosis and specifically in IPF discrimination from non-IPF patients with high accuracies (91%) [
207].
Disease phenotyping using sensing devices seems to be also feasible. Plaza et al. achieved differentiation between the three inflammatory phenotypes of asthma with high accuracy values (
Table 4), with the participants’ phenotypes being characterized by differential leukocyte counts in induced sputum [
247] while asthma-control assessment has been also reported. Brinkman et al. used 4 different e-Noses in order to discriminate between stable and unstable periods, comparing baseline (control) vs. loss of control and loss of control vs. recovery breath samples, with the Owlstone Lonestar being the most prominent concerning the discrimination of unstable periods (
Table 4) [
90]. More recently, Moreira et al. demonstrated the ability of Cyranose 320 to discriminate the uncontrolled asthma-like symptoms, using 3 different groups of asthmatic or suspicious of asthma participants divided by unsupervised hierarchical clustering [
248]. The division of participants was based on asthma, lung function, symptoms of the last month, age, and food/drink intake 2 h before breath sampling [
248]. In another recent study, the same e-Nose was used for the effective discrimination of HC and asymptomatic-controlled asthmatic children from the symptomatic partly-controlled and uncontrolled asthmatic children, after assessing the discriminatory ability of subsets of the 32 sensors of Cyranose 320 for the six different possible combinations of the 4 studied groups; increased feasibility and modest to good diagnostic accuracy values were obtained [
119]. Cyranose 320 has been also used for COPD phenotyping permitting (especially in the case of GOLD stage I) the detection of activation of inflammatory cells, indicating increased inflammatory activity in mild rather than severe COPD [
120].
2.2. Cancers
Discrimination between different cancer types and cancer stages/histologies as well as between malignant and benign tumors (additionally to LC which has been mentioned earlier) using breath analysis of VOCs is also a hot research topic. Analytical techniques have been used for such applications. Phillips at al., for example, detected 5 VOCs and were able to differentiate BC patients from patients with abnormal mammograms and negative biopsies, with 93.8% sensitivity and 84.6% specificity [
249]. Haick’s group identified 21 exhaled VOCs that were significantly different between HC and patients suffering from breast benign tumors (BBT), ductal carcinoma in situ (DCIS, early-stage BC) and BC; a potentially cancer-related set of 14 VOCs that were significantly different between malignant and non-malignant patients was also identified in this study thus permitting group differentiation with 78% sensitivity and 72% accuracy [
238]. In another study by the same group, the detection of GCa and the presence/absence and risk level of precancerous lesions was attempted using GC-MS so as to identify 8 VOCs statistically different between GCa and operative link on gastric intestinal metaplasia (OLGIM) groups (e.g., GCa vs. OLGIM 0-IV, GCa vs. OLGIM 0-II, GCa vs. OLGIM 0), as well as between GCa and peptic ulcer disease (PUD) and OLGIM 0-IV and PUD (
p-values < 0.017) [
239]. Those 8 VOCs, in different combinations, are considered to correspond to the breathprints of OLGIM groups [
239].
Remarkably, respective applications of sensing devices have been extensively investigated for various cancer types. Haick’s group has used NA-NOSE in order to discriminate between subjects with BC, benign breast conditions or normal mammographs, achieving increased sensitivity and specificity values for the BBT patients in comparison to the other 2 groups [
116]. In another study by the same group a chemiresistor based on organically-coated Au NPs and SWCNTs was successfully used for the differentiation of BC from BBT and HC, BBT only or DCIS only, as well as for the differentiation of different molecular BC sub-groups as presented on
Table 4. Larger studies are necessary, though for significant statistical results and more information to be obtained [
238]. Very recently, differentiation between BC and LC has been achieved as well by Rodriguez et al. with a correct classification of 93.05% [
201]. Concerning GCa, the differentiation of GCa and OLGIM groups as well as between different OLGIM stages (e.g., OLGIM 0 vs. I–II, 0 vs. I–IV, I–II vs. III–IV) has been attempted by Haick’s group using the same type of chemiresistor-array and leading to high validated accuracy values in some cases (
Table 4) [
239]. In another promising study, Haick et al. used a nanomaterial-based chemiresistor (
Table 4) that permitted the successful discrimination of Gca from benign conditions along with Gca staging (early vs. late stages) [
240]. Gca differentiation from gastric ulcer patients has been achieved by Daniel et al. with a great classification ability, using an array of commercial MOS gas sensors and various ANN types [
241]. Remarkably, a molecularly modified Si NW FET, developed by Haick’s group, has permitted Gca staging with an accuracy of 87% as well as Gca differentiation from LC with an accuracy of 92% [
43]. More recently, discrimination of ovarian cancer (OC) from women with benign tumors and HC was achieved by Raspagliesi et al. with great classification performance, both in the case of strict and most probable prediction, using again MOS sensors [
242]. Notably in class prediction application, 4/23 early-stage OC patients were misclassified as benign/HC along with 2/14 OC patients with tumor size < 3 cm in cross validation phase, while in prediction phase only 1/9 early-stage patients were misdiagnosed [
242]. Another common cancer type, i.e., head and neck cancer (HNC), has been studied for differential diagnosis with sensing devices. As an example, Hooren et al. attempted to discriminate HNC from LC with a high accuracy of 93% analyzing patients’ exhaled breath with AeoNose, excluding cutaneous tumors and salivary glands malignancies [
236]. HNC differentiation from colon and bladder cancer with AeoNose was also reported, by the same group along with the discrimination between bladder and colon cancer, demonstrating the discriminant ability of the e-Nose for those cancer types after double cross-validation [
237]. More recently, Cyranose 320 was used for the differentiation of advanced bronchial (LC) and laryngeal (HNC) SCC, as well as for the discrimination of advanced and in situ stages of bronchial and laryngeal SCC, leading to successful classification of the groups (
Table 4) [
232].
2.3. Liver, Renal, and Intestinal Diseases
Liver cirrhosis, chronic hepatitis [
244], CKD [
113], and inflammatory bowel diseases (IBD) comprise common liver, kidney, and intestinal diseases, respectively. As far as CKD is concerned, it is characterized by gradual loss of kidney function within months or years, while different treatment is demanded depending on disease stage (stages I–V) [
113]. Similarly, in the case of chronic liver disease (CLD), disease staging is of great importance; following CLD diagnosis, using invasive biopsy, liver function assessment is conducted biochemically [
244]. On the other hand, early stage and precise IBD and IBS diagnosis, as well as the invasive diagnostic methods followed for IBD, comprise challenging issues [
111]. Consequently, precise diagnosis and staging of liver, kidney and intestinal diseases are particularly important and have been attempted using breath analysis with sensing devices. Pennazza et al. for instance used BIONOTE e-nose to successfully differentiate not only liver cirrhosis and CLD from non-cirrhotic CLD (chronic hepatitis) but also liver cirrhosis stages by taking into account smoking habits and potential comorbidities (e.g., diabetes, lung, and heart diseases) [
244]. Concerning renal diseases, Haick’s group achieved CKD staging using organically functionalized Au NPs-based chemiresistors and SVM [
113]. The classification of CKD stage IV in relation to stage V was permitted by 2 or 3 sensors with an accuracy of 85%, a sensitivity of 75% and specificity of 92% while only one sensor allowed for the discrimination of early and advanced stages with 76% accuracy, 75% sensitivity, and 77% specificity [
113]. The discrimination of CKD from other diseases has been also attempted. Specifically, discrimination of CKD, diabetes, and HC with high or low creatinine has been attempted with success using an array of commercial (MQ) sensors along with different classification methods, with SVM and PCA leading to good group classification [
245]. Remarkably, pre-concentration or dehumidification were not needed for clear classification to be accomplished [
245]. The effective discrimination between the intestinal diseases IBD and IBS has been also reported along with further differentiation of the IBD into ulcerative colitis (UC) and Crohn’s disease (CD), using not only artificial but also real-breath samples and a MCNPs-based chemiresistor (
Table 4) [
111]. The higher accuracy values observed when using artificial samples is expected and attributed to the standard concentration of VOCs, contrary to the variable concentration of VOCs in breath [
111].
2.4. Neurodegenerative Diseases
Neurodegenerative diseases are characterized by gradually augmented occurrence, as a direct consequence of the increased lifespan of human population [
250], with Alzheimer (AD) and Parkinson (PD) being the most frequent [
114]. Concerning AD, early disease detection is of great importance for preventing, decelerating and terminating the disease [
250] while diagnosis for both diseases is based on the assessment of clinical symptoms [
114]. Remarkably, the analysis of exhaled VOCs has been investigated for precise AD diagnosis as well as for differential diagnosis between AD and PD [
114,
250]. Recently, Tiele et al. attempted to discriminate mild cognitive impairment due to AD (MCI) from AD, using GC-MS, achieving 60% sensitivity and 84% specificity along with the detection of 6 potential discriminant VOCs [
250]. Haick’s group, on the other hand, achieved the discrimination of AD and PD as well as an overall discrimination of AD, PD, and HC, using an array of 20 nanomaterial-based chemiresistors and GC-MS (
Table 4) [
114]. In a similar study, the ability of IMS and Cyranose 320 to differentiate AD, PD, and HC was demonstrated, achieving a high overall discriminant capability (
Table 4) [
233]. IMS analysis revealed five VOCs significantly different between the groups [
233]. The discrimination of the same groups of subjects has been also attempted using different arrays of MOS sensors (TGS, MICS) with one of the combinations (8 MOS sensors) demonstrating the best discriminant ability [
243].
3. Conclusions
Exhaled breath analysis, especially using selective or cross-reactive sensors, comprises a non-invasive method that holds a great promise for application in early-stage and differential diagnosis of not only respiratory but also systemic diseases. The aim of this review was to present the main categories of nanomaterials and sensors that have been used up to now in exhaled breath analysis for disease diagnosis as well as to demonstrate the applicability of breath analysis in differential diagnosis, phenotyping, and staging of several types of diseases, especially via the use of cross-reactive sensing devices.
The progressive development of novel nanomaterials offers a great opportunity to develop more effective sensing elements, both for selective and cross-reactive sensors and especially for point-of-care diagnosis, treatment monitoring and population screening. However, fundamental challenges in this novel research field inhibit the application of breath analysis in clinical practice and should therefore be addressed. Concerning analytical techniques used for exhaled VOCs identification, the use of bulky, expensive, and complex analytical devices is limited in hospitals while their incorporation in portable point-of-care systems is still unattainable [
251]. In addition, the validity of breath analysis results is of major concern since the trace levels of exhaled VOCs affect the analysis accuracy [
252]. At the same time the lack of clear breath sampling protocols [
252], e.g., breath collection [
251] and breath storage, could potentially change sample composition [
251] and therefore emerge as important challenges. Sample composition can be also affected by confounding factors, i.e., age, gender, place of living, habits, and nutrition. In the case of sensors exhalation rate, a hardly controlled parameter, may also play a confusing role hence complicating the procedure [
251].
This entry is adapted from the peer-reviewed paper 10.3390/s22031238