Your browser does not fully support modern features. Please upgrade for a smoother experience.
Please note this is an old version of this entry, which may differ significantly from the current revision.
Subjects:
Neurosciences
Anti-neuroinflammatory treatment has gained importance in the search for pharmacological treatments of different neurological and psychiatric diseases, such as depression, schizophrenia, Parkinson’s disease, and Alzheimer’s disease. Clinical studies demonstrate a reduction of the mentioned diseases’ symptoms after administration of anti-inflammatory drugs. Coumarin derivates have been shown to elicit anti-neuroinflammatory effects via G-protein coupled receptor (GPR)55, with possibly reduced side-effects compared to the known anti-inflammatory drugs.
- neuroinflammation
- GPR55
- coumarin derivates
- PGE2
- functional selectivity
1. Introduction
A growing body of research demonstrates the enormous role of neuroinflammation in neurological and psychiatric diseases, such as Alzheimer’s Disease (AD), Parkinson’s Disease (PD), schizophrenia, and depression [1][2][3][4]. Therefore, pharmacological mechanisms targeting neuroinflammation in the treatment of the mentioned diseases might open new therapeutical options. A meta-analysis, covering 36 randomized clinical trials (RCTs) and a total of about 10,000 patients, showed improvement of depressive symptoms after an intervention with specific anti-inflammatory substances, such as non-steroidal anti-inflammatory drugs (NSAIDs) and glucocorticoids, as monotherapy or added to a classic pharmaceutical anti-depressive therapy compared to placebo [5]. For AD, the effects of anti-neuroinflammatory treatment on the progress of neurodegeneration are discussed controversially due to differing results between epidemiological and clinical studies. Nevertheless, new approaches based on statistical modelling using the Alzheimer’s Disease Neuroimaging Initiative showed better cognitive baselines after treatment with NSAIDs and especially diclofenac treatment reduced cognitive decline [6]. PD is associated with neuroinflammation as well, and for this reason, anti-inflammatory treatment with NSAIDs decelerate the disease’s progression and protects remaining dopaminergic neurons [7]. However, these drugs are associated with severe side-effects in their established indications, limiting the period and dose of treatment. A total of 10% of hospitalizations of elderly people are related to preventable drug side-effects, with NSAIDs being responsible for 30% of these avoidable drug reactions. A total of 6% of the patients taking NSAIDs experience side-effects with the need for a consultation of a general doctor within 2 months [8]. Glucocorticoids, for example, impair mitochondrial functions and therefore might foster neurodegeneration due to increased oxidative stress [9]. Therefore, novel anti-inflammatory compounds with fewer potential harmful side-effects might promote the use of anti-inflammatory drugs in diseases such as AD, PD, and depression. The underlying mechanisms of the positive effects of NSAIDs on the mentioned diseases, such as inhibition of mitochondrial Ca2+ overload beside the known cyclooxygenase (COX) inhibition, are still objects of ongoing studies [7][10]. The COX enzymes are mediating the enzymatic conversion of arachidonic acid (AA) to prostaglandin (PG) H2, which is in turn metabolized to PGE2 by different prostaglandin E synthases (PGES), such as microsomal (m)PGES-1 or mPGES-2 [11]. PGE2 is known to act as pro-inflammatory in tissues and the CNS and increased levels are linked to psychiatric disorders such as psychosis [12], and therefore its reduction by NSAID treatment might be beneficial in neuropsychiatric diseases [5] as mentioned above.
Coumarin-based derivates have been shown to elicit anti-neuroinflammatory effects in primary microglia, decreasing lipopolysaccharide (LPS)-induced PGE2 release [13][14]. High levels of PGE2 promote brain injury and therefore act as a pro-inflammatory driver [15]. It has been suggested that the effects of coumarin derivates rely on antagonism with inverse agonistic activity at the G-protein coupled receptor 55 (GPR55) [13][14][16]. A recent study evaluating the effects of the two coumarin derivates KIT C and KIT H, which are investigated in this current study as well, showed anti-oxidative effects of both compounds, which were abolished after GPR55 knockout in SK-N-SH cells [17].
The GPR55 was discovered and cloned in 1999 [18] and is broadly expressed in the CNS, especially in the frontal cortex, putamen, striatum, and caudate [19]. Different studies identified numerous exogenous as well as endogenous ligands of the receptor. Besides ligands known to interact with receptors of the endocannabinoid system, such as delta9-tetrahydrocannabinol (Δ9-THC), L-α-lysophosphatidylinositol (LPI) has been demonstrated to have a strong affinity to GPR55 and is therefore suggested as an endogenous ligand of GPR55 [20]. Besides the endogenous ligands, synthetic selective GPR55 ligands, such as O-1602, acting as an agonist, and the antagonistic ML 193, have been introduced and are commonly used in GPR55 studies, among others [19]. Furthermore, derivates of the coumarin scaffold have been synthesized and suggested to act as antagonists on GPR55 [16][21]. Authors group demonstrated the anti-neuroinflammatory effects of different coumarin-based compounds with binding affinities to GPR55 named KIT 10 [14], KIT 3, KIT 17, and KIT 21 [13], showing anti-neuroinflammatory properties in primary microglial cell cultures.
The GPR55-mediated biological effects remain the focus of current research. However, GPR55 agonism might be associated with negative effects for the cells, tissues, and, consequently, the organism itself. Agonism and overexpression of GPR55 are associated with cancer proliferation [22], metabolic diseases, such as obesity and diabetes [23], and decreased osteoclast formation [24]. Therefore, GPR55 antagonists might reverse negative GPR55-mediated effects and open new therapeutical options in the treatment of several diseases. Various in vivo and in vitro studies with central nervous cells or tissues and model organisms are focusing on the effects of GPR55 expression and antagonists in different conditions and diseases. A model for AD, 5xFAD-mice, showed a higher expression of GPR55 in the hippocampus compared to heterozygotic and wildtype mice with impairments in novel object recognition [25]. In the chemically-induced murine PD model, chronic abnormal cannabidiol (GPR55 agonist) treatment improved motoric functions and acted neuroprotectively [26]. GPR55 agonists, as well as antagonists, enfolded beneficial effects on motor coordination and sensorimotor deficits on 6-hydroxydopamine-induced PD symptoms in rats [27], suggesting a more complex role of GPR55 in PD. Furthermore, intrahippocampal administration of the GPR55 agonist O-1602 protected against LPS-induced inflammatory insults of neural stem cells [28]. In another study, intracerebroventricular injection of O-1602 induced anxiolytic effects in an elevated plus-maze test in rats, whereas ML 193 led to increased anxiety-like behavior [29]. In the corticosterone-induced depressive-like behavior of rats, O-1602 reversed depressive-like behavior and normalized increased levels of interleukin (IL)-1β and tumor necrosis factor (TNF)α [30]. GPR55-knockout mice repealed hyperalgesia to mechanical stimuli suggesting GPR55 to be a promising target for treating inflammatory and neuropathic pain [31]. The featured studies indicate a complex role of GPR55 in neurological and psychiatric diseases, with the agonism, as well as the antagonism, being beneficial dependent on the concrete situation. Association of a GPR55-mutation with psychiatric diseases has been shown in human clinical trials as well. In suicide victims without any diagnosed mental illness, decreased GPR55 and CB2 gene expression with increased GPR55-CB2 heteromers were found in the dorsolateral prefrontal cortex (DLPFC), eliciting a potential involvement of GPR55 in impulsivity and decision-making in suicide [32]. The single nucleotide polymorphism Gly195Val of the GPR55 is associated with an increased risk of Anorexia nervosa (AN) in a study comparing Japanese AN-patients with an age-unmatched control group [33].
GPR55 transduces extracellular signals via Gα12/13 [34] and Gαq [35], resulting in the phosphorylation and activation of phospholipase C, protein kinase C (PKC), mitogen-activated protein kinases (MAPK) such as p38 MAPK, and extracellular signal-regulated kinase (ERK), followed by the activation of transcriptional factors [19]. The activation of the different pathways is complexly regulated and might differ between various ligands [36]. These phenomena might be explained by different primary active states of one receptor as a response to different ligands resulting in distinct conformations responsible for the selective pathway activation, also referred to as functional selectivity [37][38]. As shown in a previous study [13], comparing the three coumarin-based compounds, KIT 3, KIT 17, and KIT 21, the effects on PGE2-reduction of the compounds show enormous differences probably dependent on the chemical residues, which might be explained by functional selectivity for antagonists. In contrast to GPR55 agonists, GPR55 antagonists are defined by a head region with the most electronegative region near the end of the central portion, whereas agonists have the electronegativity in the head region. Furthermore, GPR55 antagonists show an aromatic or heterocyclic ring that protrudes out of the binding pocket of GPR55, potentially preventing any conformational change [19]. Therefore, the different residues of the tested coumarin-based compounds [13][14] might determine how deep the compounds fit in the binding pocket and therefore, how potent the compounds might change the receptors state following the extent of the biological effects.
2. Effects of the Compounds on Cell Viability
Results of the performed MTT cell viability assay for the used compounds are presented in Figure 1. Neither KIT C (light grey bars) or KIT H (dark grey bars), as shown before [17], nor O-1602 (light blue bar) or ML 193 (blue bar) showed cytotoxic effects in IL-1β-stimulated SK-N-SH cells compared to untreated cells. KIT C in concentrations of 5 and 10 µM, 1 µM KIT H, and 25 µM ML 193, on the contrary, significantly increased cell viability or metabolism. Ethanol, used as positive control, strongly induced cell death as expected. Since none of the compounds in the concentrations tested elicited cytotoxic effects, authors proceeded with further experiments.
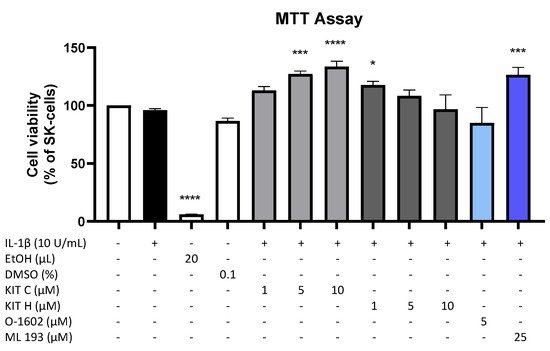
Figure 1. Effects of KIT C (light grey bars), KIT H (dark grey bars), O-1602 (light blue bar), and ML 193 (blue bar) on cell viability in IL-1β-stimulated SK-N-SH cells (24 h treatment). Cell viability was measured by change in color due to MTT-oxidation, and absorbance was measured at 595 nm using an ELISA-reader. Values are presented as the mean ± SEM of at least three independent experiments. Statistical analysis was performed using one-way ANOVA with Dunett’s post hoc tests with * p < 0.05, *** p < 0.001, **** p < 0.0001 compared to untreated cells. The figure is derived from authors previous publication [17].
3. Effects of the Compounds on IL-1β-Induced PGE2-Release
Since PGE2 is the central molecule in the AA/COX-2/PGE2 pathway and acts pro-inflammatory, next authors investigated the effects of KIT C, KIT H, O-1602, and ML 193 on PGE2-release in IL-1β-stimulated SK-N-SH cells. KIT C (light grey bars), as well as KIT H (dark grey bars), showed a significant and concentration-dependent reduction of IL-1β-induced PGE2-levels (Figure 2) starting at concentrations of 5 µM. KIT H elicited a more potent PGE2-reduction than KIT C, reaching basal PGE2-concentrations of untreated cells in the concentration of 25 µM. ML 193 (blue bar), a GPR55 antagonist, also showed significant inhibition of IL-1β-mediated PGE2-release, with an effect size between KIT C and KIT H. O-1602 (light blue bar), a potent GPR55 agonist, did not significantly inhibit IL-1β-induced PGE2-synthesis.
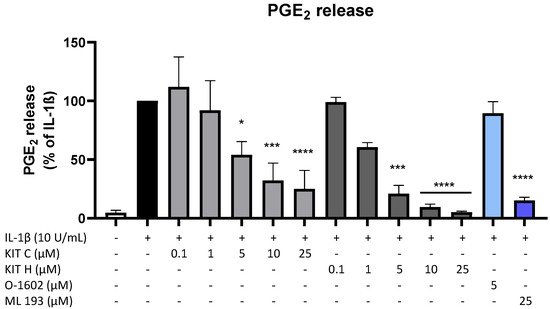
Figure 2. Effects of KIT C (light grey bars), KIT H (dark grey bars), O-1602 (light blue bar), and ML 193 (blue bar) on PGE2-release in IL-1β-stimulated SK-N-SH cells. Cells were stimulated as described under material and methods. After 24 h of stimulation, supernatants were collected and the release of PGE2 was measured by EIA. Values are presented as the mean ± SEM of at least three independent experiments. Statistical analysis was performed using one-way ANOVA with Dunnett’s post hoc tests with * p < 0.05, *** p < 0.001, **** p < 0.0001 compared to IL-1β.
4. GPR55 Activity of KIT C and KIT H
To prove whether the observed anti-inflammatory effects of KIT C and KIT H are mediated via GPR55, a GPR55 activation assay was performed (Figure 3). AM251 (1 µM), a GPR55 agonist with additional activities at CB1- and CB2-receptors, and LPI (10 µM), the physiological agonist of GPR55, were used as positive controls. KIT C in concentrations of 5 and 10 µM showed about a 4-fold higher GPR55 activation than 1 µM AM251 without reaching significance but showing a clear trend. KIT H revealed about a 2-fold but not significantly higher GPR55 activation than 1 µM AM251 in all tested concentrations, comparable to the GPR55 activation capacity of 10 µM LPI.
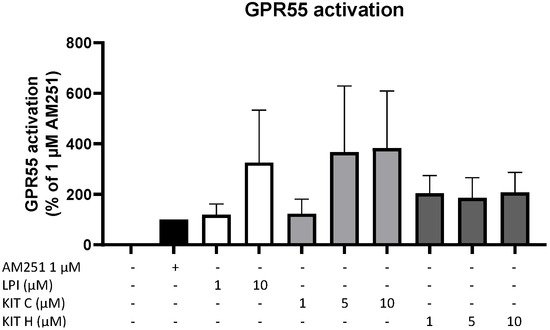
Figure 3. GPR55 activation by AM251 (black bar), LPI (white bars), KIT C (light grey bars), and KIT H (dark grey bars) in HEK293T-GPR55 cells. Cells were treated as described under material and methods. After 6 h of stimulation, cells were lysed, and the luciferase activity was measured. Values are presented as the mean ± SEM of at least three independent experiments. Statistical analysis was performed using one-way ANOVA with Dunnett’s post hoc tests compared to 1 µM AM251.
5. Effects of KIT C and KIT H on COX-2 mRNA and Protein Levels
To investigate the underlying mechanisms of the strong PGE2-reduction, COX-2 expression and synthesis were evaluated using Western Blot (Figure 4A) and qPCR (Figure 4B). COX-2 protein synthesis was potently increased by IL-1β if compared to the untreated control. Pre-treatment with exclusively 5 µM KIT C (light grey bars) reduced IL-1β-stimulated COX-2 levels in SK-N-SH cells. KIT H (dark grey bars) significantly reduced IL-1β-mediated COX-2 synthesis starting with the concentration of 1 µM. As shown in Figure 4B, COX-2 mRNA expression was potently induced by IL-1β-stimulation for 4 h. Whereas KIT H (dark grey bars) did not affect IL-1β-induced COX-2 expression, KIT C (light grey bars) significantly enhanced IL-1β-induced COX-2 expression in concentrations of 0.1, 5, and 10 µM which contrasts with the Western Blot results. Treatment with KIT C for different time points (2, 4, 8, 12, 24 h) followed by the analysis of COX-2 protein synthesis and mRNA expression did not explain the observed diverging effects on COX-2 synthesis and expression, so authors can exclude effects based on differences in the IL-1β-stimulation time course. COX-2 mRNA expression was higher or at least comparable to the IL-1β positive control at all time points, whereas COX-2 protein levels were first detectable after 8 h at higher levels than IL-1β-stimulated cells and started to decrease after 12 h of stimulation. After 24 h, COX-2 expression remained comparable to or higher than IL-1β-treated cells, while protein levels were significantly reduced as shown in Figure 4.
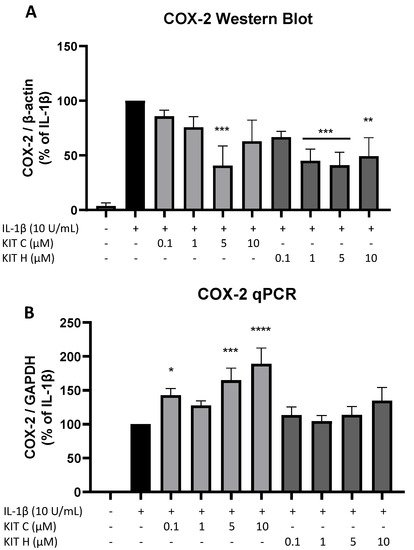
Figure 4. Effects of KIT C (light grey bars) and KIT H (dark grey bars) on COX-2 protein levels (A) and COX-2 mRNA expression (B) in IL-1β-stimulated SK-N-SH cells. Cells were stimulated and analyzed as described under material and methods. Values are presented as the mean ± SEM of at least three independent experiments. Statistical analysis was performed using one-way ANOVA with Dunnett’s post hoc tests with * p < 0.05, ** p < 0.01, *** p < 0.001 and **** p < 0.0001 compared to IL-1β.
6. Effects of KIT C and KIT H on COX-Activity
Besides COX synthesis and expression, enzyme activities of COX-1 (Figure 5A) and COX-2 (Figure 5B) were examined as another possible mechanism of PGE2-reduction independent of COX synthesis and expression. Neither KIT C (light grey bars) nor KIT H (dark grey bars), the GPR55 agonist O-1602, and antagonist ML 193 affected COX-1 or COX-2 activities in concentrations between 0.1 and 10 µM. Both COX inhibitor controls potently decreased COX activities. The selective COX-1 inhibitor SC-560 decreased COX-1 activity by about 70% but did not reach significance. The COX-1 and COX-2 inhibitor diclofenac in concentrations of 0.1 and 1 µM significantly reduced COX-2 activity.
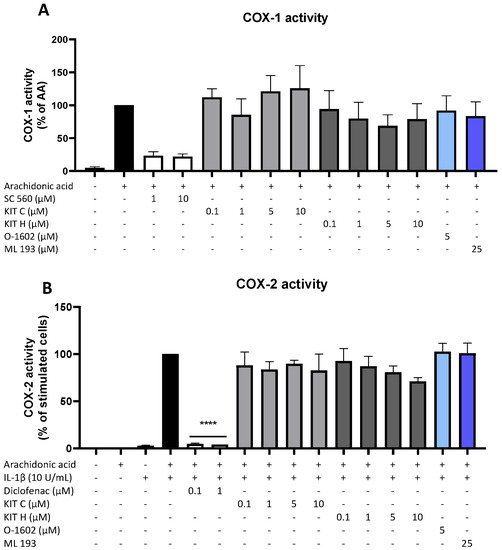
Figure 5. Effects of KIT C (light grey bars), KIT H (dark grey bars), O-1602 (light blue bar), and ML 193 (blue bar) on COX-1 (A) and COX-2 enzyme activities (B) in SK-N-SH cells. (A) COX-1-activity was measured after 15 min of incubation with arachidonic acid (AA). Levels of PGE2 in the supernatants were quantified by EIA. (B) After 24 h of IL-1β pre-stimulation, 15 µM of arachidonic acid (AA) was added and PGE2-release was measured by EIA. Values are presented as the mean ± SEM of at least three independent experiments. Statistical analysis was carried out by using one-way ANOVA with Dunnett’s post hoc tests with **** p < 0.0001 compared to AA (A) or IL-1β with AA (B).
7. Effects of KIT C and KIT H on COX-1 and mPGES-1 Expression
Next, authors studied the effects of KIT C (light grey bars) and KIT H (dark grey bars) on two other important enzymes involved in the AA/PGE2 pathway, COX-1 and mPGES-1. The expression of both enzymes was evaluated using qPCR. The expression of mPGES-1 (Figure 6A) was strongly induced by IL-1β-treatment for 4 h and 10 µM of KIT C slightly but significantly increased mPGES-1 expression compared to the IL-1β positive control. KIT H did not affect IL-1β-stimulated mPGES-1 expression. COX-1 expression (Figure 6B) was decreased by stimulation with IL-1β, and KIT C, as well as KIT H, partially ameliorated the IL-1β-induced reduction of COX-1 expression.
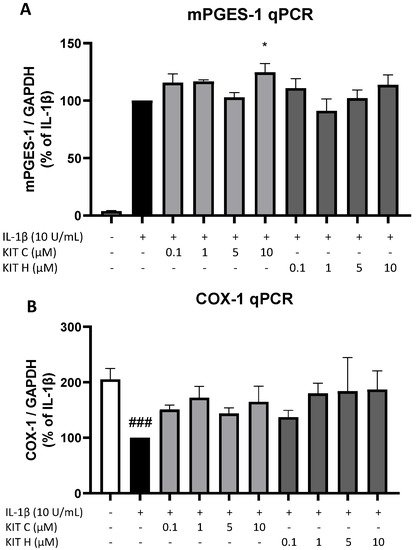
Figure 6. Effects of KIT C (light grey bars) and KIT H (dark grey bars) on mPGES-1 (A) and COX-1 mRNA expression (B) in IL-1β-stimulated SK-N-SH cells. Cells were stimulated as described under material and methods. After 4 h of stimulation, RNA was isolated and mRNA levels of the shown target genes were measured using qPCR. Values are presented as the mean ± SEM of at least three independent experiments. Statistical analysis was performed using one-way ANOVA with Dunnett’s post hoc tests with * p < 0.05 and ### p < 0.001 compared to IL-1β (A) or to untreated cells (B).
8. Effects of KIT C and KIT H on IL-1β–Induced Cytokine Release
Besides the AA/PGE2 pathway, the effects of KIT C (light grey bars) and KIT H (dark grey bars) on IL-1β-induced IL-6 as pro-inflammatory and IL-10 as anti-inflammatory cytokines were investigated (Figure 7). Stimulation with IL-1β for 24 h potently induced IL-6 release in SK-N-SH cells but neither KIT C nor KIT H nor O-1602 affected IL-6 production (Figure 7A). The GPR55 antagonist ML 193, however, significantly reduced IL-1β and increased IL-6 release by about 60% in IL-1β-treated SK-N-SH cells.
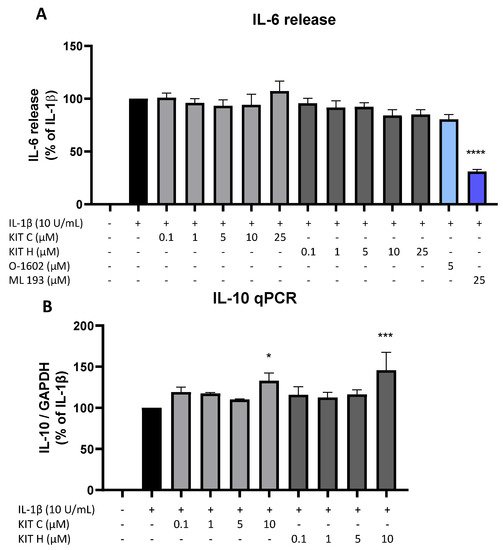
Figure 7. Effects of KIT C (light grey bars), KIT H (dark grey bars), O-1602 (light blue bar), and ML 193 (blue bar) on IL-6 release (A) and effects of KIT C and KIT H on IL-10 mRNA expression (B) in IL-1β-stimulated SK-N-SH cells. Cells were stimulated as described under material and methods. After 24 h of stimulation, supernatants were collected and the release of IL-6 was measured by ELISA (A). After 4 h of stimulation, RNA was isolated and the mRNA levels of the shown target genes were measured using qPCR. Values are presented as the mean ± SEM of at least three independent experiments. Statistical analysis was performed using one-way ANOVA with Dunnett’s post hoc tests with * p < 0.05, *** p < 0.001 and **** p < 0.0001 compared to IL-1β.
IL-1β reliably induced IL-10 mRNA expression in SK-N-SH cells as shown by qPCR, and KIT C as well as KIT H both enhanced IL-1β-stimulated IL-10 mRNA levels in concentrations of 10 µM compared to IL-1β the positive control (Figure 7B).
9. Effects of KIT C and KIT H on PGE2- and IL-6 Release in LPS-Stimulated Primary Mouse Microglia
The promising results of KIT C and KIT H in SK-N-SH cells were re-evaluated in primary mouse microglia as preliminary results for follow-up studies. Only KIT C (light grey bars) but not KIT H (dark grey bars) significantly reduced PGE2-levels after LPS-induction in primary microglia (Figure 8A). A total of 10 µM KIT C reduced PGE2 levels to concentrations compared to untreated primary microglia.
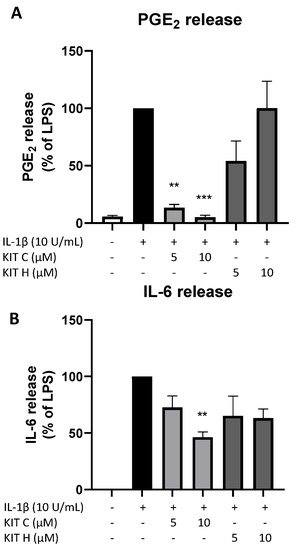
Figure 8. Effects of KIT C (light grey bars) and KIT H (dark grey bars) on PGE2- (A) and IL-6-synthesis (B) in LPS-stimulated primary mice microglia. Cells were stimulated as described under material and methods. After 24 h of stimulation, supernatants were collected and the release of PGE2 or IL-6 was measured by EIA/ELISA. Values are presented as the mean ± SEM of at least three independent experiments. Statistical analysis was performed using one-way ANOVA with Dunnett’s post hoc tests with ** p < 0.01 and *** p < 0.001 compared to LPS.
LPS-stimulation for 24 h potently induced IL-6 production (Figure 8B) in primary mice microglia as well. KIT C (light grey bars) significantly decreased LPS-induced IL-6-synthesis by about 50% and KIT H (dark grey bars) showed a non-significant trend of reducing IL-6 release in primary mice microglial cells.
This entry is adapted from the peer-reviewed paper 10.3390/ijms23020959
References
- Craft, J.M.; Watterson, D.M.; Van Eldik, L.J. Neuroinflammation: A potential therapeutic target. Expert Opin. Ther. Targets 2005, 9, 887–900.
- Troubat, R.; Barone, P.; Leman, S.; Desmidt, T.; Cressant, A.; Atanasova, B.; Brizard, B.; El Hage, W.; Surget, A.; Belzung, C.; et al. Neuroinflammation and depression: A review. Eur. J. Neurosci. 2021, 53, 151–171.
- Picca, A.; Calvani, R.; Coelho-Junior, H.J.; Landi, F.; Bernabei, R.; Marzetti, E. Mitochondrial Dysfunction, Oxidative Stress, and Neuroinflammation: Intertwined Roads to Neurodegeneration. Antioxidants 2020, 9, 647.
- Najjar, S.; Pearlman, D.M.; Alper, K.; Najjar, A.; Devinsky, O. Neuroinflammation and psychiatric illness. J. Neuroinflamm. 2013, 10, 816.
- Köhler-Forsberg, O.N.; Lydholm, C.; Hjorthøj, C.; Nordentoft, M.; Mors, O.; Benros, M.E. Efficacy of anti-inflammatory treatment on major depressive disorder or depressive symptoms: Meta-analysis of clinical trials. Acta Psychiatr. Scand. 2019, 139, 404–419.
- Rivers-Auty, J.; Mather, A.E.; Peters, R.; Lawrence, C.B.; Brough, D. Anti-inflammatories in Alzheimer’s disease—Potential therapy or spurious correlate? Brain Commun. 2020, 2, fcaa109.
- Esposito, E.; Di Matteo, V.; Benigno, A.; Pierucci, M.; Crescimanno, G.; Di Giovanni, G. Non-steroidal anti-inflammatory drugs in Parkinson’s disease. Exp. Neurol. 2007, 205, 295–312.
- Davis, A.; Robson, J. The dangers of NSAIDs: Look both ways. Br. J. Gen. Pract. J. R. Coll. Gen. Pract. 2016, 66, 172–173.
- Choi, G.E.; Han, H.J. Glucocorticoid impairs mitochondrial quality control in neurons. Neurobiol. Dis. 2021, 152, 105301.
- Sanz-Blasco, S.; Valero, R.A.; Rodríguez-Crespo, I.; Villalobos, C.; Núñez, L. Mitochondrial Ca2+ Overload Underlies Aβ Oligomers Neurotoxicity Providing an Unexpected Mechanism of Neuroprotection by NSAIDs. PLoS ONE 2008, 3, e2718.
- Lee, H.; Trott, J.S.; Haque, S.; McCormick, S.; Chiorazzi, N.; Mongini, P.K.A. A Cyclooxygenase-2/Prostaglandin E Pathway Augments Activation-Induced Cytosine Deaminase Expression within Replicating Human B Cells. J. Immunol. 2010, 185, 5300–5314.
- Moreno, C.; Parellada, M.; MacDowell, K.S.; García-Bueno, B.; Cabrera, B.; González-Pinto, A.; Saiz, P.; Lobo, A.; Rodriguez-Jimenez, R.; Berrocoso, E.; et al. Differences in the regulation of inflammatory pathways in adolescent- and adult-onset first-episode psychosis. Eur. Child Adolesc. Psychiatry 2019, 28, 1395–1405.
- Saliba, S.W.; Jauch, H.; Gargouri, B.; Keil, A.; Hurrle, T.; Volz, N.; Mohr, F.; van der Stelt, M.; Bräse, S.; Fiebich, B.L. Anti-neuroinflammatory effects of GPR55 antagonists in LPS-activated primary microglial cells. J. Neuroinflamm. 2018, 15, 322.
- Saliba, S.W.; Gläser, F.; Deckers, A.; Keil, A.; Hurrle, T.; Apweiler, M.; Ferver, F.; Volz, N.; Endres, D.; Bräse, S.; et al. Effects of a Novel GPR55 Antagonist on the Arachidonic Acid Cascade in LPS-Activated Primary Microglial Cells. Int. J. Mol. Sci. 2021, 22, 2503.
- Liu, Q.; Liang, X.; Wang, Q.; Wilson, E.N.; Lam, R.; Wang, J.; Kong, W.; Tsai, C.; Pan, T.; Larkin, P.B.; et al. PGE signaling via the neuronal EP2 receptor increases injury in a model of cerebral ischemia. Proc. Natl. Acad. Sci. USA 2019, 116, 10019–10024.
- Rempel, V.; Volz, N.; Gläser, F.; Nieger, M.; Bräse, S.; Müller, C.E. Antagonists for the Orphan G-Protein-Coupled Receptor GPR55 Based on a Coumarin Scaffold. J. Med. Chem. 2013, 56, 4798–4810.
- Apweiler, M.; Saliba, S.W.; Streyczek, J.; Hurrle, T.; Gräßle, S.; Bräse, S.; Fiebich, B.L. Targeting Oxidative Stress: Novel Coumarin-Based Inverse Agonists of GPR55. Int. J. Mol. Sci. 2021, 22, 11665.
- Sawzdargo, M.; Nguyen, T.; Lee, D.K.; Lynch, K.R.; Cheng, R.; Heng, H.H.Q.; George, S.R.; O’Dowd, B.F. Identification and cloning of three novel human G protein-coupled receptor genes GPR52, ΨGPR53 and GPR55: GPR55 is extensively expressed in human brain. Mol. Brain Res. 1999, 64, 193–198.
- Shore, D.M.; Reggio, P.H. The therapeutic potential of orphan GPCRs, GPR35 and GPR55. Front. Pharmacol. 2015, 6, 69.
- Oka, S.; Nakajima, K.; Yamashita, A.; Kishimoto, S.; Sugiura, T. Identification of GPR55 as a lysophosphatidylinositol receptor. Biochem. Biophys. Res. Commun. 2007, 362, 928–934.
- Rempel, V.; Volz, N.; Hinz, S.; Karcz, T.; Meliciani, I.; Nieger, M.; Wenzel, W.; Bräse, S.; Müller, C.E. 7-Alkyl-3-benzylcoumarins: A Versatile Scaffold for the Development of Potent and Selective Cannabinoid Receptor Agonists and Antagonists. J. Med. Chem. 2012, 55, 7967–7977.
- Falasca, M.; Ferro, R. Role of the lysophosphatidylinositol/GPR55 axis in cancer. Adv. Biol. Regul. 2016, 60, 88–93.
- Moreno-Navarrete, J.M.; Catalan, V.; Whyte, L.; Diaz-Arteaga, A.; Vazquez-Martinez, R.; Rotellar, F.; Guzman, R.; Gomez-Ambrosi, J.; Pulido, M.R.; Russell, W.R.; et al. The L-α-Lysophosphatidylinositol/GPR55 System and Its Potential Role in Human Obesity. Diabetes 2012, 61, 281–291.
- Whyte, L.S.; Ryberg, E.; Sims, N.A.; Ridge, S.A.; Mackie, K.; Greasley, P.J.; Ross, R.A.; Rogers, M.J. The putative cannabinoid receptor GPR55 affects osteoclast function in vitro and bone mass in vivo. Proc. Natl. Acad. Sci. USA 2009, 106, 16511–16516.
- Medina-Vera, D.; Rosell-Valle, C.; López-Gambero, A.J.; Navarro, J.A.; Zambrana-Infantes, E.N.; Rivera, P.; Santín, L.J.; Suarez, J.; Rodríguez de Fonseca, F. Imbalance of Endocannabinoid/Lysophosphatidylinositol Receptors Marks the Severity of Alzheimer’s Disease in a Preclinical Model: A Therapeutic Opportunity. Biology 2020, 9, 377.
- Celorrio, M.; Rojo-Bustamante, E.; Fernández-Suárez, D.; Sáez, E.; de Mendoza, A.E.-H.; Müller, C.E.; Ramírez, M.J.; Oyarzábal, J.; Franco, R.; Aymerich, M.S. GPR55: A therapeutic target for Parkinson’s disease? Neuropharmacology 2017, 125, 319–332.
- Fatemi, I.; Abdollahi, A.; Shamsizadeh, A.; Allahtavakoli, M.; Roohbakhsh, A. The effect of intra-striatal administration of GPR55 agonist (LPI) and antagonist (ML193) on sensorimotor and motor functions in a Parkinson’s disease rat model. Acta Neuropsychiatr. 2021, 33, 15–21.
- Hill, J.D.; Zuluaga-Ramirez, V.; Gajghate, S.; Winfield, M.; Sriram, U.; Rom, S.; Persidsky, Y. Activation of GPR55 induces neuroprotection of hippocampal neurogenesis and immune responses of neural stem cells following chronic, systemic inflammation. Brain. Behav. Immun. 2019, 76, 165–181.
- Rahimi, A.; Hajizadeh Moghaddam, A.; Roohbakhsh, A. Central administration of GPR55 receptor agonist and antagonist modulates anxiety-related behaviors in rats. Fundam. Clin. Pharmacol. 2015, 29, 185–190.
- Wróbel, A.; Serefko, A.; Szopa, A.; Ulrich, D.; Poleszak, E.; Rechberger, T. O-1602, an Agonist of Atypical Cannabinoid Receptors GPR55, Reverses the Symptoms of Depression and Detrusor Overactivity in Rats Subjected to Corticosterone Treatment. Front. Pharmacol. 2020, 11, 1002.
- Staton, P.C.; Hatcher, J.P.; Walker, D.J.; Morrison, A.D.; Shapland, E.M.; Hughes, J.P.; Chong, E.; Mander, P.K.; Green, P.J.; Billinton, A.; et al. The putative cannabinoid receptor GPR55 plays a role in mechanical hyperalgesia associated with inflammatory and neuropathic pain. Pain 2008, 139, 225–236.
- García-Gutiérrez, M.S.; Navarrete, F.; Navarro, G.; Reyes-Resina, I.; Franco, R.; Lanciego, J.L.; Giner, S.; Manzanares, J. Alterations in Gene and Protein Expression of Cannabinoid CB2 and GPR55 Receptors in the Dorsolateral Prefrontal Cortex of Suicide Victims. Neurotherapeutics 2018, 15, 796–806.
- Ishiguro, H.; Onaivi, E.S.; Horiuchi, Y.; Imai, K.; Komaki, G.; Ishikawa, T.; Suzuki, M.; Watanabe, Y.; Ando, T.; Higuchi, S.; et al. Functional polymorphism in the GPR55 gene is associated with anorexia nervosa. Synapse 2011, 65, 103–108.
- Ryberg, E.; Larsson, N.; Sjögren, S.; Hjorth, S.; Hermansson, N.-O.; Leonova, J.; Elebring, T.; Nilsson, K.; Drmota, T.; Greasley, P.J. The orphan receptor GPR55 is a novel cannabinoid receptor: GPR55, a novel cannabinoid receptor. Br. J. Pharmacol. 2007, 152, 1092–1101.
- Lauckner, J.E.; Jensen, J.B.; Chen, H.-Y.; Lu, H.-C.; Hille, B.; Mackie, K. GPR55 is a cannabinoid receptor that increases intracellular calcium and inhibits M current. Proc. Natl. Acad. Sci. USA 2008, 105, 2699–2704.
- Henstridge, C.M.; Balenga, N.A.; Schröder, R.; Kargl, J.K.; Platzer, W.; Martini, L.; Arthur, S.; Penman, J.; Whistler, J.L.; Kostenis, E.; et al. GPR55 ligands promote receptor coupling to multiple signalling pathways. Br. J. Pharmacol. 2010, 160, 604–614.
- Kenakin, T. Functional Selectivity through Protean and Biased Agonism: Who Steers the Ship? Mol. Pharmacol. 2007, 72, 1393–1401.
- Kenakin, T.; Christopoulos, A. Signalling bias in new drug discovery: Detection, quantification and therapeutic impact. Nat. Rev. Drug Discov. 2013, 12, 205–216.
This entry is offline, you can click here to edit this entry!