Multispectral Imaging for Quality Determinations of White Meat: History
Please note this is an old version of this entry, which may differ significantly from the current revision.
Contributor:

White meat is the nutritional term for lighter-colored meat that contains less myoglobin than red meat, which contains a great deal. White meat includes poultry (e.g., chicken, duck, goose and turkey), fish, reptiles (e.g., land snail), amphibians (e.g., frog), crustaceans (e.g., shrimp and crab) and bivalves (e.g., oyster and clam), but it excludes all mammal flesh such as beef, pork, and lamb. White meat has high nutritional value and plays an important role in human diet. The production and sale of white meat need to meet specific quality and safety standards. Fluorescence spectroscopy, color imaging and multispectral imaging (MSI) have emerged as effective analytical methods for the non-destructive detection of quality attributes of various white meat products such as fish, shrimp, chicken, duck and goose.

  • white meat
  • multispectral imaging
  • fluorescence spectroscopy
  • convolutional neural network
  • quality detection

1. Introduction

As a global issue, food safety and quality are of increasing concern to companies and customers [1]. White meat is the nutritional term for lighter-colored meat that contains less myoglobin than red meat, which contains a great deal. Compared with white meat, the intake of red meat has a greater correlation with colorectal cancer (CRC), indicating that white meat intake is more beneficial to human health [2]. White meat includes poultry (e.g., chicken, duck, goose and turkey), fish, reptiles (e.g., land snail), amphibians (e.g., frog), crustaceans (e.g., shrimp and crab) and bivalves (e.g., oyster and clam), but it excludes all mammal flesh such as beef, pork, and lamb. White meat has high nutritional value and plays an important role in human diet. The production and sale of white meat need to meet specific quality and safety standards. The freshness of fish is one of the important indicators for evaluating its quality because of its high perishability [3]. Moreover, poultry products are particularly susceptible to oxidation as this meat contains relatively high levels of unsaturated fatty acids and low levels of natural antioxidants, such as vitamin E. In addition, chemical residues in white meat may have an adverse effect on human health. For example, fluoroquinolone antibiotics are effective against a wide range of Gram-negative and positive bacteria, thus they are widely used in the medical and veterinary fields. However, their use in animals has raised concerns, as this practice may lead to an increase in microbial resistance [4]. Moreover, nitrofuran drugs (NFs), including furazolidone (FZD), nitrofurazone (NFZ), and furantazone (FTD) are broad-spectrum antimicrobials. The potential risk of these compounds to human health is of great concern because of their carcinogenic and mutagenic properties. It is therefore crucial to ensure the quality and safety of white meat.
Traditional methods for meat quality and safety evaluation, such as manual inspection, mechanical and chemical methods, are time-consuming and destructive, and cannot meet the requirements of rapid inspection [5]. For example, methods for freshness evaluation are based on human sensory qualities, such as appearance, taste and texture. However, human senses exhibit a very high degree of subjectivity and can therefore be questioned in certain situations [3]. Even if manual inspection could meet accuracy requirements, it is still a labor-intensive and time-consuming process. Recently, the meat industry has adopted the most advanced high-speed processing technologies, and meat processors need fast, non-destructive, easy-to-use techniques to control the safety and quality of meat and meat products in order to achieve economic benefits. The requirement for real-time monitoring of food has encouraged the development of non-destructive measurement systems [6]. Optical technology is becoming increasingly important in research and industrial applications to measure the quality attributes of meat and meat products in real time, non-destructively and accurately [7]. Among these, the use of neural network-based RGB imaging technology has become very popular in recent years [8]. In addition, fluorescence spectroscopy and multispectral imaging (MSI) also show obvious advantages and capabilities in the non-destructive evaluation of white meat.
There have been several reviews of these new techniques of meat quality assessment. These papers show that these spectroscopic methods have been implemented as an alternative to traditional methods, but they mainly focus on one technique for quality detection of one specific category of meat, e.g., fish [3], shrimp [4], chicken [9], duck [10], or red meat [11]. As far as we know, there is no literature review analyzing the application of various imaging techniques in the non-destructive quality inspection of various white meats. (The published reviews based on these three imaging techniques are tabulated in Table 1).
Table 1. Summary of reviews on fluorescence spectroscopy, RGB- and MSI techniques in food evaluation.
 

Technology

Product

Target Attributes

Reference

MSI

Meat

Adulteration

Ropodi et al. [12]

MSI, HSI

Meat

Defects

Feng et al. [13]

MSI

Food

Quality

Su and Sun [14]

MSI, IRS, SERS, LIBS and HSI

Food

Quality

Wang et al. [15]

MSI, HSI and VS

Food

Authenticity, quality and safety

Ropodi et al. [16]

Fluorescence spectroscopy

Food

Quality

Karoui and Blecker [17]

Fluorescence spectroscopy

Food

Quality

Strasburg and Ludescher [18]

Visible/Infrared, Raman and Fluorescence spectroscopy

Raw and processed food

Quality

He and Sun [19]

Fluorescence spectroscopy

Food

Quality

Ahmad et al. [20]

Fluorescence spectroscopy

Dairy products

Quality and safety

Shaikh and O’Donnell [21]

Fluorescence spectroscopy

Fresh and frozen-thawed muscle foods

Muscle classification

Hassoun [22]

RGB-Imaging

Meat

Quality and safety

Taheri-Garavand et al. [23]

RGB-Imaging

Fish

Quality

Dowlati et al. [24]

RGB-Imaging

Food

Quality

Gomes and Leta [25]

RGB-Imaging

Food

Quality

Amani et al. [26]

MSI––Multispectral imaging; HSI––Hyperspectral imaging; IRS––Infrared spectroscopy; SERS––Surface-Enhanced Raman Spectroscopy; LIBS––Laser induced breakdown spectroscopy; VS––Vibrational Spectroscopy.

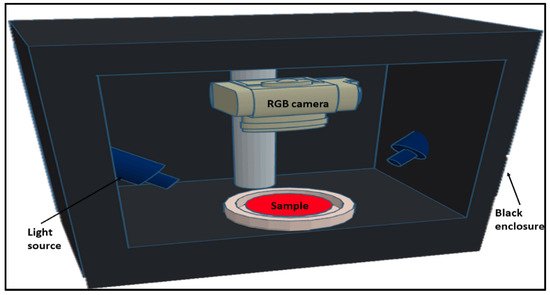
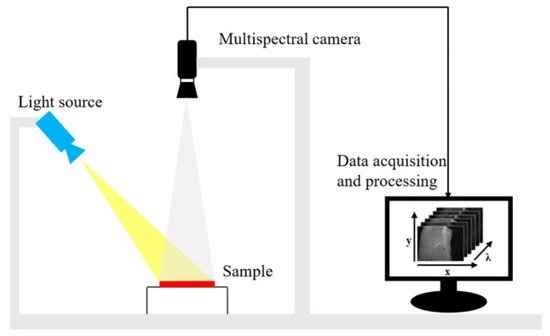
2. Fluorescence Spectroscopy, RGB- and Multispectral-Imaging

Fluorescence spectroscopy has proven to be an effective analytical technique over the last decade for monitoring the properties of various food products [27]. The number of published papers and citations on the use of fluorescence spectroscopy to study food quality and/or authenticity has increased exponentially over the last decade. Fluorescence is the emission of light by a fluorophore following the absorption of ultraviolet or visible light [28]. Fluorophores absorb energy as light at specific wavelengths and release energy as light at higher wavelengths. The Jablonski diagram in Figure 1 illustrates the electron energy levels of fluorophores, with the jumps between them indicated by arrows [29]. Fluorescent compounds are highly sensitive to their environment, so fluorescence can be used to characterize the conformational changes that occur under different production and storage conditions [21]. For specific applications, fluorescence analysis has the lowest background levels, low detection limits and is readily available in most laboratories [30].
Figure 1. Jablonski diagram of the electron energy levels and transitions of fluorophores [29].
RGB imaging or color imaging has gained popularity due to its clear color rendering principle, simple hardware structure and mature production process. RGB images are captured by digital cameras, webcams, or scanners from computer vision systems. These systems, typically containing an illumination system, camera and image analysis software using a computer [31], are capable of retrieving color information from captured images in the form of pixel ribbons of RGB [32]. Figure 2, for example, shows an RGB vision system for capturing color images of pure and adulterated meat samples [33]. RGB imaging has been shown to determine the general color and visual appearance of samples [34]. This imaging technology is valuable in the meat industry because it is simple, low cost and non-destructive. However, even though RGB imaging has many advantages, it only provides spatial information at a limited number of wavelengths. Conventional RGB imaging systems can be poor at identifying sensitive surface features in wavelengths other than RGB [35]. Data obtained from pure RGB imaging has been shown to be inferior to data obtained through spectral imaging when analyzing the quality of ground meat.
Figure 2. Diagram of the RGB vision system used to obtain color images of pure and contaminated meat samples [33].
A multispectral image is a collection of grey-scale images. Each corresponds to a specific wavelength or band of wavelengths in the electromagnetic spectrum [36]. MSI is a method of capturing images from different spectral bands with the aim of obtaining spatial and spectral information. Imagers based on MSI technology can provide wavelength channels in the near-UV, visible, near-IR, mid-IR and far-IR [37]. Thus, MSI can provide more information than RGB images. The acquired wavelength channels can be used directly for real-time applications in certain fields (e.g., fruit packing plants and food processing plants). A typical MSI system is shown in Figure 3. The system uses an adjustable focus lens to achieve high resolution imaging of 1290 × 960 pixels and has six bands, each covering a relatively wide range of wavelengths, which is strong for fast imaging [38].
Figure 3. The MSI system consists of a light source (HL-2000-FHSA; Ocean Optics, Dunedin, FL, USA) and focusable lens (Nikon, Tokyo, Japan) plus a multi-channel spectral camera (miniCAM5; QHY-CCD, China) [38].

3. Quality Evaluation of White Meat

The application of fluorescence spectroscopy, RGB imaging and MSI for white meat quality inspection has been thoroughly and extensively researched as shown in Table 2.  For MSI techniques, correlation coefficient (R) or coefficient of determination (R2) is an important statistical metric for assessing model fit, while root mean square error (RMSE) is considered an indicator of the sample standard deviation between measured and actual values, indicating that a well-performing model should obtain a high R or R2 value and a low RMSE value. There are many different judgements due to the variability and multiplicity of the techniques.
Table 2. Applications of fluorescence spectroscopy, RGB imaging and MSI for quality evaluation of various white meat products.

White Meat

Module

Quality Parameters

Accuracy

Reference

Fish

MSI

TVB-N,

PPC

R2p = 0.862 for TVB-N,

R2p = 0.921 for PPC

Khoshnoudi-Nia and Moosavi-Nasab [39], Khoshnoudi-Nia and Moosavi-Nasab [40]

Fish

MSI

TVC

R2 = 0.62

Govari, et al. [41]

Fish

MSI

TVC

R2 = 0.683

Fengou, et al. [42]

Fish

MSI

Astaxanthin concentration

R2 = 0.86

Dissing, et al. [43]

Fish

MSI

TVB-N,

TBARS,

K

R2p = 0.922 for TVB-N,

R2p = 0.867 for TBARS,

R2p = 0.936 for K

Cheng, et al. [44]

Fish

MSI

A ‘standard freshness index’ of K

R2 = 0.94,

Omwange, et al. [45]

Fish

Fluorescence spectroscopy

A ‘standard freshness index’ of K

R2 = 0.92

Omwange, et al. [46]

Fish

Fluorescence spectroscopy

A ‘standard freshness index’ of K

R2 = 0.95

Liao, et al. [47]

Fish

Fluorescence spectroscopy

AEC;

NADH

R2 = 0.90 for AEC,

R2 = 0.85 for NADH

Rahman, et al. [48]

Fish

Fluorescence spectroscopy

NADH

90.5%

Hassoun and Karoui [49]

Fish

RGB imaging

Classification performance

99.5%

Park, et al. [50]

Fish

RGB imaging

Astaxanthin concentration

R2 = 0.66

Dissing et al. [43]

Fish

RGB imaging

Freshness of tuna meat cuts

86.67%

Lugatiman, et al. [51]

Fish

RGB imaging

The main color of the sample

75%

Mateo, et al. [52]

Fish

RGB imaging

Texture features

86.3%

Gu, et al. [53]

Fish

RGB imaging

Color of Salmon Fillets

R = 0.95

Quevedo, et al. [54]

Fish

RGB imaging

Gill and eye color changes in the sparus aurata

R2 = 0.994

Dowlati, et al. [55]

Fish

RGB imaging

Body color of carp

94.97%

Taheri-Garavand, et al. [56]

Fish

RGB imaging

Freshness

98.2%

Rocculi, et al. [57]

Shrimp

Fluorescence spectroscopy

4-hexylresorcinol

81.6%

Jonker and Dekker [58]

Shrimp

Fluorescence spectroscopy

K, pH

R2 = 0.80

Rahman, et al. [59]

Shrimp

RGB imaging

pH

100%

Witjaksono, et al. [60]

Shrimp

RGB imaging

Identification accuracy of the proposed ShrimpNet for shrimp

95.48%

Hu, et al. [61]

Shrimp

RGB imaging

Shrimp dehydration levels

R = 0.86

Mohebbi, et al. [62]

Shrimp

RGB imaging

Color changes in the head, legs and tail of pacific white shrimp (litopenaeus vannamei)

90%

Ghasemi-Varnamkhasti, et al. [63]

Chicken

Fluorescence spectroscopy

Hydroxyproline concentration

R2 = 0.82

Monago-Maraña, et al. [64]

Chicken

MSI

Skin tumors

86%

Chao, et al. [65]

Chicken

MSI

TVC

90.4%

Spyrelli, et al. [66]

Chicken

MSI

pork-chicken adulteration

90.00% for fresh samples, 86.67% for frozen-thawed samples

Fengou, et al. [67]

Chicken

MSI

Sepsis in chickens

98.6% for septic chickens,

96.3% for healthy chickens

Yang, et al. [68]

Chicken

MSI

Contamination detection

96%

Park, et al. [69]

Chicken

MSI

Chicken heart disease characterization

100%

Chao, et al. [70]

Chicken

MSI;

Fluorescence spectroscopy

Contamination detection

92.5%

Seo, et al. [71]

Chicken

Fluorescence spectroscopy

Lipid oxidation

R = 0.73

Gatellier, et al. [72]

Chicken

Fluorescence spectroscopy

P. aeruginosa concentration

96%

Abdel-Salam, et al. [73]

Chicken

Fluorescence spectroscopy

chicken meat tenderness

R = 0.870

Yu, et al. [74]

Chicken

Fluorescence spectroscopy

Contamination detection

96.6%

Cho, et al. [75]

Chicken

Fluorescence spectroscopy

Measurement of lipid oxidation

98%

Wold and Kvaal [76]

Chicken

RGB imaging

Avian flu infected chickens

97.43%

Cuan, et al. [77]

Chicken

RGB im-aging

Color

94%

Yumono, et al. [78]

Chicken

RGB im-aging

Freshness

R = 0.987

Taheri-Garavand, et al. [79]

Duck

Fluorescence spectroscopy

Gentamicin Residual in Duck Meat

R = 0.996

Wang, et al. [80]

Duck

Fluorescence spectroscopy

Doxycycline content in duck meat

R = 0.998

Wang, et al. [81]

Duck

Fluorescence spectroscopy

Carbaryl residue in duck meat

R = 0.976

Xiao et al. [10]

Duck

Fluorescence spectroscopy

Tetracycline content

R = 0.952

Zhao, et al. [82]

Duck

Fluorescence spectroscopy

Triazophos content

R2p =  0.974,

Zhao, et al. [83]

Duck

Fluorescence spectroscopy

Neomycin residue

R = 0.999

Jiang, et al. [84]

Duck

Fluorescence spectroscopy

Carbofuran residue

R2p =  0.999

XIAO, et al. [85]

TVB-N––total volatile basic nitrogen; PPC—Psycho-trophic Plate Count; TVC—total viable count; LDA—Linear Discriminant Analysis; MD—Mahalanobis distance; PCA—Principal component analysis; m—mean; TBARS—Thio-barbituric acid reactive substances; AEC—adenylate energy charge; NAD and NADH—nicotinamide adenine dinucleotide; CFU—colony-forming units; TBARS—thio-barbituric acid reactive substances.

This entry is adapted from the peer-reviewed paper 10.3390/bios12020076

This entry is offline, you can click here to edit this entry!
Video Production Service