This work aims to determine the orthotropic linear elastic constitutive parameters of Pinus pinaster Ait. wood from a single uniaxial compressive experimental test, under quasi-static loading conditions, based on two different specimen configurations: (a) on-axis rectangular specimens oriented on the radial-tangential plane, (b) off-axis specimens with a grain angle of about 60° (radial-tangential plane). Using digital image correlation (DIC), full-field displacement and strain maps are obtained and used to identify the four orthotropic elastic parameters using the finite element model updating (FEMU) technique. Based on the FE data, a synthetic image reconstruction approach is proposed by coupling the inverse identification method with synthetically deformed images, which are then processed by DIC and compared with the experimental results. The proposed methodology is first validated by employing a DIC-levelled FEA reference in the identification procedure. The impact of the DIC setting parameters on the identification results is systematically investigated. This influence appears to be stronger when the parameter is less sensitive to the experimental setup used. When using on-axis specimen configuration, three orthotropic parameters of Pinus pinaster (modulus of elasticity on the radial and tangential directions and Poisson's ratio on the radial-tangential plane) are correctly identified, while the shear modulus on the radial-tangential plane is robustly identified when using off-axis specimen configuration.
- wood
- inverse identification
- full-field measurements
- DIC
- synthetic images
- FEMU
- orthotropic elasticity
- compression tests
1. Introduction
Engineering materials based on renewable and recyclable natural resources are regaining momentum towards policies and practices of sustainable green economy. Wood and wood-based products are an important class of these materials, with a long-term increase in demand worldwide [1]. Wood is a complex, heterogeneous, and hierarchical biological material. Therefore, it is quite complex to mathematically describe or characterise from both numerical and experimental points of view. At the macroscropic scale, where the concept of clear wood is introduced, a mechanical model based on an anisotropic behaviour is typically accepted, assuming three orthotropic material directions: the longitudinal direction (L) along the tracheids, the radial direction (R) parallel to the rays, and the tangential direction (T) to the annual growth rings [2]. However, several degrees of heterogeneities exist. On the one hand, locally, in earlywood (EW) and latewood (LW) cellular tissues, different physical and mechanical properties can be identified at the growth ring scale [3][4]. On the other hand, globally, radial and longitudinal spatial gradients can be observed at the structural (stem) scale [5][6]. The use of wood and wood-based products for structural applications implies the understanding of the material behaviour under mechanical loadings. Although the use of finite element analysis (FEA) to simulate processes is well established, the calibration of material constitutive models is still a bottleneck in terms of feasibility.
Recent advances in digital imaging technology have enabled the development of novel optical techniques in solid and fluid experimental mechanics [7][8][9]. These techniques are being increasingly used in diverse applications since these are contact-free and provide full-field measurements. Among these techniques, digital image correlation (DIC) [10][11][12][13][14][15][16][17] and the grid method [18][19][20] have been exponentially used in the recent past due to their simplicity and good balance between spatial resolution and accuracy. The 2D-DIC subset-based correlation technique is highlighted and is used in this work. In this technique, the DIC setting parameters can significantly impact the measured strain fields and the absolute error of measurements [2][21][22], and therefore directly influence the identification of material constitutive parameters [23].
The development of full-field measurement techniques has allowed a new insight in the experimental characterisation. These techniques have the potential to reduce the number of experimental tests required to fully characterise a material, given that a heterogeneous test configuration is used, producing heterogeneous stress and strain fields in the specimen so that all material properties take a role in the mechanical behaviour. Furthermore, it is appropriate for addressing current open issues on the identification of mechanical properties for heterogeneous materials, such as the spatial variability of mechanical properties over the region of interest (ROI), in materials such as wood or composites [2]. To take advantage of full-field measurements, several inverse identification approaches have been proposed [24], i.e., the equilibrium gap method [25], the constitutive equation gap method [26], the finite element model updating method (FEMU) [27][28][29] and the virtual fields method (VFM) [30][31][32][33].
The experimental validation of FEA is critical to develop the credibility in numerical model predictions for engineering design. Traditionally, the data from experimental DIC measurements and FEA would be directly compared. However, the experimental characterisation is evolving to a new paradigm [34]. The direct comparison between the numerical and experimental DIC data can lead to differences being falsely associated with model inaccuracies. This can be due to different aspects, such as the different filtering of regions of high strain gradients, differences in data locations and strain formulations, or different spatial cut-off frequencies [35]. Recently, the photomechanical experimental community is focusing on an alternative approach to compare the differences between the full-field maps from the experimental DIC and the numerical results. This alternative approach involves using the numerical results, such as the FEA displacements and the mesh data, to synthetically deform an experimental image of the specimen with the speckle pattern [36]. The FEA-based synthetic image can then be processed using DIC with the same setting parameters used for the experimental measurements.
2. Materials and Methods
The FEMU-based material parameter identification process is illustrated in Figure 1. The DIC technique is used to obtain full-field experimental measurements, which are then compared to DIC-levelled FEA results. The DIC settings are chosen by performing a parametric analysis of various sets of settings. The DIC-based experimental boundary conditions (BC) are used in the FE model. The DIC-levelled FEA results are iteratively generated by updating the material parameters set through an optimisation algorithm to minimise the discrepancies between the experimental observations and the virtual experiment results until convergence is achieved.
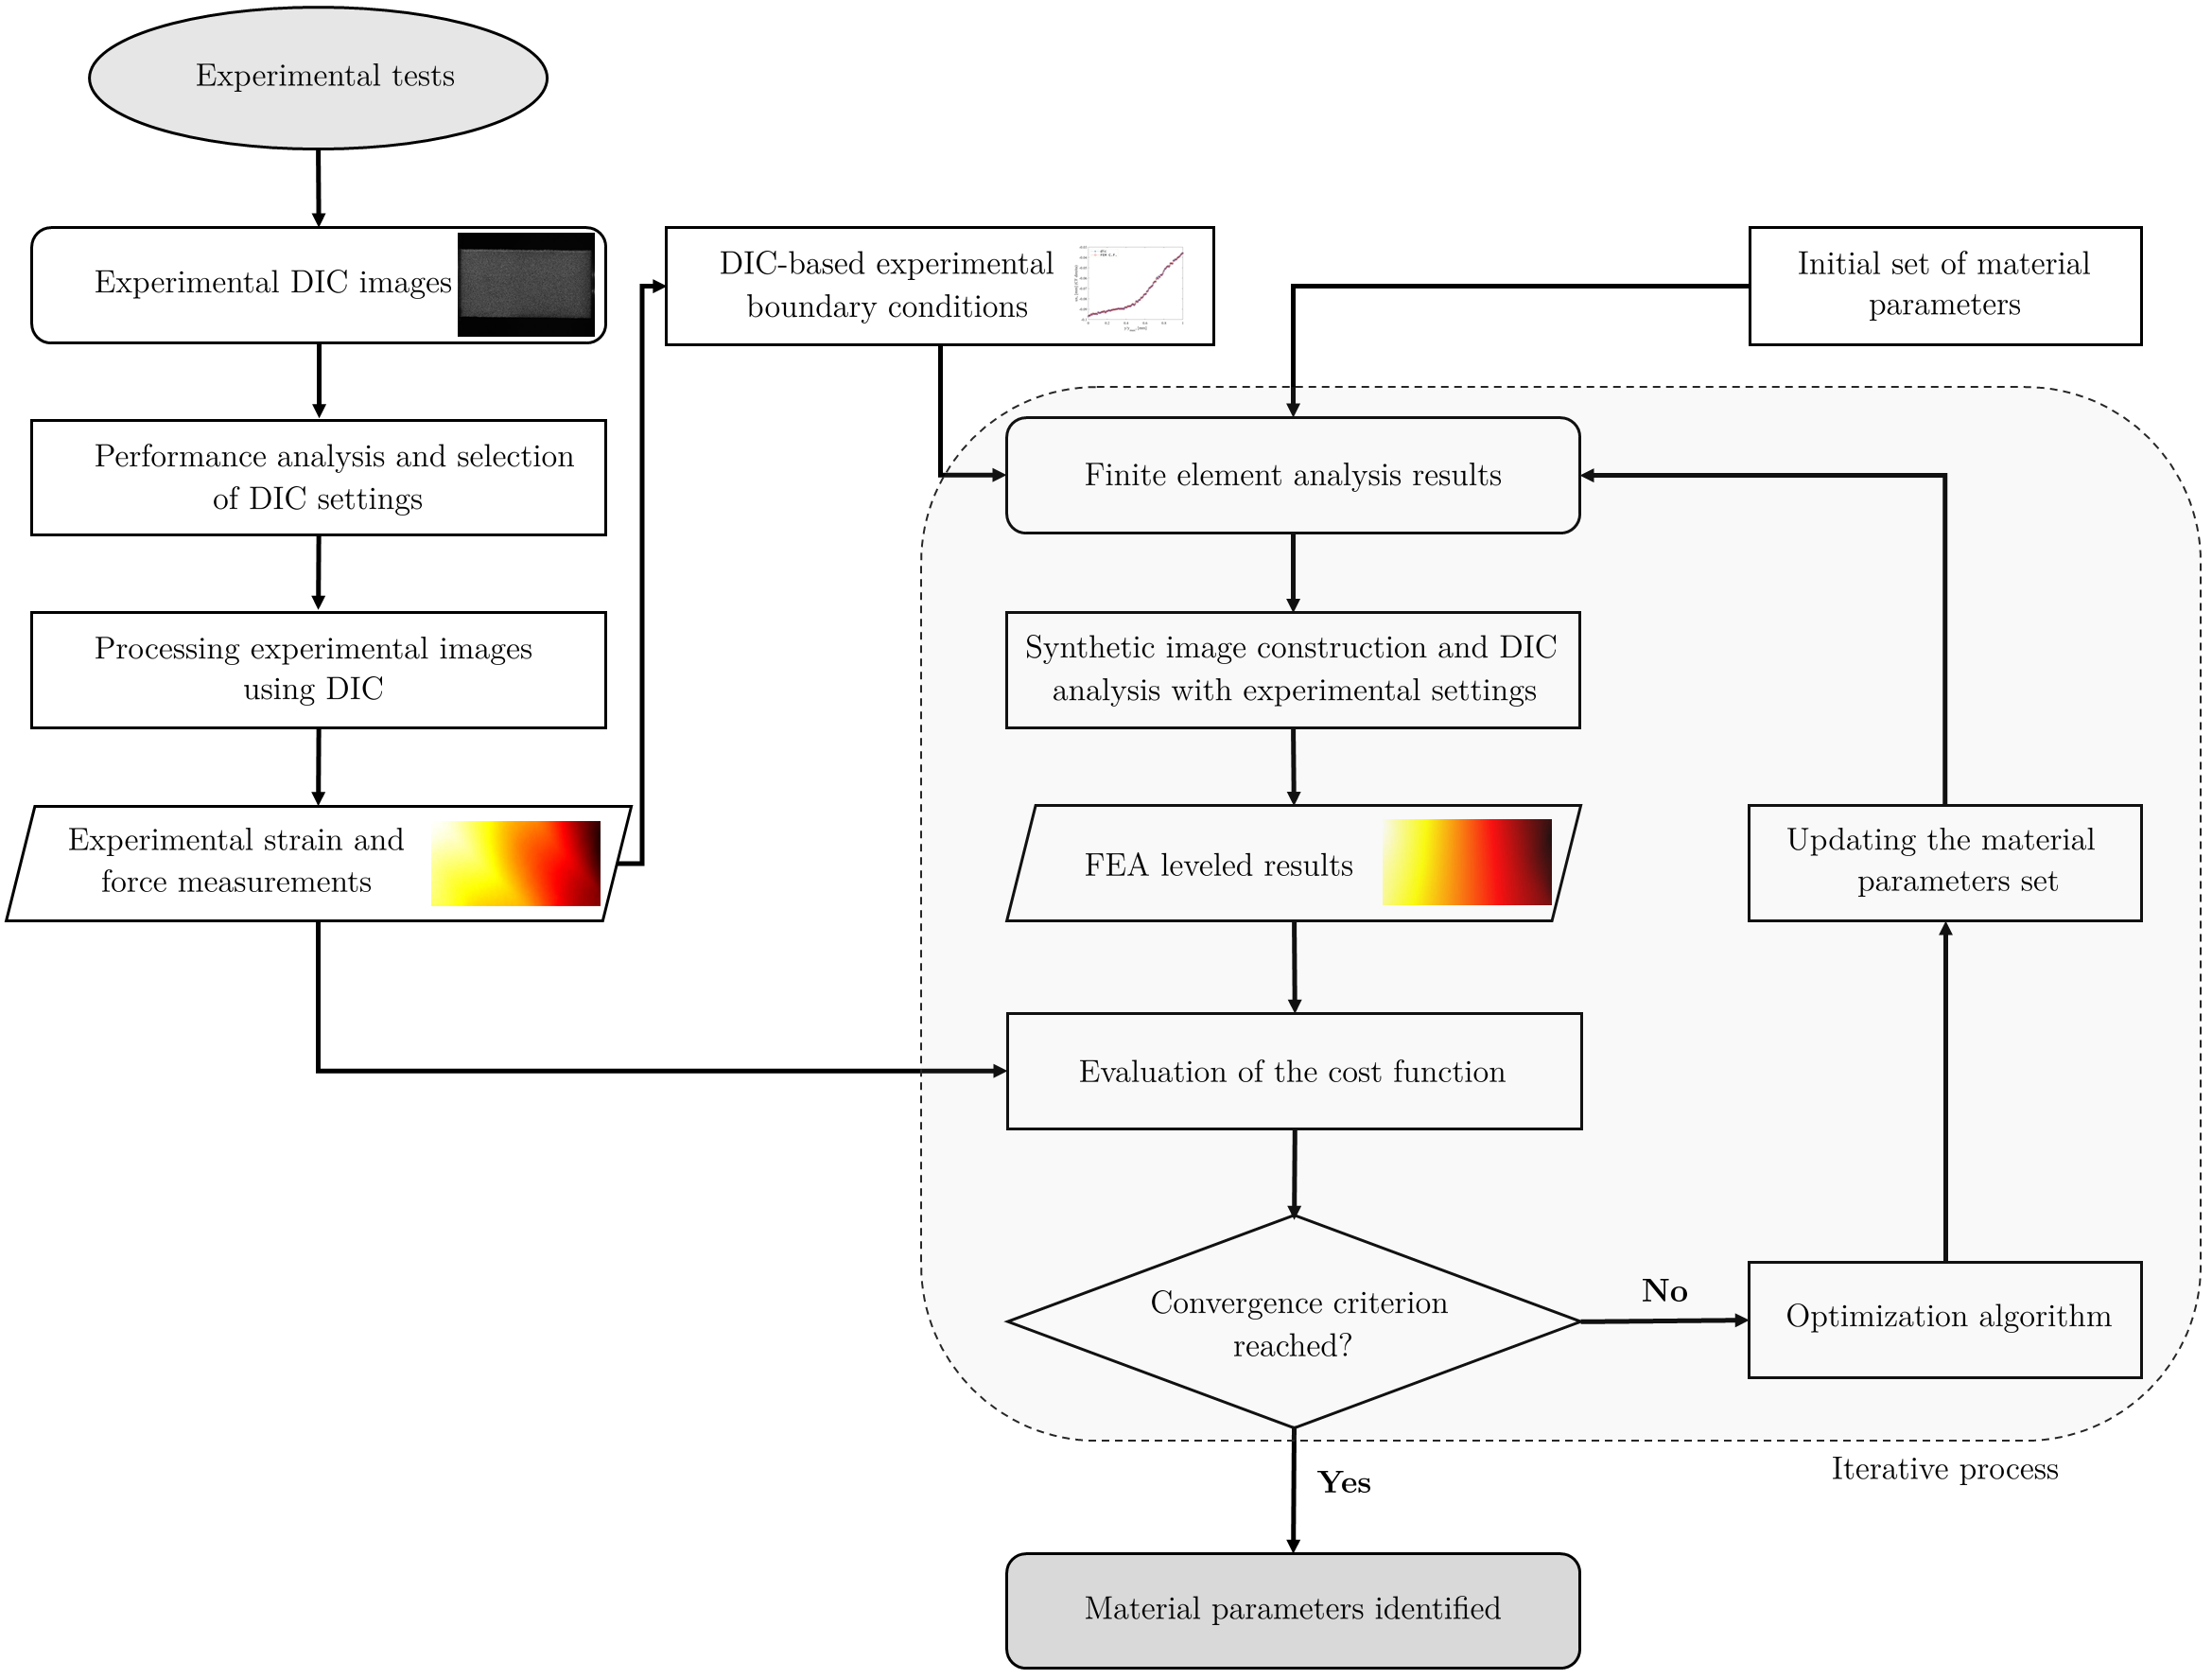
Figure 1. Flow diagram describing the material parameters identification process using FEMU.
2.1. Raw Material and Specimen
Clear wood specimens were cut from a single Pinus pinaster tree. A radial board was selected and air-dried to a moisture content of about 12%. Wood samples were then manufactured considering the radial-tangential (RT) orthotropic orientation with nominal dimensions of 20(R) × 10(T) × 4(L) mm3. A total of 9 on-axis and 9 off-axis specimens were manufactured in order to compare or enhance the identifiability of the inverse material parameter identification.
2.2. Compression Tests and Full-Field Measurements
A universal Instron 5848 MicroTester machine (Instron, Barcelona, Spain) was used to carry out the compression tests, with displacement control at a cross-head velocity of 0.5 mm/min. A 2 kN load cell was used to measure the resultant uniaxial load.
Image focusing over the target pattern surface was adjusted accordingly for stable measurements during the test. The camera-lens optical system consisted of a Baumer Optronic FWX20 camera (Baumer Optronic GmbH, Radeberg, Germany) coupled with an AF Micro-Nikkor 200 mm f/4D ED-IF lens (Nikon, Portugal). The image field of view covered an area integrating several annual growth rings. The speckle pattern was created by means of an airbrush painting with a 0.18-mm nozzle (IWATA, model CM-B, Anesta Iwata Iberica SL, Barcelona, Spain).
2.3. Digital Image Correlation: Parametric Analysis
In this work, the MatchID subset-based DIC 2D software (Ghent, Belgium [37]) was used to reconstruct the displacements and strain fields. The selection of the DIC setting parameters is critical as it influences the measurements and identification results [2]. The selection of the DIC settings was carried out with the support of the performance analysis module within MatchID [37]. This tool allows performing a large set of DIC analysis by covering a spectrum of different setting combinations at once. This analysis was systematically performed on both on-axis and off-axis specimens since the off-axis angle orientation will generate a different mechanical response under the same uniaxial compressive loading. A total of 1800 analyses (900 for each specimen configuration) were performed.
The sets of different DIC settings tested correspond to a virtual strain gauge (VSG) range between 23 and 211 pixels, or approximately 0.3 to 2.79 mm. The convergence study performed for the on- axis and off-axis specimens is summarized in Figures 2 and 3, respectively, by comparing the signal measured of the strain component on the radial direction (εR) for the on-axis specimen and on the x direction (εxx) for the off-axis specimen, with the VSG size at four different points: (a) two earlywood points and (b) two latewood points.
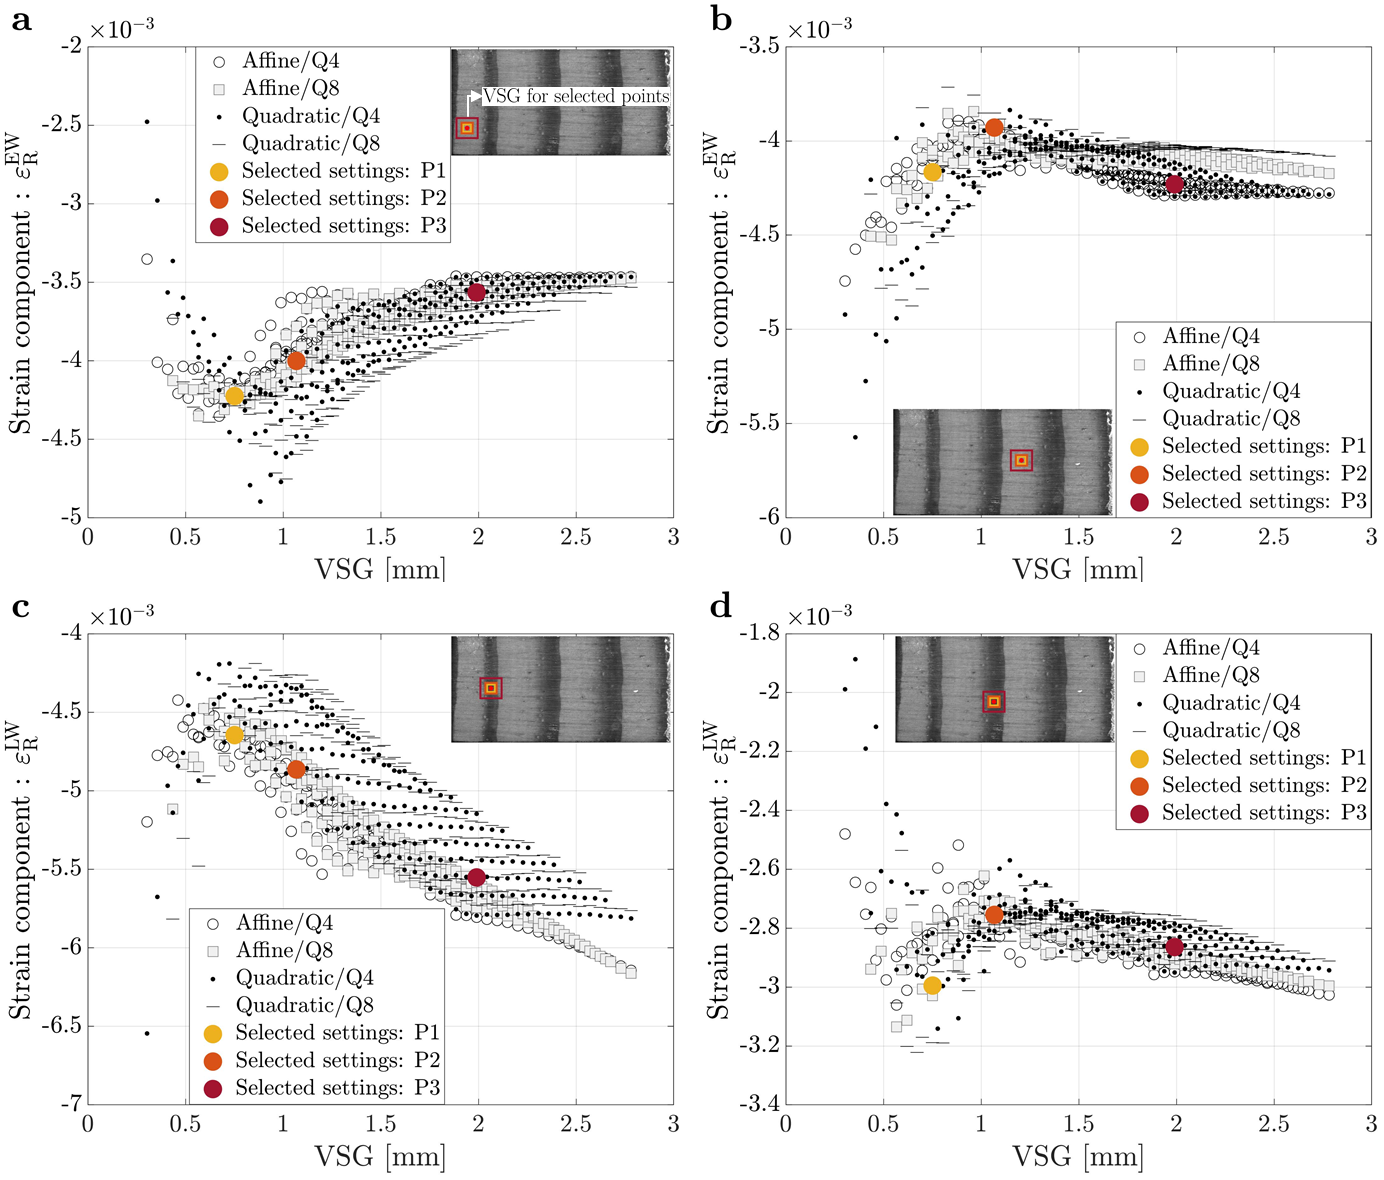 Figure 2. Signal versus virtual strain gauge for an on-axis specimen for different points from the ROI: (a) Small earlywood (EW) tissue; (b) Large earlywood (EW) tissue; (c) Small latewood (LW) tissue and (d) Large latewood (LW) tissue.
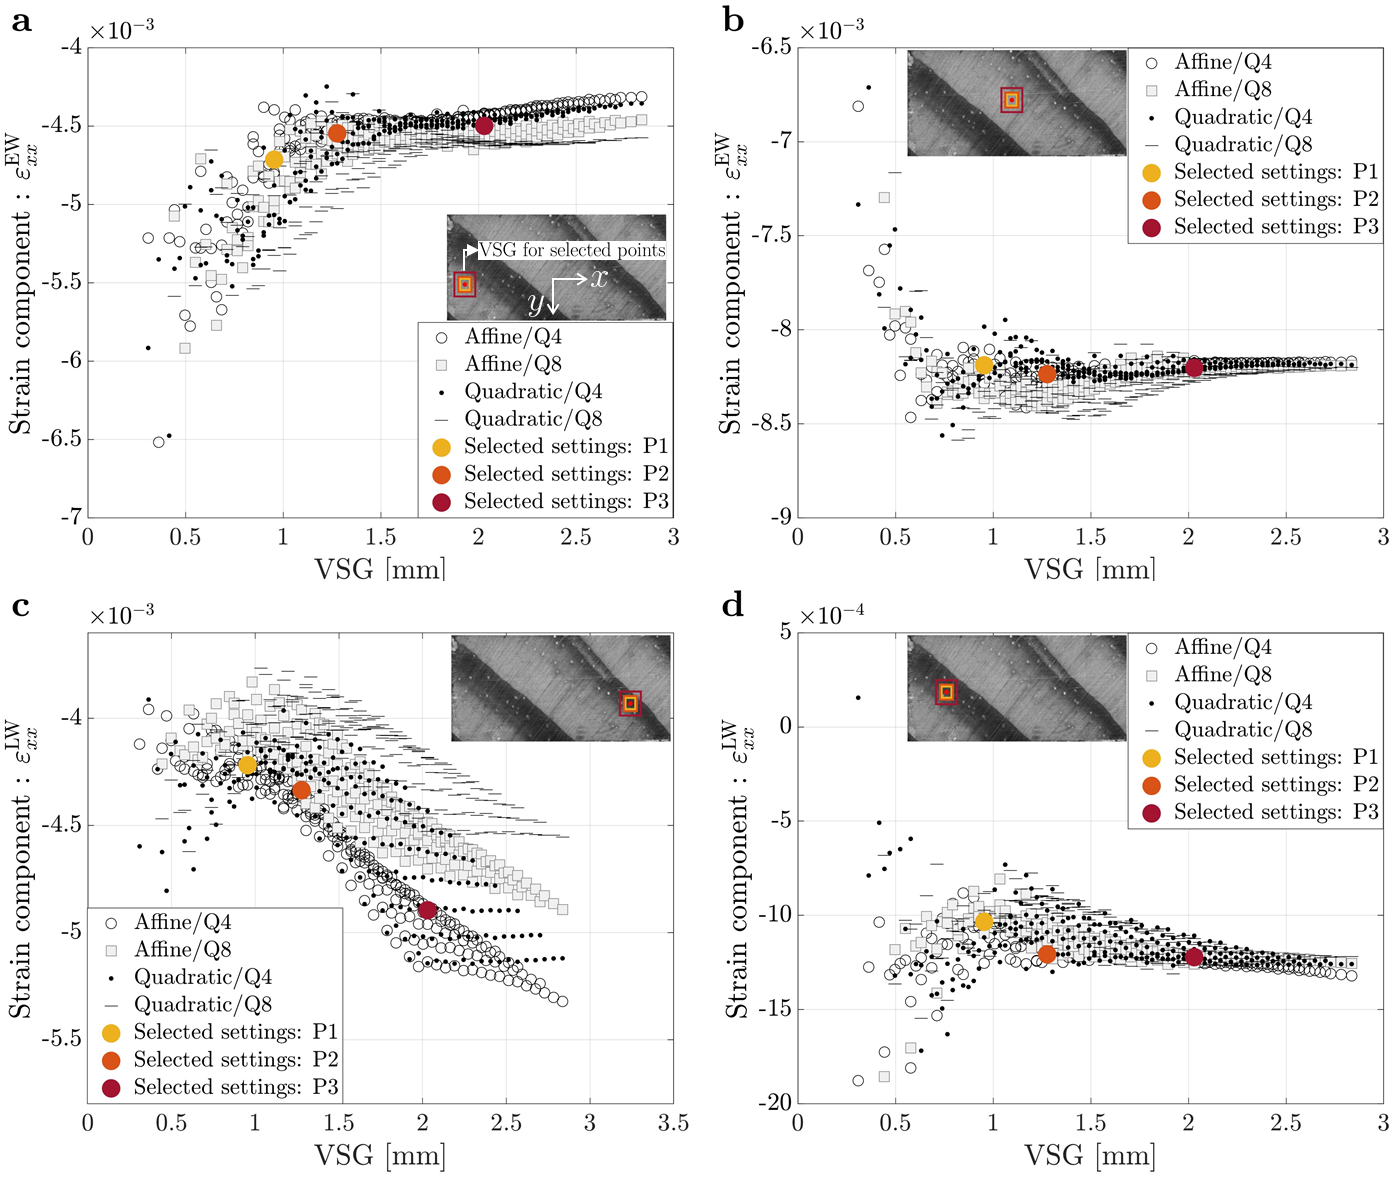
Figure 3. Signal versus virtual strain gauge for an off-axis specimen for different points from the ROI: (a) Small earlywood (EW) tissue; (b) Large earlywood (EW) tissue; (c) Small latewood (LW) tissue and (d) Large latewood (LW) tissue.
When looking at the effect of VSG on strain signal reconstruction in latewood tissue, bigger values of VSG appear to lead to a higher strain signal reconstruction, in magnitude, due to the earlywood tissue influence, which is less stiff and deforms more at the same stress value. However, in some results of this parametric analysis, it is also possible to observe that the measured strain signal does not have a significant variation when the VSG increases. This is due to the VSG not being large enough to capture the transition between the earlywood and latewood tissues, which can also be confirmed by the VSG size representations found in Figures 2 and 3.
For this work, three different sets of DIC parameters were selected (P1, P2 and P3) for the on-axis and off-axis specimens to study the influence of spatial resolution and accuracy on the material parameters identification results, which are also represented as differently coloured dots in Figures 2 and 3. The different DIC settings were selected according to different trade-offs between accuracy and spatial resolution. Table 1 lists the 2D-DIC parameters used in this work for the on-axis and off-axis specimens, concerning the three different sets of settings chosen.
| 2D-DIC setting parameters | On-axis Specimens | Off-axis Specimens |
| Camera | Baumer Optronic FWX20 | |
| Field of view | 21.5 × 16.5 mm2 | |
| Image conversion factor | 0.0132 mm/px | |
| Working distance | 721 mm | |
| Image aquisition frequency | 1 Hz | |
| Average speckle size | 2.69 px/0.036 mm | 4 px/0.053 mm |
| Subset size | 17 px (P1), 21 px (P2), 41 px (P3) | 21 px (P1), 25 px (P2), 41 px (P3) |
| Step size | 5 px | |
| Strain window size | 9 (P1), 13 (P2), 23 (P3) | 11 (P1), 15 (P2), 23 (P3) |
| Strain convention | Green-Lagrange | |
2.4. Finite Element Model and Synthetic Images
A FE model was implemented in ANSYS Mechanical APDL software (Pennsylvania, Canonsburg, United States of America [38]) using DIC-based experimental boundary conditions on the left and right boundaries of the region of interest (ROI), interpolated between the DIC and FEA meshes. Wood was modelled as a homogeneous orthotropic linear elastic material.
According to Hooke’s Law, if a plane stress condition is applied to an orthotropic material, the relationship between stress and strain in the global coordinate system can be expressed by the following:
\begin{equation}\label{E:ConstitutiveModel2} \begin{bmatrix} \mathbf{\sigma}_{x}\\[10pt] \mathbf{\sigma}_{y}\\[10pt] \mathbf{\sigma}_{s} \end{bmatrix}=\begin{bmatrix} \displaystyle \frac{E_{x}}{1-\nu_{xy} \nu_{yx}} & \displaystyle \frac{-\nu_{yx}E_{x}}{1-\nu_{xy}\nu_{yx}} & 0\\[10pt] \displaystyle \frac{-\nu_{xy}E_{y}}{1-\nu_{xy}\nu_{yx}} & \displaystyle \frac{E_{y}}{1-\nu_{xy} \nu_{yx}} &0 \\[10pt] 0 & 0 & G_{xy} \end{bmatrix} \begin{bmatrix} {\varepsilon _{x}}\\[10pt] {\varepsilon _{y}}\\[10pt] {\varepsilon _{s}} \end{bmatrix}, \end{equation}
Therefore, the linear elastic orthotropic constitutive model has a total of four independent parameters to calibrate (Ex, Ey, νxy and Gxy). In the proposed FEMU approach, the main goal is to fit the FEA results with experimental data. However, before doing this comparison, numerous inconsistencies must be handled, including differing coordinate systems, data locations, strain formulations, spatial resolutions and data filtering. To solve these issues, it was proposed to synthetically deform the reference image of the DIC speckle pattern by means of coordinates and nodal displacements of the FE model, creating a set of deformed synthetic images for further evaluation by the DIC approach. The synthetically deformed image can then be processed using the same DIC settings as the experimental images, ensuring that both sets of data have the same filtering, spatial resolution, and strain formulation.
2.5. Finite Element Model Updating Technique
The FEMU is used to find the four orthotropic linear elastic parameters of wood. An optimisation approach is used to continuously update an unknown material parameter set in order to minimise a cost function that reflects the difference between experimental measurements and FEA results. The objective function (OF) used in this work can be represented by the following expression:
\begin{equation}\label{E:OF1} \varphi \left ( \mathbf{\chi} \right ) = \left ( 1-W_{\text{F}} \right ) IT_{\text{S}}^2 (\mathbf{\chi}) + W_{\text{F}} IT_{\text{F}}^2 (\mathbf{\chi}), \text{with} \quad 0\leqslant W_{\text{F}}\leqslant 1. \end{equation}
Where χ is a vector containing the four unknown material parameters and WF is a weighting coefficient between the strain (ITS) and force (ITF) terms. The strain term is characterized as follows:
\begin{equation}\label{E:ITS} IT_{\text{S}}(\mathbf{\chi}) = \frac{1}{3n} \left [ \sqrt{\sum_{k=1}^{n}\left ( \frac{\mathbf{\varepsilon}_{xx}^{\text{exp}}-\mathbf{\varepsilon}_{xx}^{\text{num}}(\mathbf{\chi})}{\varepsilon_{xx\text{,max}}^{\text{exp}}} \right )^2}^2 + \sqrt{\sum_{k=1}^{n}\left ( \frac{\mathbf{\varepsilon}_{yy}^{\text{exp}}-\mathbf{\varepsilon}_{yy}^{\text{num}}(\mathbf{\chi})}{\varepsilon_{yy\text{,max}}^{\text{exp}}} \right )^2}^2 + \sqrt{\sum_{k=1}^{n}\left ( \frac{\mathbf{\varepsilon}_{xy}^{\text{exp}}-\mathbf{\varepsilon}_{xy}^{\text{num}}(\mathbf{\chi})}{\varepsilon_{xy\text{,max}}^{\text{exp}}} \right )^2}^2 \right ], \end{equation}
where the variable n is the total number of full-field measurement data points, while εexp and εnum are the experimental and numerical strain fields, respectively, considering the different components of in-plane strain fields. The subscripts 'xx,max', 'yy,max' and 'xy,max' represent the maximum value of the experimental full-field strain measurements for each correspondent component. Moreover, the force term is defined as:
\begin{equation}\label{E:ITF} IT_{\text{F}} (\mathbf{\chi}) = \frac{F^{\text{exp}}-F^{\text{num}}(\mathbf{\chi})}{F^{\text{exp}}}. \end{equation}
Similarly, the variables Fexp and Fnum reflect the experimental and numerical loads for the selected stage, respectively.
To begin begin the iterative process of FEMU, a starting set of parameters χ (ER, ET, νRT, GRT) is given to the FEA. The numerical results are then used to generate a synthetic image, which is then processed through DIC with the same setting parameters as the experimental data, matching numerical data locations and experimental data points. The DIC-levelled FEA data are then used to evaluate the cost function and the iterative process continues, by means of an optimisation algorithm, which iteratively updates the material parameter set until a minimum of the cost function is reached.
3. Materials and Methods
3.1. Method Validation
The validation of the described methodology was carried out for the two specimen configurations (on-axis and off-axis specimens) by running a FEA with the experimental boundary conditions and the reference parameters for this wood species [2][39] (reference parameters: ER = 1912 MPa; ET = 1010 MPa; νRT = 0.586; GRT = 176 MPa). Then, using nodal displacements and mesh information from the FEA, a synthetic image was generated, which was processed by DIC using the P1 settings described in Table 1. These results were then used as the reference in the identification procedure. To evaluate the convergence to the known solution, the starting parameters given to the FE model at the start of the iterative process deviate from the reference parameters (starting parameters used: ER = 1298 MPa; ET = 548 MPa; νRT = 1; GRT = 211 MPa). Figure 4 shows the convergence study for all four material parameters identified during the identification process for both specimen configurations.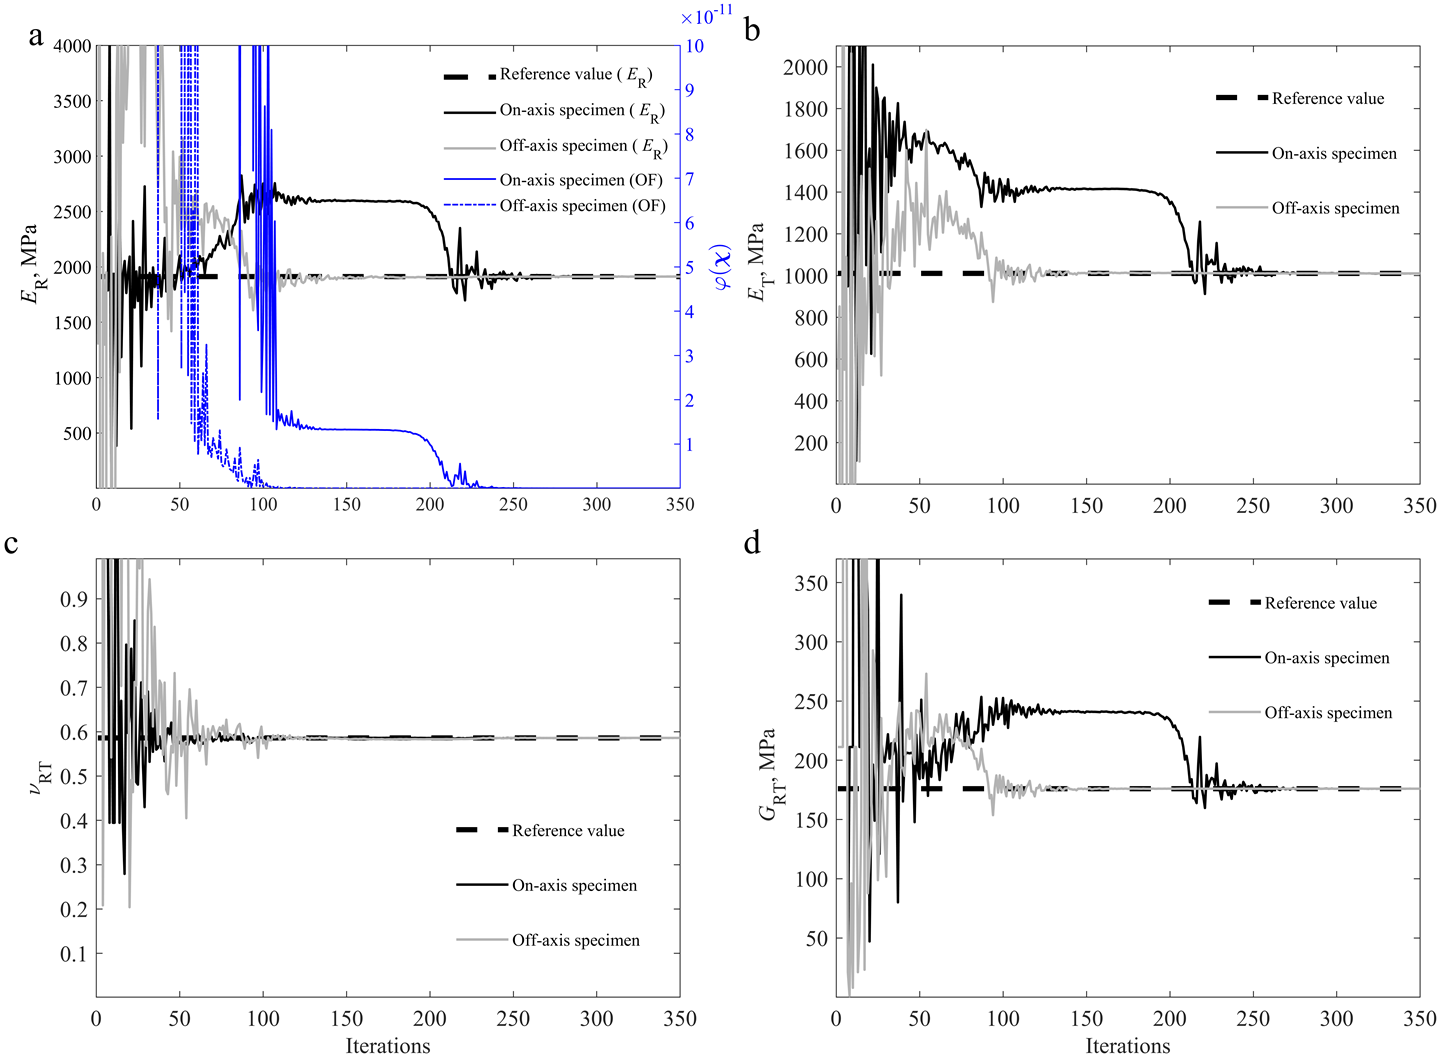 Figure 4. Convergence study for an on-axis specimen and off-axis specimen using a DIC-levelled FEA reference with reference parameters [2][39], regarding: (a) ER and OF value; (b) ET; (c) νRT; (d) GRT.
The results obtained validate the methodology applied since the inverse identification procedure was able to converge to the known solution, with errors of 0% for both specimen configurations.
3.2. Influence of the DIC Settings on the Identified Parameters
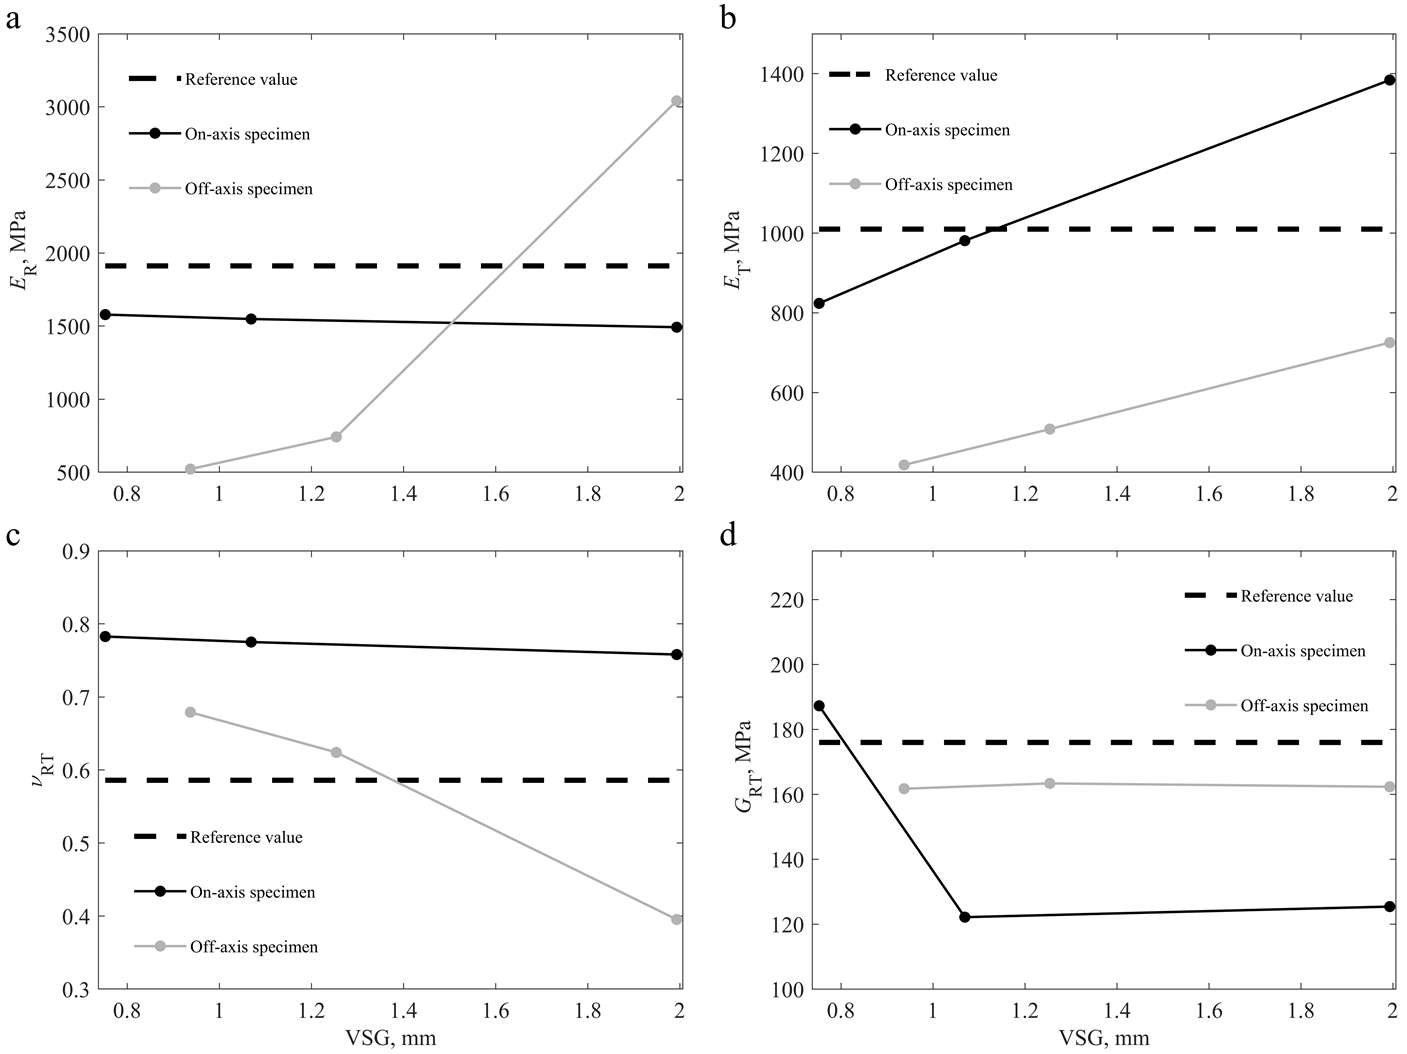 Figure 5. Results for the identification process for an on-axis and off-axis specimens using three different DIC settings (Table 1), and compared to the reference values [2][39], regarding the identified parameters: (a) ER; (b) ET; (c) νRT; (d) GRT.
On the on-axis specimen, the variation of the ER and νRT appears to be small as the VSG size increases. However, on the off-axis specimen, the variation for these parameters appears to be larger as the VSG size changes. On the other hand, the variation of GRT is lower on the off-axis specimen and higher on the on-axis specimen, whereas the ET varies almost linearly on both specimen configurations. Theoretically, the modulus of elasticity in the radial direction (ER) is the parameter with the most identifiability on the on-axis specimen, given the test configuration used. Similarly, the shear modulus of the RT plane (GRT) is, theoretically, the most identifiable parameter for the off-axis specimen. These results suggest that DIC settings have less impact on parameters with high identifiability.
The DIC settings influence the amount of smoothing introduced into the results, averaging the measurements in a given VSG. For the tested wooden specimens, the volume fraction of earlywood tissue was greater than latewood. It is noticed that the elastic properties of latewood are greater than that of earlywood. When the measurements are averaged, the results are expected to be influenced primarily by the material with the highest volume fraction. As a result, as the VSG size increases, the identified value for the ER for the on-axis specimen decreased, averaging out the results and resulting in the loss of strain gradients.
Wood is a natural material with a high degree of natural variability. Therefore, the experimental and identification procedures were carried out on a total of 18 specimens (9 on-axis specimens and 9 off-axis specimens), in order to conduct a statistical analysis of the identification results. For the remainder of this work, the P1 DIC settings from Table 1 were used, since these settings allow for the measurement of strain gradients, which is especially important when identifying constitutive parameters of heterogeneous materials.
3.3. Convergence Study for Identified Parameters
From Figures 6 and 7, it can be seen that the identification of the parameters of specimens 4 and 14 proved to be more time-consuming in terms of computational time, requiring close to 1200 (specimen 4) and 1000 (specimen 14) iterations to reach the minimum and for the process to stagnate. It is also worth noting that the ER was the overall most stable parameter throughout the identification process, whereas the GRT was the most stable parameter for the off-axis specimens.
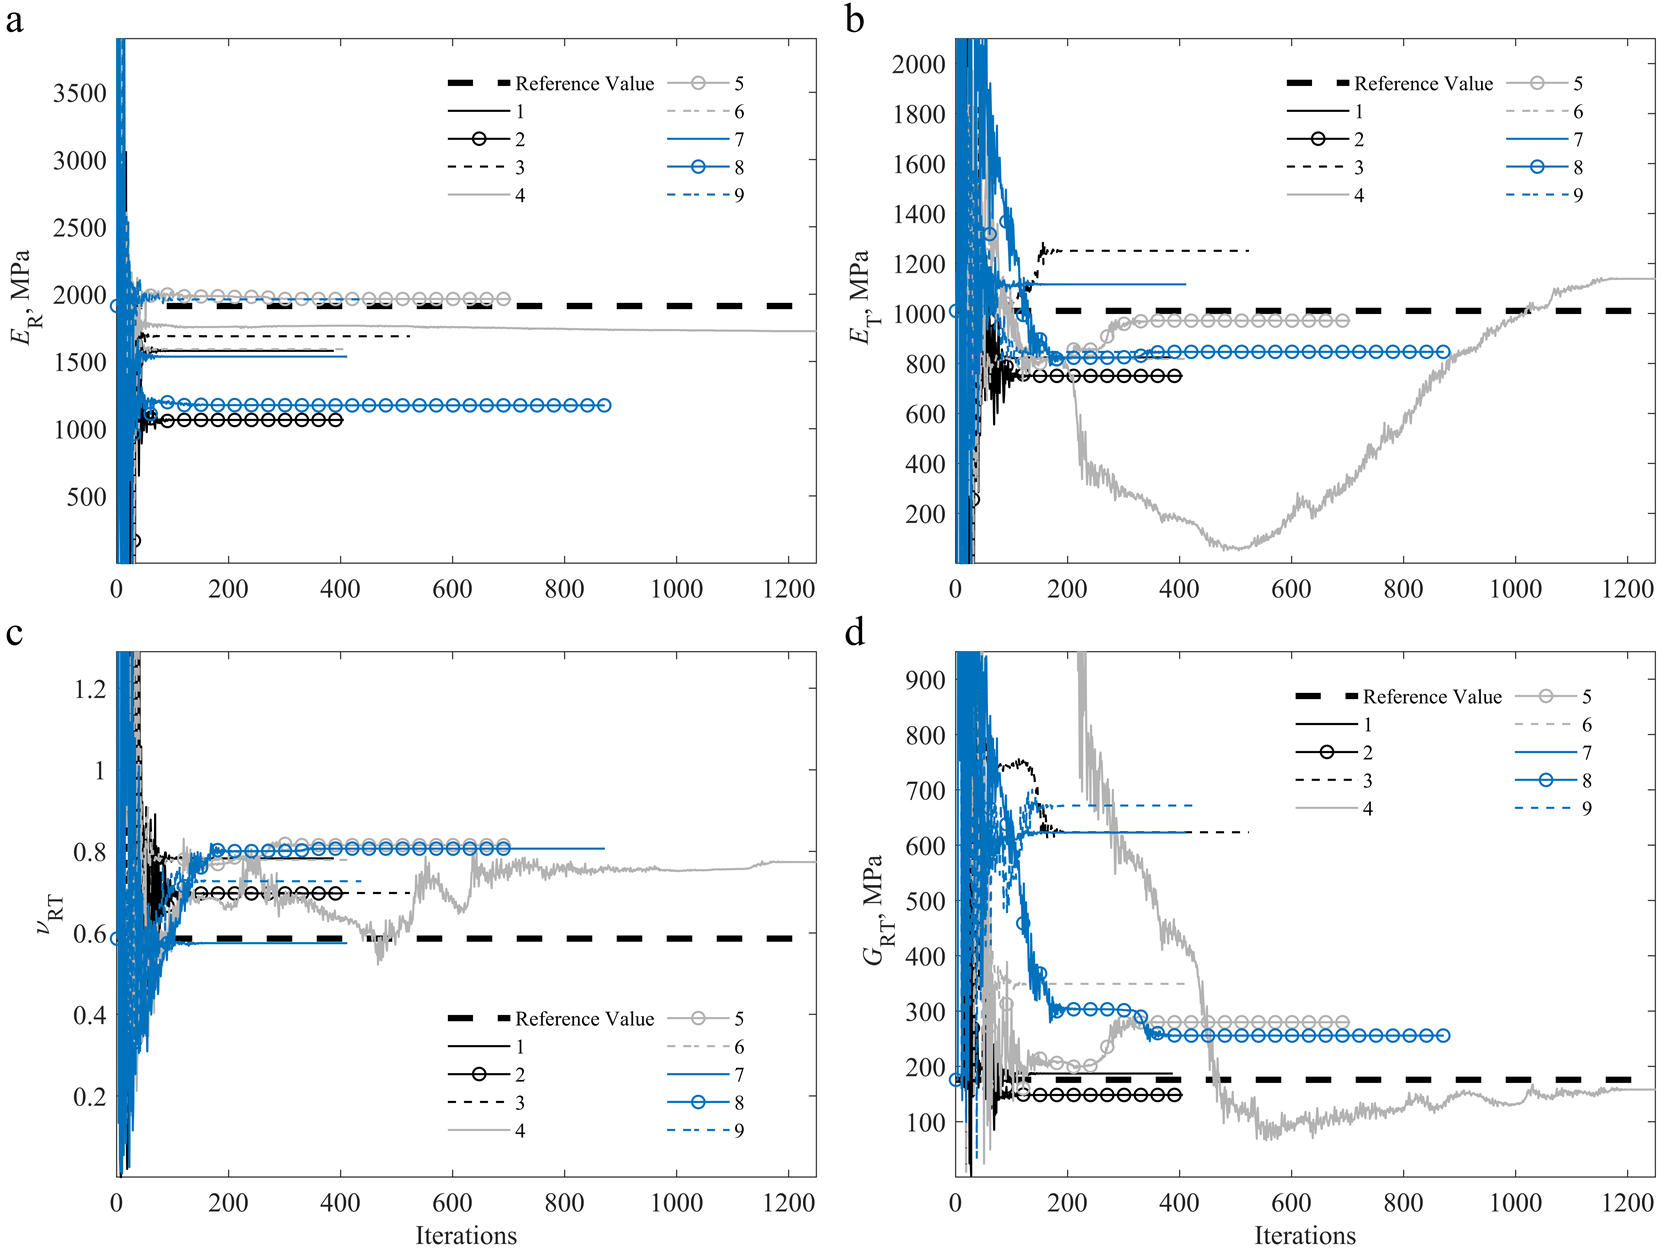 Figure 6. Convergence of the identified parameters for the on-axis (1–9) specimens during the iterative procedure, compared to the reference values [2][39]: (a) ER; (b) ET; (c) νRT; (d) GRT.
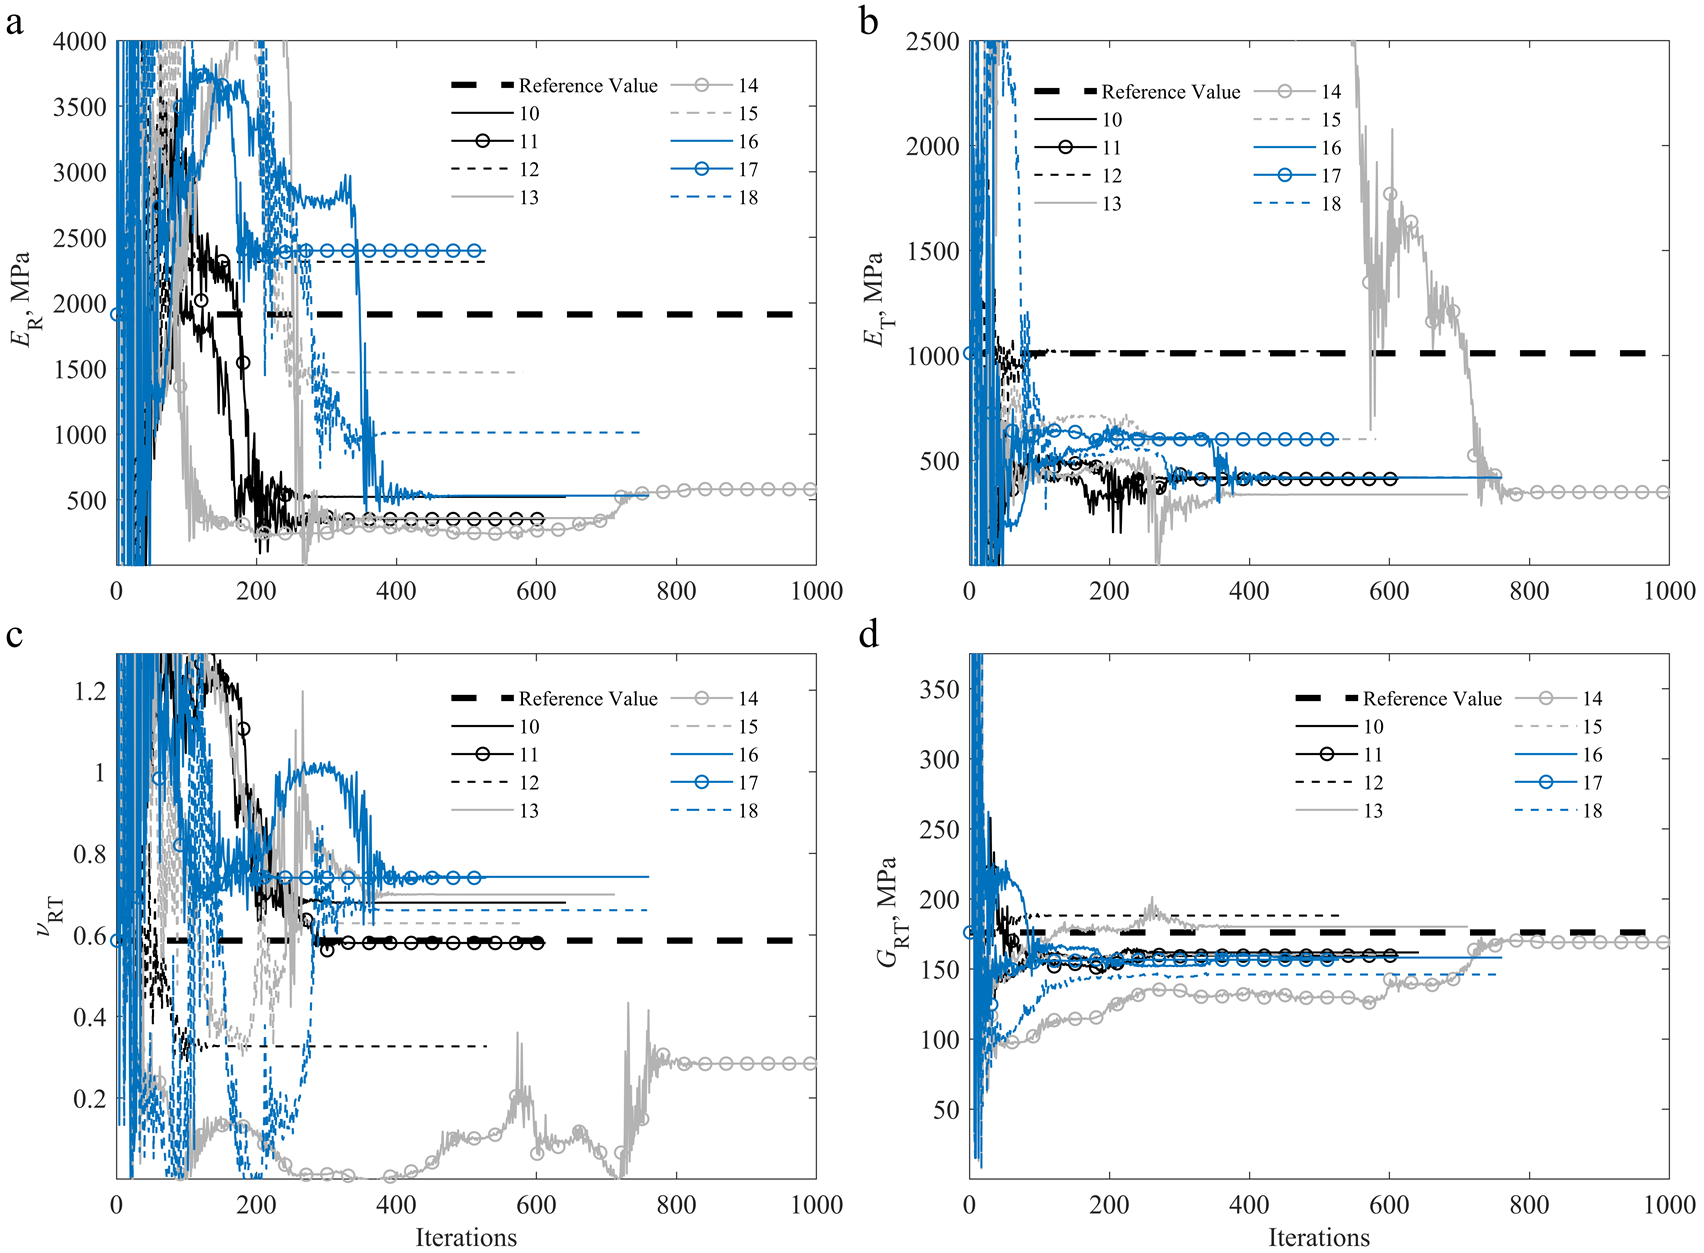 Figure 7. Convergence of the identified parameters for the off-axis (10–18) specimens during the iterative procedure, compared to the reference values [2][39]: (a) ER; (b) ET; (c) νRT; (d) GRT.
3.4. Experimental and Numerical Full-Field Strain Maps
Figure 8 shows the experimental DIC strain fields in comparison to the final calibrated numerical strain fields for both on-axis and off-axis specimens. Moreover, the residual differences between numerical and experimental strain fields, normalized by the maximum value of strain of each correspondent component, are also plotted. The residual maps show a systematic pattern related to the fact that the finite element model was built under the assumption of a homogeneous material, while experimentally, at the scale of observation, the annual rings morphology generate a heterogeneous strain map due to local stiffness difference between the wood meso layers.
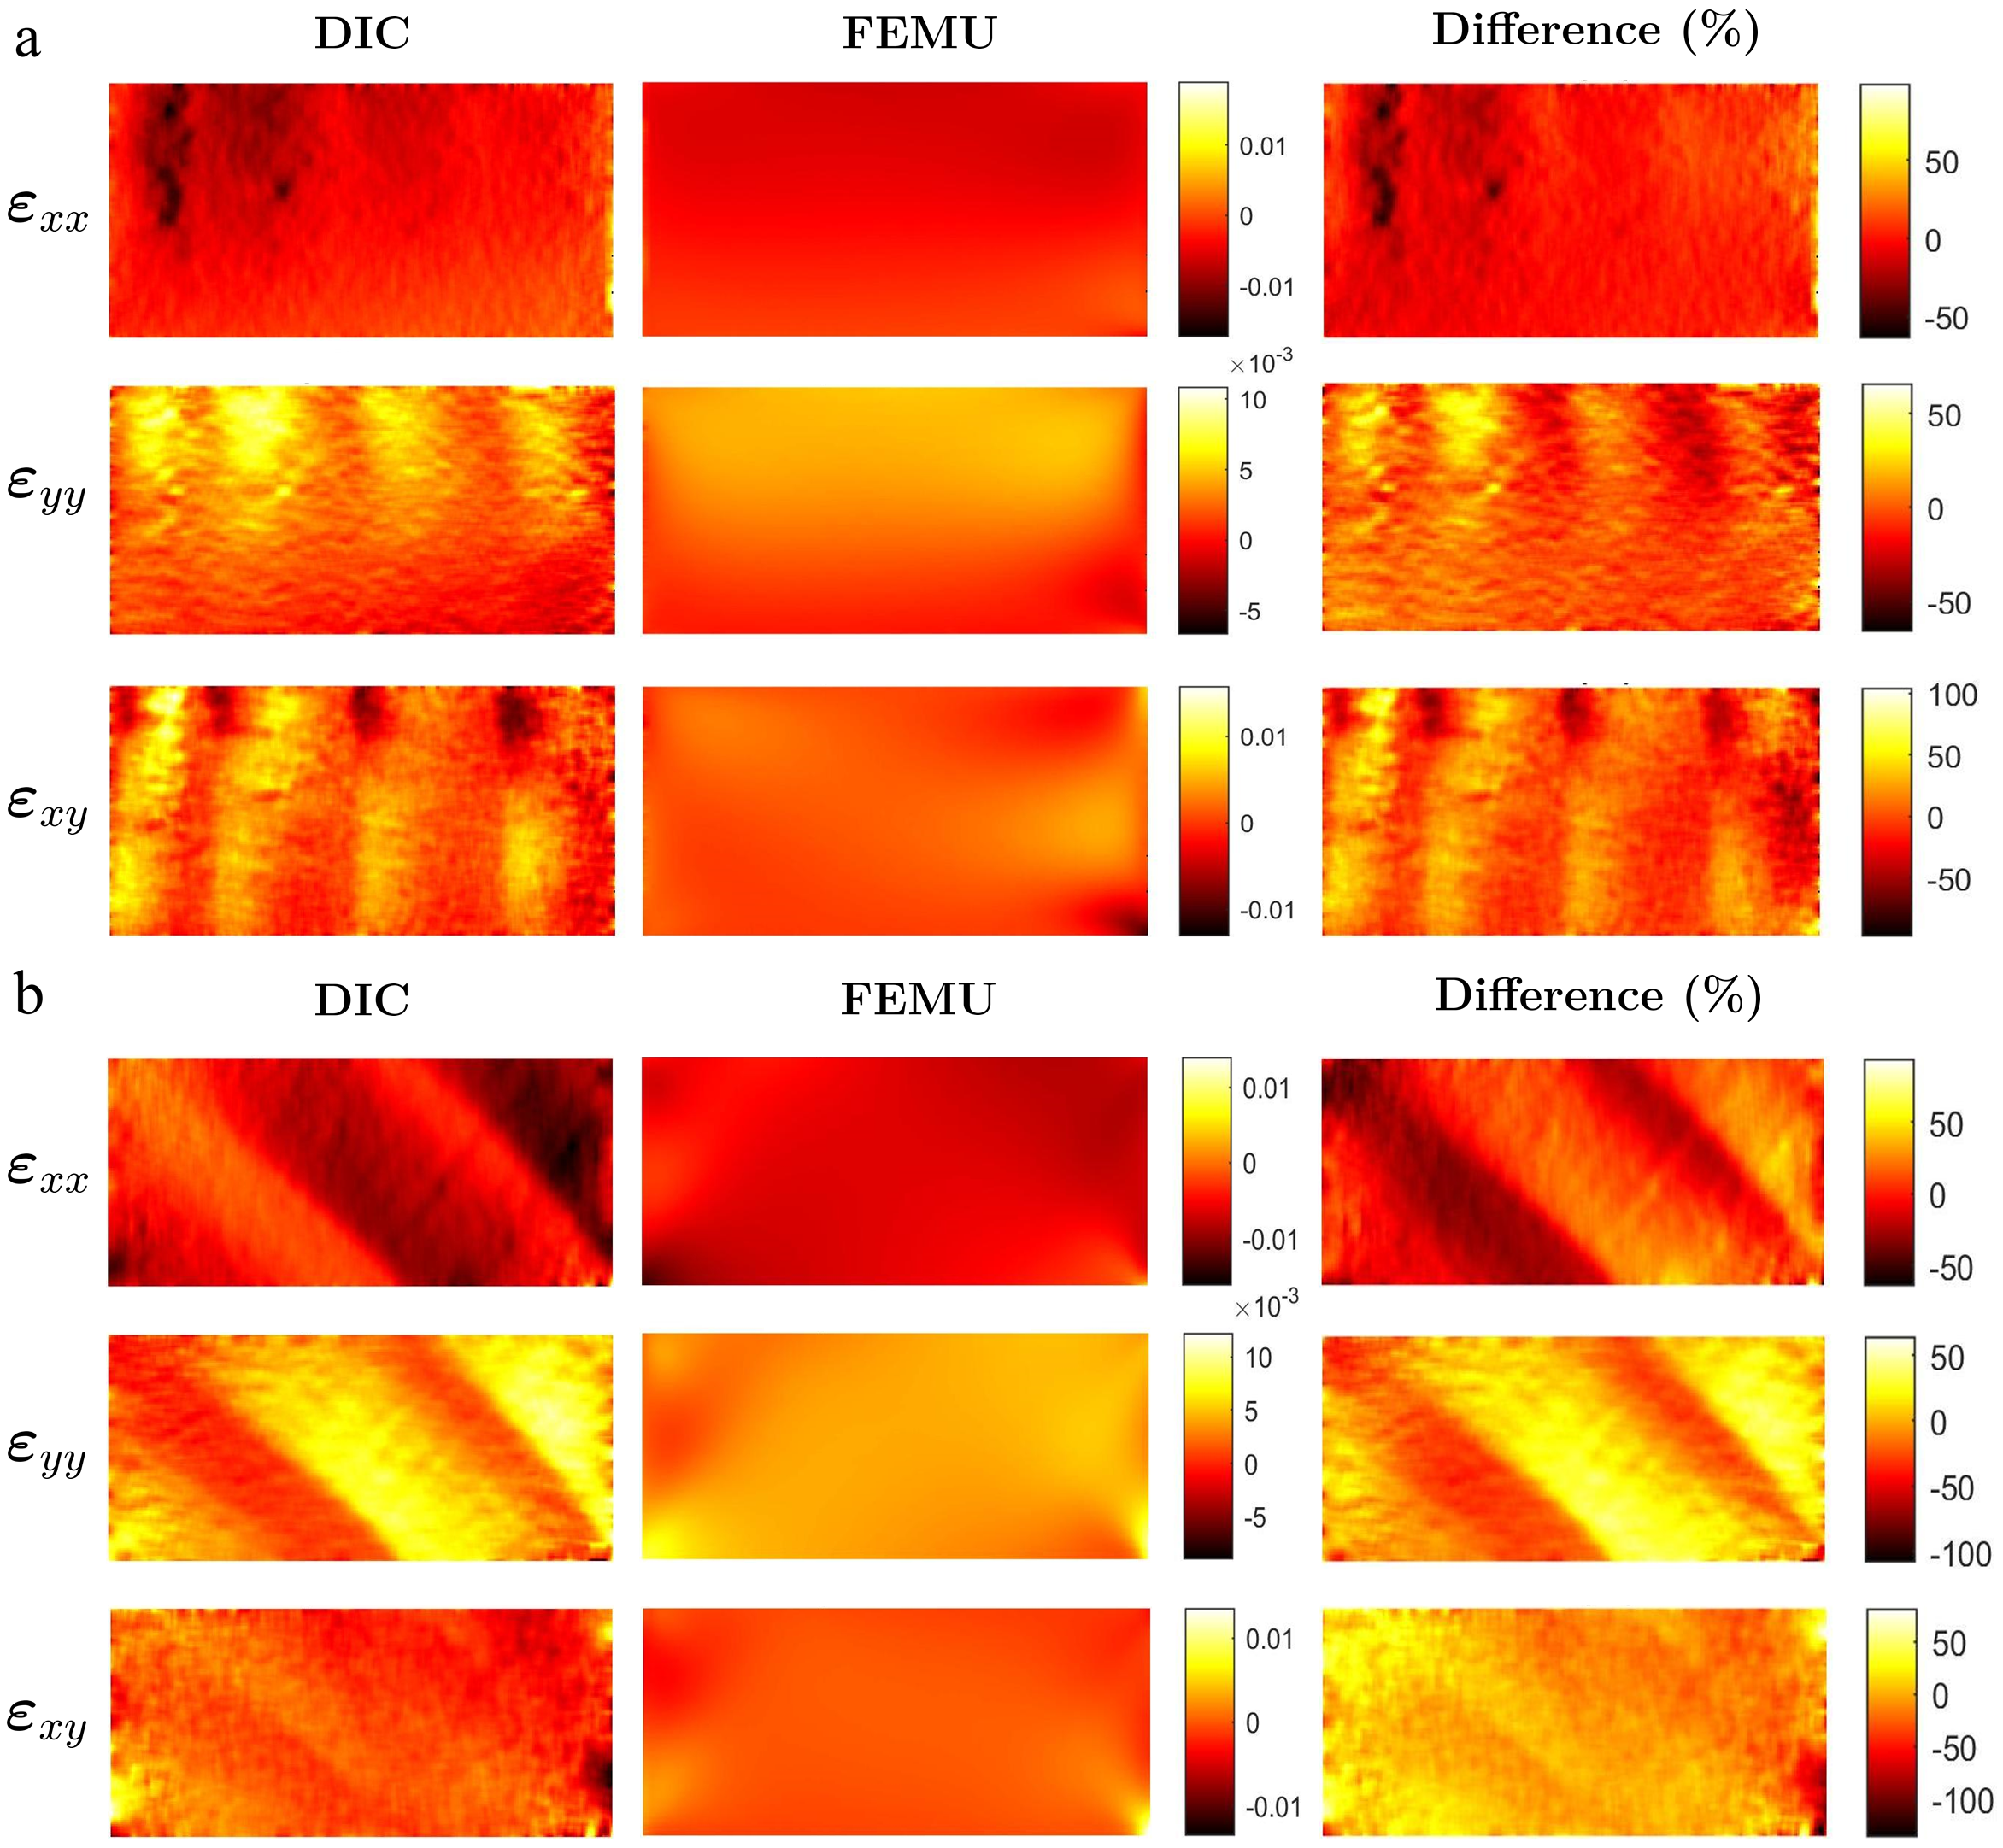 Figure 8. Experimental calibrated numerical and difference full-field strain maps for: (a) Specimen 1 and (b) Specimen 17.
3.5. Identified Orthotropic Linear Elastic Parameters
The orthotropic linear elastic constitutive parameters of Pinus pinaster for the RT plane are identified. The constitutive parameters were determined for each on-axis and off-specimen and are listed in Tables 2 and 3, respectively, and include the average value, standard deviation (Sdt), and coefficient of variation (CoV). The results show some dispersion, which is to be expected given wood intrinsic natural variability.
| ER (MPa) | ET (MPa) | νRT | GRT (MPa) | |
| Reference parameters | 1912 | 1010 | 0.586 | 176 |
| Specimen 1 | 1578.8 | 823.7 | 0.783 | 187.3 |
| Specimen 2 | 1065.1 | 749.9 | 0.697 | 148.6 |
| Specimen 3 | 1687.0 | 1250.3 | 0.698 | 623.4 |
| Specimen 4 | 1725.4 | 1138.2 | 0.774 | 158.3 |
| Specimen 5 | 1964.2 | 971.0 | 0.815 | 280.0 |
| Specimen 6 | 1591.4 | 817.6 | 0.779 | 349.4 |
| Specimen 7 | 1535.8 | 1116.1 | 0.575 | 622.8 |
| Specimen 8 | 1173.6 | 846.1 | 0.807 | 255.9 |
| Specimen 9 | 1961.4 | 845.7 | 0.727 | 671.7 |
| Average | 1587.0 | 951.0 | 0.739 | 366.4 |
| Sdt | 307.7 | 176.4 | 0.076 | 214.4 |
| CoV | 19.39% | 18.55% | 10.22% | 58.53% |
| ER (MPa) | ET (MPa) | νRT | GRT (MPa) | |
| Reference parameters | 1912 | 1010 | 0.586 | 176 |
| Specimen 10 | 521.5 | 418.2 | 0.679 | 161.7 |
| Specimen 11 | 352.0 | 411.1 | 0.580 | 159.5 |
| Specimen 12 | 2313.1 | 1019.6 | 0.327 | 188.1 |
| Specimen 13 | 359.9 | 337.1 | 0.699 | 180.1 |
| Specimen 14 | 579.6 | 348.5 | 0.284 | 169.0 |
| Specimen 15 | 1469.9 | 601.0 | 0.629 | 160.0 |
| Specimen 16 | 530.7 | 417.3 | 0.742 | 158.1 |
| Specimen 17 | 2398.1 | 600.2 | 0.740 | 156.5 |
| Specimen 18 | 1011.8 | 418.6 | 0.661 | 146.0 |
| Average | 1059.6 | 507.9 | 0.593 | 164.3 |
| Sdt | 815.7 | 214.2 | 0.171 | 12.8 |
| CoV | 76.99% | 42.18% | 28.86% | 7.82% |
4. Discussion
The proposed FEMU methodology, which is based on a synthetic image approach and uniaxial compression tests, while using on-axis specimens proved to be effective in the identification of three out of four RT orthotropic linear elastic constitutive parameters of Pinus pinaster, which were the modulus of elasticity in the radial and tangential directions and the Poisson’s ratio on the RT plane. The mean value for these parameters can be compared to the typical values reported in the literature, with a CoV ranging from 10.2% to 19.4%. The shear modulus identified using the on-axis configuration has a higher dispersion with a CoV of 58.5%. Furthermore, for the identified mean values, the anisotropy ratio on the RT plane, which is determined by the ratio between ER and ET, is 1.67, which is comparable to the values reported in the literature [6].
Moreover, the proposed approach was successful in identifying the shear modulus of the RT plane on off-axis specimens. The average identified value of this parameter agrees with the reference value and has a low CoV of 7.8%. While the remaining parameters show a higher dispersion with a CoV in between 28.9% and 77.0%. These results show that due to the lack of sufficiently heterogeneous strain fields, there is a dependency on the test configuration and the identifiability of some material parameters.
Some of the dispersion found in the results is most likely due to variations in material properties between specimens.
5. Conclusions
The following main conclusions can be drawn from this study:
- The proposed methodology using a DIC-levelled FEA reference (virtual experiment) in the identification procedure was successfully validated. The iterative process of FEMU was also coupled to synthetic image generation, taking into consideration the FEA nodal displacements and mesh information.
- For each specimen configuration, a convergence study of the DIC settings was systematically carried out. The effect of the selected DIC parameters on the identification results was evaluated. When the material parameter was well identified, the DIC settings had no significant influence on the convergence. However, when the elastic parameters were less sensitive to the identification, this influence was higher.
- The average values identified on the on-axis specimens for the modulus of elasticity on the radial and tangential directions, as well as the Poisson’s ratio of the RT plane, show an agreement to the reference value and a lower variation when compared to the values identified for the shear modulus.
- On the off-axis specimens, the shear modulus of the RT plane agrees with the reference value, while also showing a low variation, with a CoV of 7.82%. Given the natural variability of natural materials such as wood, the scatter in the identification results is to be expected.
- The results show that three out of four RT linear elastic orthotropic parameters of Pinus pinaster were identified based on an on-axis specimen configuration (ER, ET and νRT), and one of the four parameters was correctly identified when using off-axis specimen configuration (GRT).
- Other heterogeneous test configurations should be investigated in future work to increase the identifiability of all constitutive parameters using a single test. Furthermore, this methodology may be used to identify the heterogeneous orthotropic constitutive properties of wood.
This entry is adapted from 10.3390/ma15020625
References
- Food and Agriculture Organization of the United Nations (FAO). State of theWorld’s Forests 2009 (Global Demand forWood Products);FAO: Rome, Italy, 2009.
- Pereira, J.L.; Xavier, J.; Ghiassi, B.; Lousada, J.; Morais, J. On the identification of earlywood and latewood radial elasticmodulus of Pinus pinaster by digital image correlation: A parametric analysis. J. Strain Anal. Eng. Des. 2018, 53, 566–574. doi:10.1177/0309324718786351.
- Cramer, S.; Kretschmann, D.; Lakes, R.; Schmidt, T. Earlywood and latewood elastic properties in loblolly pine. Holzforschung 2005, 59. doi:10.1515/HF.2005.088.
- Dang, D.; Pitti, R.M.; Toussaint, E.; Grédiac, M. Inverse identification of early- and latewood hydric properties using full-field measurements. Wood Mater. Sci. Eng. 2018, 13, 50–63. doi:10.1080/17480272.2016.1263973.
- Xavier, J.; Avril, S.; Pierron, F.; Morais, J. Variation of transverse and shear stiffness properties of wood in a tree. Special Issue: CompTest 2008. Compos. Part A Appl. Sci. Manuf. 2009, 40, 1953–1960. doi:10.1016/j.compositesa.2009.09.023.
- Pereira, J.; Xavier, J.; Morais, J.; Lousada, J. Assessing wood quality by spatial variation of elastic properties within the stem: Case study of Pinus pinaster in the transverse plane. Can. J. For. Res. 2014, 44, 107–117. doi:10.1139/cjfr-2013-0207.
- Grédiac, M. The use of full-field measurement methods in composite material characterization: interest and limitations. Compos. Part A Appl. Sci. Manuf. 2004, 35, 751–761. doi:10.1016/j.compositesa.2004.01.019.
- Grédiac, M.; Hild, F.E. Full-field measurements and identification in solid mechanics; John Wiley & Sons–ISTE: USA: Hoboken, NJ; UK: London, 2012.
- Sciammarella, C.; Sciammarella, F. Experimental mechanics of solids; John Wiley & Sons: Hoboken, NJ, USA, 2012.
- Pan, B.; Qian, K.; Xie, H.; Asundi, A. Two-dimensional digital image correlation for in-plane displacement and strain measurement: A review. Meas. Sci. Technol. 2009, 20, 062001. doi:10.1088/0957-0233/20/6/062001.
- Sutton, M.; Orteu, J.; Schreier, H. Image correlation for shape, motion and deformation measurements: basic concepts, theory and applications; Springer: Berlin/Heidelberg, Germany, 2009.
- Li, L.; Gong, M.; Chui, Y.; Schneider, M.; Li, D. Measurement of the elastic parameters of densified balsam fir wood in the radial-tangential plane using a digital image correlation (DIC) method. J. Mater. Sci. 2013, 48, 7728–7735. doi:10.1007/s10853-013-7593-1.
- Hu, M.; Johansson, M.; Olsson, A.; Oscarsson, J.; Enquist, B. Local variation of modulus of elasticity in timber determined on the basis of non-contact deformation measurement and scanned fibre orientation. Eur. J. Wood Wood Prod. 2014, 73, 17–27. doi:10.1007/s00107-014-0851-3.
- Xavier, J.; Oliveira, M.; Monteiro, P.; Morais, J.; De Moura, M. Direct evaluation of cohesive law in mode I of Pinus pinaster by digital image correlation. Exp. Mech. 2014, 54, 1–12. doi:10.1007/s11340-013-9838-y.
- Gras, R.; Leclerc, H.; Hild, F.; Roux, S.; Schneider, J. Identification of a set of macroscopic elastic parameters in a 3D woven composite: Uncertainty analysis and regularization. Int. J. Solids Struct. 2015, 55, 2–16. doi:10.1016/j.ijsolstr.2013.12.023.
- Brabec, M.; Lagana, R.; Milch, J.; Tippner, J.; Sebera, V. Utilization of digital image correlation in determining of both longitudinal shear moduli of wood at single torsion test. Wood Sci. Technol. 2017, 51. doi:10.1007/s00226-016-0848-7.
- Andrade-Campos, A.; Thuillier, S.; Martins, J.; Carlone, P.; Tucci, F.; Valente, R.; Paulo, R.M.; de Sousa, R.J.A. Integrated design in welding and incremental forming: material model calibration for friction stir welded blanks. Procedia Manuf. 2020, 47, 429–434. doi:10.1016/j.promfg.2020.04.327.
- Grédiac, M.; Pierron, F.; Surrel, Y. Novel procedure for complete in-plane composite characterization using a single T-shaped specimen. Exp. Mech. 1999, 39, 142–149. doi:10.1007/BF02331118.
- Rossi, M.; Pierron, F. On the use of simulated experiments in designing tests for material characterization from full-field measurements. Int. J. Solids Struct. 2012, 49, 420–435. doi:10.1016/j.ijsolstr.2011.09.025.
- Grédiac, M.; Blaysat, B.; Sur, F. A critical comparison of some metrological parameters characterizing local digital image correlation and grid method. Exp. Mech. 2017, 57. doi:10.1007/s11340-017-0279-x.
- Kibitkin, V.; Solodushkin, A.; Pleshanov, V.; Napryushkin, A. On a choice of input parameters for calculation the vector field and deformation with DIC. Measurement 2017, 95, 266–272. doi:10.1016/j.measurement.2016.10.020.
- Pan, B.; Xie, H.; Wang, Z.; Qian, K.; Wang, Z. Study on subset size selection in digital image correlation for speckle patterns. Opt. Express 2008, 16, 7037–7048. doi:10.1364/OE.16.007037.
- Rossi, M.; Lava, P.; Pierron, F.; Debruyne, D.; Sasso, M. Effect of DIC spatial resolution, noise and interpolation error on identification results with the VFM. Strain 2015, 51, 206–222. doi:10.1111/str.12134.
- Martins, J.; Andrade-Campos, A.; Thuillier, S. Comparison of inverse identification strategies for constitutive mechanical models using full-field measurements. Int. J. Mech. Sci. 2018, 145, 330–345. doi:10.1016/j.ijmecsci.2018.07.013.
- Claire, D.; Hild, F.; Roux, S. A finite element formulation to identify damage fields: the equilibrium gap method. Int. J. Numer. Methods Eng. 2004, 61, 189–208. doi:10.1002/nme.1057.
- Latourte, F.; Chrysochoos, A.; Pagano, S.; Wattrisse, B. Elastoplastic behavior identification for heterogeneous loadings and materials. Exp. Mech. 2008, 48, 435–449. doi:10.1007/s11340-007-9088-y.
- Kajberg, J.; Lindkvist, G. Characterisation of materials subjected to large strains by inverse modelling based on in-plane displacement fields. Int. J. Solids Struct. 2004, 41, 3439–3459. doi:10.1016/j.ijsolstr.2004.02.021.
- Lecompte, D.; Smits, A.; Sol, H.; Vantomme, J.; Van Hemelrijck, D. Mixed numerical–experimental technique for orthotropic parameter identification using biaxial tensile tests on cruciform specimens. Int. J. Solids Struct. 2007, 44, 1643–1656. doi:10.1016/j.ijsolstr.2006.06.050.
- Cooreman, S.; Lecompte, D.; Sol, H.; Vantomme, J.; Debruyne, D. Identification of mechanical material behavior through inverse modeling and DIC. Exp. Mech. 2008, 48, 421–433. doi:10.1007/s11340-007-9094-0.
- Moulart, R.; Avril, S.; Pierron, F. Identification of the through-thickness rigidities of a thick laminated composite tube. Compos. Part A Appl. Sci. Manuf. 2006, 37, 326–336. CompTest 2004, doi:10.1016/j.compositesa.2005.05.050.
- Grédiac, M.; Pierron, F. Applying the Virtual Fields Method to the identification of elasto-plastic constitutive parameters. Int. J. Plast. 2006, 22, 602–627. doi:10.1016/j.ijplas.2005.04.007.
- Grédiac, M.; Pierron, F.; Avril, S.; Toussaint, E. The Virtual Fields Method for extracting constitutive parameters from full-field measurements: a review. Strain 2006, 42, 233–253. doi:10.1111/j.1475-1305.2006.tb01504.x.
- Pierron, F.; Grédiac, M. The Virtual Fields Method. Extracting constitutive mechanical parameters from full-field deformation measurements; Springer: New York, NY, USA, 2012.
- Balcaen, R.;Wittevrongel, L.; Reu, P.; Lava, P.; Debruyne, D. Stereo-DIC calibration and speckle image generator based on FE formulations. Experimental Mechanics 2017, 57, 703–718. doi:10.1007/s11340-017-0259-1.
- Lava, P.; Jones, E.M.C.; Wittevrongel, L.; Pierron, F. Validation of finite-element models using full-field experimental data:Levelling finite-element analysis data through a digital image correlation engine. Strain 2020, 56, e12350. doi:10.1111/str.12350.
- Lava, P.; Cooreman, S.; Coppieters, S.; De Strycker, M.; Debruyne, D. Assessment of measuring errors in DIC using deformation fields generated by plastic FEA. Opt. Lasers Eng. 2009, 47, 747–753. doi:10.1016/j.optlaseng.2009.03.007.
- MatchID: Metrology Beyond Colors. MatchID Version 2021.2. NV: Ghent, Belgium, 2021.
- ANSYS, Inc. ANSYS Mechanical APDL Student Version 2021 R1; ANSYS, Inc., Pennsylvania, Canonsburg, USA: 2021.
- Forest Products Laboratory. Wood handbook: wood as an engineering material; General Technical Report FPL-GTR-190; Forest Products Laboratory: Madison, WI, USA, 2010.