Your browser does not fully support modern features. Please upgrade for a smoother experience.
Please note this is an old version of this entry, which may differ significantly from the current revision.
Subjects:
Allergy
Vincristine-induced peripheral neuropathy (VIPN) is a debilitating side-effect of vincristine. It remains a challenge to predict which patients will suffer from VIPN. Pharmacogenomics may explain an individuals’ susceptibility to side-effects.
- vincristine
- vincristine-induced peripheral neuropathy
- pediatric oncology
- pharmacogenomics
1. Introduction
Vincristine is an important chemotherapeutic agent that is commonly used in treatment for pediatric cancers. It is approved by the United States Food and Drug Administration (FDA) for the treatment of acute lymphoblastic leukemia (ALL), Hodgkin and non-Hodgkin lymphoma, neuroblastoma, rhabdomyosarcoma, low-grade glioma and nephroblastoma. Furthermore, off-label uses include the treatment of Ewing sarcoma and medulloblastoma [1,2]. The main side-effect of vincristine is vincristine-induced peripheral neuropathy (VIPN), which often presents as a symmetric sensory-motoric neuropathy progressing distally to proximally [1,2]. Presenting signs include foot drop, loss of deep tendon reflexes, impaired balance, pain or tingling [1,2]. In addition, patients can suffer from autonomic symptoms such as constipation or orthostatic hypotension. The reported prevalence of VIPN varies, depending on assessment method and study population, but it is estimated that the majority of patients receiving vincristine will experience some form of VIPN during treatment [1,2,3,4]. Up to 30% of patients may suffer from severe VIPN, requiring dose reduction or cessation of treatment [3,5]. Suffering from VIPN is associated with a lower health-related quality of life, both by self- and proxy assessment and consistently when using different assessment tools for VIPN [6]. This effect of VIPN on health-related quality of life seems to persevere after treatment, as was shown in a recent study in ALL survivors in which over 16% suffered from long-term VIPN and experienced impact on both physical health and social functioning [7].
It is recognized that different populations might have an altered risk for VIPN [3]. Older age has been associated with an increased risk of VIPN, although results have been inconsistent [8,9,10,11,12]. In addition, white children appear to have a higher risk of VIPN than black children [3,9,12,13,14,15], which is corroborated by a recent study in Kenyan pediatric cancer patients in which only one out of 78 black patients developed severe VIPN and less than 5% developed clinically relevant VIPN, despite the use of sensitive assessment methods [16]. Interestingly, these children are being treated at a higher vincristine dose than what is common in Western countries (2.0 mg/m2 as opposed to 1.5 mg/m2) [1,16]. Studies assessing the relationship between VIPN and vincristine pharmacokinetics (PK) have shown inconsistent results. Some studies show a correlation between VIPN and PK parameters such as area under the curve (AUC) [17], an estimate of vincristine exposure, and intercompartmental clearance [18], whereas others do not confirm these findings [19,20,21,22]. Therefore, potential risk factors for VIPN could be genetic variations in genes involved in vincristine PK, such as variations in the cytochrome (CYP) 450 family of enzymes. Vincristine is predominantly metabolized by CYP3A4 and CYP3A5, of which the latter has a higher intrinsic clearance [23]. Genetic variants in both enzymes result in different metabolic activity [23,24]. Racial populations have different distributions of wild-type and variant CYP3A4/5 alleles [25,26,27]. Combined with the observation that black patients develop less VIPN, it has led to the hypothesis that faster clearance of vincristine in black children results in a lower risk of VIPN in comparison to white patients [14]. Indeed, several studies have described the effect of variations in CYP3A4 and CYP3A5 on the development of VIPN [8,13,14,16,20,28,29,30,31,32]. Differences in VIPN prevalence across populations may thus stem from variations in genetic background, which can be studied via the rapidly expanding field of pharmacogenomics.
Pharmacogenomics aims to assess the influence of genomics on an individuals’ treatment response and susceptibility to side-effects, such as VIPN [33,34]. Often, the effect of single nucleotide polymorphisms (SNPs) is assessed [35,36]. The frequency distribution of major and minor alleles varies across racial groups and study populations, which has been well characterized in large projects such as the 1000 Genomes Project and the genome Aggregation Database (gnomAD) [37,38]. Pharmacogenomics aims to find those SNPs or genetic variations that are biologically relevant [35,36]. Two main study designs have been used to assess this: candidate gene studies or population-based genome- or exome-wide association studies (GWAS or EWAS respectively) [39,40]. Candidate gene studies determine, a priori, a set of genes, based on available literature or mechanism of action, whose influence on a certain outcome is to be assessed [39]. Population-based GWAS or EWAS, on the other hand, assess the whole exome or genome (by whole exome sequencing (WES) or whole genome sequencing (WGS)) for genetic variation in relation to a certain outcome measure [39]. These studies may therefore result in previously unknown genotype—phenotype associations.
Pharmacogenomics can serve as a guidance tool for precision therapy in which a priori a patients’ genetic susceptibility for side-effects or therapeutic efficacy is determined. Although this has been implemented in clinical practice for some drugs, such as thiopurine methyltransferase (TPMT), this is currently not possible for vincristine [41,42]. Especially since there is a lack of understanding of what causes variability in VIPN across patients, pharmacogenomics can provide valuable insight into the pathogenesis of VIPN. If genes affecting vincristine PK are implicated, this may emphasize the potential of therapeutic drug monitoring. Moreover, since it is unlikely that VIPN is caused by differences in PK alone, variation in cellular sensitivity to vincristine and in neuronal pathways could be contributing factors. The implication of genes related to neuronal pathways, the cytoskeleton or cellular integrity with VIPN might then help guiding clinicians in deciding a priori if patients have a high chance of being developing (clinically relevant) VIPN and thus if patients should be monitored more closely than others, or even given an adapted vincristine dosage. In contrast, other patients might be identified who tolerate higher levels of vincristine and might thus not benefit from the generally applied dose capping at 1.5 mg/m2. Ultimately, the goal would be to develop a protocol for vincristine in which patients are stratified based on the presence of genetic polymorphisms and given a dosage that limits the risk of severe VIPN while maintaining the highest possible therapeutic efficacy.
2. Pharmacogenomics of Vincristine-Induced Peripheral Neuropathy in Children with Cancer
2.1. Association between Pharmacogenomic Parameters and VIPN
Table 2 and Table 3 show an overview of all SNPs found to have a statistically significant and non-significant association with VIPN, respectively. Figure 2 shows a schematic overview of the function of genes associated with VIPN. Sixteen SNPs in three ATP-binding cassette transporter genes (ABCB1, ABCC1, ABCC2) and one SNP in an miRNA targeting ABCC1/RalA binding protein 1 (RALPB1) were described to be significantly associated with VIPN (Table 2). Ten SNPs were associated with a protective effect against VIPN, whereas seven SNPs were associated with an increased risk of VIPN. Of note, the strongest protective associations with high precision were reported for SNPs rs3740066 and rs12826 in ABCC2 (OR 0.23, 95% CI 0.10−0.53, and 0.24, 95% CI 0.10−0.54 respectively). The strongest risk association with acceptable precision was reported for rs3784867 in ABCC1 (OR 4.91, 95% CI 1.99−12.10).
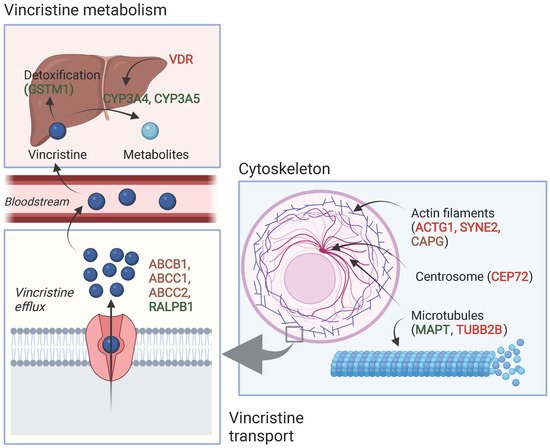
Figure 2. Schematic overview of the function of genes associated with VIPN. Red: described SNPs in this gene are associated with a higher risk of VIPN; green: described SNPs in this gene are associated with a lower risk of VIPN, brown: described SNPs in this gene are associated with both a higher and lower risk of VIPN (different per SNP). Created with BioRender.com.
In terms of metabolism-associated genes, a deletion in glutathione S-transferase mu 1 (GSTM1) and an SNP in vitamin D receptor (VDR) were implicated with a heightened and a decreased risk to VIPN, respectively (Table 2) [13]. Furthermore, six SNPs in cytoskeleton-associated genes or in miRNAs targeting those were associated with VIPN (microtubule associated protein tau (MAPT), targeting tubulin beta 2B class IIB (TUBB2), actin gamma 1 (ACTG1), capping actin protein gelsolin like (CAPG) and spectrin repeat containing nuclear envelope protein 2 (SYNE2)) (Table 2). Of those, two SNPs were related to microtubules (MAPT and TUBB2) and associated with a protective effect and an increased risk of VIPN, respectively (Table 2) [49]. The four other SNPs were located in cytoskeleton-associated genes (ACTG1, CAPG, and SYNE2) and associated with a CTCAE grade 3−4 VIPN (Table 2) [8,52]. The latter passed the stringent significance threshold for multiple comparisons, but the results could not be confirmed in a replication cohort [52]. The strongest protective association was noted for SNP rs3770102 in CAPG with an effect size of 0.1, although the uncertainty was high (95% CI 0.01−0.8). One SNP in a gene associated with hereditary neuropathies (solute carrier family 5 member 7 (SLC5A7)) resulted in an increased susceptibility to VIPN (Table 2) [51]. The reported effect size was large, but the size of the confidence interval indicated relatively high uncertainty (OR 8.60, 95% CI 1.68−44.15) Except for the SNP in SYNE2, all aforementioned SNPS were solely assessed in a discovery cohort and no replication studies were performed for any of those associations [52].
able 2. Single-nucleotide polymorphisms that were significantly associated with vincristine-induced peripheral neuropathy in the pediatric oncology population.
| Gene | SNP | Allele, Major/Minor | Author and Year of Publication | MAF (%) | Number of Patients (n) | Method Effect Size | Effect Size with 95% CI (If Applicable) | Effect | |
|---|---|---|---|---|---|---|---|---|---|
| Cases of VIPN * | Controls * | ||||||||
| Transport | |||||||||
| ABCB1 | rs4728709 | C/T | Ceppi et al., 2014 [8] | TT/TC: 17.1 CC: 82.9 |
63 (grade 1–2) | 214 (grade 0) | Dominant OR | 0.3 (0.1–0.9) | Protective 1 |
| rs10244266 | T/G | Lopez-Lopez et al., 2016 [11] | 14.3 | 46 (WHO grade 1–4) | 103 (WHO grade 0) | Dominant OR | 2.60 (1.16–5.83) | Risk 2 | |
| rs10268314 | T/C | Lopez-Lopez et al., 2016 [11] | 14.3 | 27 (WHO grade 1–2) | 103 (WHO grade 0) | Dominant OR | 3.19 (1.23–8.25) | Risk 2 | |
| rs10274587 | G/A | Lopez-Lopez et al., 2016 [11] | 14.6 | 27 (WHO grade 1–2) | 103 (WHO grade 0) | Dominant OR | 3.48 (1.36–8.86) | Risk 2 | |
| ABCC1 | rs1967120 | T/C | Lopez-Lopez et al., 2016 [11] | 27.3 | 18 (WHO grade 3–4) | 103 (WHO grade 0) | Dominant OR | 0.29 (0.09–0.99) | Protective 2 |
| rs3743527 | C/T | Lopez-Lopez et al., 2016 [11] | 19.7 | 46 (WHO grade 1–4) | 103 (WHO grade 0) | Dominant OR | 0.32 (0.13–0.79) | Protective 2 | |
| rs3784867 | C/T | Wright et al., 2019 [51] | 32.0 | 170 (grade 2–4) | 57 (grade 0) | Additive OR | 4.91 (1.99–12.10) | Risk 3 | |
| rs11642957 | T/C | Lopez-Lopez et al., 2016 [11] | 48.1 | 46 (WHO grade 1–4) | 103 (WHO grade 0) | Dominant OR | 0.43 (0.19–0.98) | Protective 2 | |
| rs11864374 | G/A | Lopez-Lopez et al., 2016 [11] | 24.4 | 46 (WHO grade 1–4) | 103 (WHO grade 0) | Dominant OR | 0.35 (0.15–0.79) | Protective 2 | |
| rs12923345 | T/C | Lopez-Lopez et al., 2016 [11] | 15.4 | 46 (WHO grade 1–4) | 103 (WHO grade 0) | Dominant OR | 2.39 (1.08–5.25) | Risk 2 | |
| rs17501331 | A/G | Lopez-Lopez et al., 2016 [11] | 13.2 | 46 (WHO grade 1–4) | 103 (WHO grade 0) | Dominant OR | 2.50 (1.10–5.68) | Risk 2 | |
| ABCC2 | rs12826 | G/A | Lopez-Lopez et al., 2016 [11] | 42.6 | 46 (WHO grade 1–4) | 103 (WHO grade 0) | Dominant OR | 0.24 (0.10–0.54) | Protective |
| rs3740066 | G/A | Lopez-Lopez et al., 2016 [11] | 36.2 | 46 (WHO grade 1–4) | 103 (WHO grade 0) | Dominant OR | 0.23 (0.10–0.53) | Protective | |
| rs2073337 | A/G | Lopez-Lopez et al., 2016 [11] | 45.8 | 18 (WHO grade 3–4) | 103 (WHO grade 0) | Dominant OR | 0.35 (0.10–1.24) | Protective | |
| rs4148396 | C/T | Lopez-Lopez et al., 2016 [11] | 42.1 | 46 (WHO grade 1–4) | 103 (WHO grade 0) | Dominant OR | 0.36 (0.16–0.81) | Protective | |
| rs11190298 | G/A | Lopez-Lopez et al., 2016 [11] | 45.0 | 46 (WHO grade 1–4) | 103 (WHO grade 0) | Recessive OR | 2.44 (1.01–5.86) | Risk | |
| ABCC1/RALPB1: miR–3117 | rs12402181 | G/A | Gutierrez–Camino et al., 2017 [48] | 14.8 | 19 (WHO grade 3–4) | 128 (WHO grade 0) | Dominant OR | 0.13 (0.02–0.99) | Protective 2 |
| Vincristine metabolism | |||||||||
| CYP3A4 | rs2740574 | A/G(*1B) | Aplenc et al., 2003 [28] | 8.6 | 28 (CCG grade 3–4) | 505 (CCG grade 0–2) | Allelic OR | 0 (0–0.75) | Protective 2 |
| Guilhaumou et al., 2011 [20] | 6.3 | Nr of neurotoxicity events | Chi–square | p = 1.00 | Not significant | ||||
| Kishi et al., 2007 [13] | AA: 79.6 AG + GG: 20.4 |
30 (grade 2–4) | 210 (grade 0–1) | Dominant OR | 1.37 (0.57–3.29) | Not significant | |||
| GSTM1 | Deletion | Non–null/null | Kishi et al., 2007 [13] | Non–null: 57.5 Null: 42.5 |
30 (grade 2–4) | 210 (grade 0–1) | OR | 0.46 (0.22–0.94) | Protective2 |
| VDR | rs1544410 | G/A | Kishi et al., 2007 [13] | GG: 45.8 AA and AG: 54.2 |
30 (grade 2–4) | 210 (grade 0–1) | Recessive OR | 2.22 (1.06–4.67) | Risk |
| Cytoskeleton–associated | |||||||||
| ACTG1 | rs1135989 | G/A | Ceppi et al., 2014 [8] | 36.5 | 38 (grade 3–4) | 214 (grade 0) | Dominant OR | 2.8 (1.3–6.3) | Risk 1 |
| CAPG | rs2229668 | G/A | Ceppi et la. 2014 [8] | 12.6 | 39 (grade 3–4) | 214 (grade 0) | Dominant OR | 2.1 (1.1–3.7) | Risk 1 |
| rs3770102 | C/A | Ceppi et al., 2014 [8] | 41.4 | 39 (grade 3–4) | 214 (grade 0) | Dominant OR | 0.1 (0.01–0.8) | Protective 1 | |
| CEP72 | rs924607 | C/T | Diouf et al., 2015—St. Jude cohort [9] | 36.7 | 64 (grade 2–4) | 158 (grade 0) | Recessive OR | 5.5 (2.5–12.2) | Risk |
| Diouf et al., 2015—COG cohort [9] | 36.4 | 22 (grade 2–4) | 74 (grade 0) | Recessive OR | 3.8 (1.3–11.4) | Risk | |||
| Gutierrez–Camino et al., 2016 [10] | 39.4 | 36 (WHO grade 2–4) | 106 (WHO grade 0–1) | Recessive OR | 0.7 (0.2–2.4) | Not significant | |||
| Wright et al., 2019 [51] | TT: 13.5 CT and CC: 86.5 |
156 (grade 2–4) | 56 (grade 0) | Recessive OR | 3.4 (0.9–12.6) | Not significant | |||
| Zgheib et al., 2018 [50] | 36.9 | 23 (grade 2–4) | 107 (grade 0–1) | Recessive OR | 1.04 (0.32–3.43) | Not significant | |||
| MAPT | rs11867549 | A/G | Martin–Guerrero et al., 2019 [49] | 22.5 | 18 (WHO grade 3–4) | 103 (WHO grade 0) | Dominant OR | 0.21 (0.04–0.96) | Protective 2 |
| SYNE2 | rs2781377 | G/A | Abaji et al., 2018—QcALL cohort [52] | 7.8 | 35 (grade 3–4) | 201 (grade 0) | Additive OR | 2.5 (1.2–5.2) | Risk |
| TUBB2B: miR–202 | rs12355840 | T/C | Martin–Guerrero et al., 2019 [49] | 23.4 | 27 (WHO grade 1–2) | 103 (WHO grade 0) | Dominant OR | 2.88 (1.07–7.72) | Risk |
| Hereditary neuropathy | |||||||||
| SLC5A7 | rs1013940 | T/C | Wright et al., 2019 [51] | 15.2 | 170 (grade 2–4) | 57 (grade 0) | Additive OR | 8.60 (1.68–44.15) | Risk 3 |
| Other (GWAS/EWAS studies) | |||||||||
| BAHD1 | rs3803357 | C/A | Abaji et al., 2018—QcALL cohort [52] | 41.7 | 35 (grade 3–4) | 201 (grade 0) | Dominant OR | 0.35 (0.2–0.7) | Protective |
| COCH | rs1045466 | T/G | Li et al., 2020—POG cohort [53] | 38 | Maximum neuropathy score | Dominant HR | 0.27 (0.16–0.50) | Protective | |
| Li et al., 2020—ADVANCE cohort [53] | 33 | Linear regression | −3.56 (−5.45;−1.67) | Protective | |||||
| Chromosome 12/ chemerin | rs7963521 | T/C | Li et al., 2020—POG cohort [53] | 41 | Maximum neuropathy score | Additive HR | 2.23 (1.49–3.35) | Risk | |
| Li et al., 2020—ADVANCE cohort [53] | 43 | Additive HR | 2.16 (0.53–3.70) | Not significant | |||||
| ETAA1 | rs17032980 | A/G | Diouf et al., 2015—St. Jude cohort [9] | 26.6 | 64 (grade 2–4) | 158 (grade 0) | Allelic OR | 3.17 (1.95–5.17) | Risk |
| Diouf et al., 2015—COG cohort [9] | 19.2 | 22 (grade 2–4) | 74 (grade 0) | Allelic OR | 10.4 (2.97–36.15) | Risk | |||
| MRPL4 | rs10513762 | C/T | Abaji et al., 2018—QcALL cohort [52] | 7.0 | 35 (grade 3–4) | 202 (grade 0) | Dominant OR | 3.3 (1.4–7.7) | Risk |
| MTNR1B | rs12786200 | C/T | Diouf et al., 2015—St. Jude cohort [9] | 22.7 | 64 (grade 2–4) | 158 (grade 0) | Allelic OR | 0.23 (0.13–0.40) | Protective |
| Diouf et al., 2015—COG cohort [9] | 20.7 | 22 (grade 2–4) | 74 (grade 0) | Allelic OR | 0.24 (0.08–0.76) | Protective | |||
| Zgheib et al., 2018 [50] | 18.1 | 23 (grade 2–4) | 107 (grade 0–1) | Dominant OR | 0.59 (0.22–1.62) | Not significant | |||
| NDUFAF6 | rs7818688 | C/A | Diouf et al., 2015—St. Jude cohort [9] | 12.6 | 64 (grade 2–4) | 158 (grade 0) | Allelic OR | 4.26 (2.45–7.42) | Risk |
| Diouf et al., 2015—COG cohort [9] | 14.1 | 22 (grade 2–4) | 74 (grade 0) | Allelic OR | 4.59 (1.35–15.59) | Risk | |||
| TMEM215 | rs4463516 | C/G | Diouf et al., 2015—St. Jude cohort [9] | 33.6 | 64 (grade 2–4) | 158 (grade 0) | Allelic OR | 3.17 (1.95–5.17) | Risk |
| Diouf et al., 2015—COG cohort [9] | 24.2 | 22 (grade 2–4) | 74 (grade 0) | Allelic OR | 4.94 (1.65–14.79) | Risk | |||
| miRNA | |||||||||
| miR–4481 | rs7896283 | T/C | Gutierrez–Camino et al., 2017 [48] | 37.5 | 19 (WHO grade 3–4) | 128 (WHO grade 0) | Dominant OR | 4.69 (1.43–15.43) | Risk 2 |
| miR–6076 | rs35650931 | G/C | Gutierrez–Camino et al., 2017 [48] | 8.7 | 47 (WHO grade 1–4) | 128 (WHO grade 0) | Dominant OR | 0.22 (0.05–0.97) | Protective 2 |
SNP = single nucleotide polymorphism, MAF = minor allele frequency, CI = confidence interval, OR = odds ratio, ABCB1 = ATP binding cassette subfamily B member 1, ABCC1 = ATP binding cassette subfamily C member 1, ABCC2 = ATP binding cassette subfamily C member 2, RALPB1 = RalA binding protein 1, miR = microRNA, CYP3A4 = cytochrome P450 3A4, GSTM1 = glutathione S-transferase mu 1, VDR = vitamin D receptor, CAPG = capping actin protein gelsolin like, CEP72 = centrosomal protein 72, MAPT = microtubule associated protein tau, TUBB2B = tubulin beta 2B class IIB, ACTG1 = actin gamma 1, SYNE2 = spectrin repeat containing nuclear envelope protein 2, SLC5A7 = solute carrier family 5 member 7, BAHD1 = bromo adjacent homology domain containing 1, COCH = cochlin, ETAA1 = Ewing’s tumor-associated antigen 1, MRPL4 = mitochondrial ribosomal protein L4, MTNR1B = melatonin receptor 1B, NDUFAF6 = NADH: ubiquinone oxidoreductase complex assembly factor 6, TMEM215 = transmembrane protein 215. * Grades are referring to CTCAE grades unless mentioned otherwise. 1 Significance threshold not adjusted for multiple comparisons. 2 Significance threshold was not met after correcting for multiple comparisons. 3 Significance threshold was not adjusted for multiple comparisons, but associations p < 0.001 were prioritized. Odds ratios (OR) were defined as following: recessive OR meant that the risk of VIPN increased y-fold if two copies of the minor allele (genotype: aa) or genetic variation were present; dominant OR meant that the risk of VIPN increased y-fold if either one or two copies of the minor allele were present (genotypes: Aa or aa); allelic OR meant that the risk of VIPN increased y-fold with each additional copy of the minor allele or genetic variation; and the additive OR meant that the risk of VIPN increased y-fold for the heterozygous genotype (Aa) and 2y-fold for the homozygous variant genotype (aa).
GWAS or EWAS demonstrated significant associations between VIPN and eight SNPs in genes previously not associated with neuropathy, vincristine mechanism of action or metabolism (Table 2). All studies first reporting these associations made use of both a discovery and replication cohort to validate their results [9,52,53]. SNPs in cochlin (COCH), Ewing’s tumor-associated antigen 1 (ETAA1), melatonin receptor 1B (MTNR1B), NADH: ubiquinone oxidoreductase complex assembly factor (NDUFAF6), and transmembrane protein 215 (TMEM215) were significantly associated with VIPN both in a discovery and replication cohort, whereas this relationship was only established in the discovery cohort for SNPs in bromo adjacent homology domain containing 1 (BAHD1), chromosome 12/chemerin, and mitochondrial ribosomal protein L4 (MRPL4). The described SNPS in BAHD1 and COCH were protective against VIPN. The strongest protective association with high precision was reported for the latter (OR 0.27, 95% CI 0.16−0.50). The SNPs in chromosome 12/chemerin, ETAA1, MRPL4, NDUFAF6, and TMEM215 were associated with an increased risk of VIPN. The SNP in ETAA1 showed a strong effect on risk of VIPN, especially in the replication cohort of Diouf et al., although the precision was relatively low (OR 10.4, 95% CI 2.97−36.15). Moreover, the SNPs in NDUFAF6 and TMEM215 also showed relatively large effect sizes with acceptable uncertainty in both a discovery and replication cohort. Finally, Diouf et al. described an SNP in melatonin receptor 1B (MTNR1B) as protective against VIPN both in a discovery and replication cohort with a large effect size and high precision (OR 0.23, 95% CI 0.13−0.40, and OR 0.24, 95% CI 0.08−0.76), but another study by Zgheib et al. could not confirm these results [9,50]. All significant associations passed the stringent threshold for multiple comparisons.
2.2. CYP3A4 and CYP3A5
In regard to CYP3A4, Aplenc et al. found an SNP in CYP3A4 to be protective against VIPN [28], but two follow-up studies could not replicate these findings (Table 2) [13,20]. Furthermore, ten studies assessed the influence of CYP3A5 expression on the development of VIPN [8,13,14,16,20,28,29,30,31,32]. Of those studies, nine either presented a pre-calculated OR or raw data to calculate an OR and could thus be included in the meta-analysis [8,13,14,16,20,28,29,31,32]. If possible, dominant ORs were calculated based on data presented in the article or additional data provided by the authors.
2.3. Summary
Pharmacogenomic parameters have a significant influence on VIPN in children with cancer and show potential for clinical relevance. Several SNPs in genes related to vincristine metabolism, hereditary neuropathy, the cytoskeleton and microtubules have been associated with VIPN. Furthermore, population-based GWAS and EWAS identified significant interactions with SNPs in genes previously unrelated to VIPN or vincristine.
Several significant associations were found between SNPs in the ABC family of genes (ABCB1, ABCC1, ABCC2). These genes code for transmembrane proteins that mediate vincristine efflux across cell membranes; variations may thus contribute to different vincristine levels and therefore VIPN (Figure 2) [54,55].
Furthermore, SNPs in cytoskeleton-associated genes were associated with VIPN (Figure 2). Vincristine exerts its cytostatic effect via binding to the β-subunit of tubulins, which inhibits microtubule polymerization and consequently causes arrest of mitosis in the metaphase [1,59]. During cell division, there is a well-known interaction between microtubules and the actin cytoskeleton; the latter contributes to mitotic spindle assembly and formation [60,61,62]. It is possible that SNPs in genes that affect microtubule formation or the actin cytoskeleton affect binding of vincristine to tubulins or the effect of vincristine binding to tubulins. While this can result in an altered risk of VIPN, one could also hypothesize that this influences the effect of vincristine on mitotic spindle disintegration and thus ultimately the cytotoxic effect. Should that be the case, patients with a lower risk of VIPN might also experience less antitumor effect in comparison with patients with a higher risk of VIPN, which would argue for dose individualization in which standard dose capping is not applied to every patient. Future studies assessing the relationship between VIPN incidence and long-term treatment outcome, correcting for received cumulative vincristine dosage, may provide further insight. Of note, the studies reporting these associations concerned predominantly white patients with ALL and except for one study, the reported associations have not been assessed in a replication cohort [8,49,52]. Therefore, these results regarding SNPs in microtubule- and cytoskeleton-associated genes should be interpreted with caution until independent replication is performed. An association that has been replicated in several independent studies is the association between rs924607 in CEP72 and VIPN. CEP72 encodes for a centrosomal protein that is required for adequate chromosome segregation [63,64]. Centrosomes enable correct alignment of chromosomes during mitosis by controlling the position and orientation of the microtubule spindles at the spindle poles [63,64].
Study assessed the effect of CYP3A5 expression status on VIPN in a meta-analysis and found an overall pooled effect of 0.69, there is no significant effect of CYP3A5 expression status on VIPN.
3. Conclusions
The following pharmacogenomic parameters have a significant influence on VIPN in children with cancer: SNPs in ABCB1, ABCC1, ABCC2, CYP3A4, GSTM1, VDR, ACTG1, CAPG, CEP72, MAPT, SYNE2, TUBB2B, SLC5A7, BAHD1, COCH, chromosome 12/chemerin, ETAA1, MRPL4, MTNR1B, NDUFAF6, TMEM215 and in three miRNAs. CYP3A5 expression does not result in a heightened susceptibility of VIPN. To actualize the potential of pharmacogenomic testing, future research should prospectively assess VIPN with a sensitive measurement tool in both a discovery and replication cohort. Ultimately, the goal would be to develop an individualized protocol based on a patients’ genotype, taking all risk and protective genes into account, and subsequently give patients a dosage that limits the risk of VIPN while maintaining highest possible therapeutic efficacy. Dosage reductions or cessation of treatment, or for some patients even standardized dose capping, would no longer be necessary.
This entry is adapted from the peer-reviewed paper 10.3390/cancers14030612
This entry is offline, you can click here to edit this entry!