Your browser does not fully support modern features. Please upgrade for a smoother experience.
Please note this is an old version of this entry, which may differ significantly from the current revision.
Subjects:
Gastroenterology & Hepatology
CD26 has been reported as a marker for colorectal cancer stem cells endowed with tumor-initiating properties and capable of colorectal cancer (CRC) metastasis. This study demonstrated the functional roles of CD26 in inducing CRC migration, invasion, angiogenesis and metastasis and identified the potential involvement of MMP1 and CAV1 in such process.
- CD26
- colorectal cancer (CRC)
- metastasis
- angiogenesis
- MMP1
- CAV1
1. Introduction
Colorectal carcinoma (CRC) is the third most prevalent and the fourth most lethal type of cancer worldwide. In fact, a significant portion of CRC patients develops synchronous or metachronous liver metastases [1]. The five-year survival rate of CRC patients with liver metastases is less than 10% although with the advanced therapeutic regiments nowadays [2]. Understanding the underlying mechanism of metastasis is important for the development of novel therapeutic strategies.
Our previous works have successfully identified a subpopulation of CD26+ CRC cancer stem cells (CSCs) associated with the development of distant metastasis, enhanced invasiveness and chemoresistance in colorectal cancer [3]. CD26+ CRC cells were uniformly present in both the primary and metastatic tumors in colorectal cancer patients with liver metastasis [3]. Furthermore, in patients without distant metastasis at the time of presentation, the presence of CD26+ cells in their primary tumors predicted distant metastasis on follow up. Isolated CD26+ cells, but not CD26− cells, led to the development of distant metastasis when injected into the mouse cecal wall [3]. In addition, CD26+ cells were also associated with enhanced invasiveness and chemoresistance. These findings suggested that these CD26+ cells are the CSCs responsible for the metastatic capacity of CRC cells [3]. Following the identification of CD26+ CSCs in CRC, we and the others subsequently showed that high CD26 expression in CRC specimens is associated with higher TNM staging, the development of metastasis and is a predictor of poor prognosis after resection of CRC [4,5,6]. These results consistently supported the poor prognosis associated with the presence of CD26+ cells in tumors. However, the functional role and underlying mechanism of CD26 in CRC need to be further explored.
In addition, one of the crucial steps for tumor progression and, consequently, metastasis, is the secretion of factors from tumor cells into the microenvironment which then act on the stromal cells to promote the growth of new blood vessels in the process known as angiogenesis [7]. During angiogenesis, new vessels emerge from existing endothelial-lined vessels to promote the degradation of the vascular basement membrane and remodel the extracellular matrix (ECM), followed by the migration and proliferation of endothelial cells and the generation of new matrix components [8]. Numerous studies have demonstrated the key participation of matrix metalloproteinases (MMPs) in the degradation of ECM components, tumor cell migration into the near tissue, as well as promoting tumor growth and spread through the capillary endothelium and neovascularization [9].
2. Transient CD26 Repression Impaired Epitheliasl–Messenchymal Transition (EMT) Pathway in CD26+ Colorectal Cancer (CRC) Cells
We firstly determined the proportion of CD26+ cells in a series of CRC cell lines by flow cytometry (Figure 1A). To investigate whether CD26 functionally induces CRC metastasis, we determined the level of E-cadherin, which is the hallmark of epithelial markers, in fluorescence-activated cell sorting (FACS)-sorted CD26+ and CD26− HCT116 cells. As shown in Figure 1B, the proportion and intensity of CD26 staining in CD26+ cells were higher than CD26− cells. In contrast, the staining of E-cadherin was lower in CD26+ cells when compared to CD26− cells, suggesting that the CD26+ cells were undergoing EMT process. In addition, when CD26 was repressed in CD26+ cells by transient transfection of CD26-siRNA (siCD26), the level of E-cadherin staining was induced. These results suggested that CD26 functionally induces EMT in CRC cells as reflected by reduced E-cadherin level.
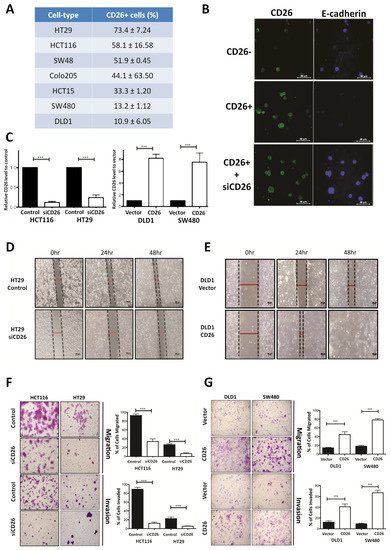
Figure 1. CD26 functionally induces cell migration and invasion in colorectal cancer (CRC) cells. (A) Percentage of CD26+ cells in different CRC cell lines. (B) Immunofluorensce showing level of CD26 (green) and E-cadherin (blue) in HCT116 fluorescence-activated cell sorting (FACS)-sorted CD26-, CD26+ and CD26+ cells with CD26-siRNA (siCD26) transfected. CD26+ cells showed lower E-cadherin in comparison to CD26− cells, indicating induced EMT in CD26+ cells, whereas such effect was abrogated by transient repression of CD26 by siRNA (siCD26). The scale bars correspond to 40 µm. (C) Relative CD26 level in (left) CD26-siRNA transfected HCT116 and HT29 cells when compared to control transfected cells and (right) CD26 overexpressed DLD1 and SW480 cells when compared to vector control cells. (D) HT29 cells with transient CD26 knock-down by siRNA (siCD26) showed decreased wound-healing ability compared to siRNA-control transfected cells (control). The scale bars correspond to 200 µm. (E) DLD1 cells with transient CD26 overexpression (CD26) showed increased wound-healing ability compared to vector control (vector). (F) HCT116 and HT29 cells with transient CD26 knock-down by siRNA (siCD26) showed decreased migration and invasion ability compared to control-treated cells (control). The scale bars correspond to 200 µm. (G) DLD1 and SW480 cells with transient CD26 overexpression (CD26) showed increased migration and invasion ability compared to vector control (vector). *** denotes p < 0.0001.
3. CD26-Induced Colorectal Cancer (CRC) Migration and Invasion In Vitro
To further investigate the functional role of CD26 in CRC, its expression in CRC cell lines was induced or repressed, and the resultant effect on cell migration and invasion in vitro and metastasis in vivo was assessed. HT29 and HCT116 which have a relatively higher proportion of CD26+ cells (Figure 1A) were used for CD26 repression experiments by transient transfection of CD26-siRNA (siCD26). On the other hand, DLD1 and SW480 which have lower proportion of CD26+ cells were used for CD26 overexpression experiments by transfection of CD26 expression plasmids (CD26). The efficiencies of CD26 knock-down or overexpression were shown in Figure 1C. Wound healing experiments were initially performed to determine the effect of CD26 repression or overexpression on cell migration of HT29 and DLD1 cells, respectively. Figure 1D shows the wound closure after 24 and 48 h for HT29-siCD26 and HT29-control cells. The wound distance was larger in siCD26 cells at 24 and 48 h compared to control cells. On the other hand, the wound distance was smaller for CD26-overexpressed DLD1 cells at 24 and 48 h compared to vector control cells (Figure 1E).
We further compared the migratory and invasive ability of CD26-manipulated cells using the migration and invasion transwell assays, respectively. As shown in Figure 1F, transient CD26 repression by CD26-siRNA (siCD26) in HCT116 and HT29 cells led to a significant decrease in migration and invasion abilities. When compared to control cells, HCT116-siCD26 cells showed significant repressed migration (from 92.3% to 34.3%, p < 0.0001) and invasion potential (from 89.3% to 13.0%, p < 0.0001), whereas HT29-siCD26 cells also showed a significantly lower percentage of migrated (from 26.0% to 6.3%, p < 0.0001) and invaded cells (from 21.7% to 5.3%, p < 0.0001). On the other hand, overexpression of CD26 in DLD1 and SW480 cells significantly induced their migration and invasion abilities (Figure 1G). Comparing to vector control cells, DLD1-CD26 overexpressing cells showed induced migration (from 14.2% to 44.8%, p < 0.0001) and invasion abilities (from 12.3% to 40.8%, p < 0.0001), whereas SW480 cells also showed significant induction in percentage of migrated (from 18.2% to 78.2%, p < 0.0001) and invaded cells (from 9.3% to 66.8%, p < 0.0001).
4. CD26 Knock-Down Impaired Colorectal Cancer (CRC) Metastasis and Angiogenesis in Mouse Model
The effect of stable CD26 knock-down on in vivo metastatic potential of CRC cells was also investigated. CD26-repressed HT29 stable cells by CD26-shRNA (shCD26), and their respective control cells (scramble) were orthotopically implanted into the cecal wall of NOD-SCID mice. The development of primary tumor and liver metastasis was investigated after 1 month. All the mice developed primary tumor at cecum (Figure 2A). Visible nodules were observed in the liver of 5 out of 6 mice in the HT29-control group, suggesting the presence of liver metastasis, whereas only 1 out of 6 mice in the HT29-shCD26 group showed such nodule (Figure 2A). Figure 2B shows the level of CD26 in liver metastasis of scramble and shCD26 cells. The development of liver metastasis was confirmed by H&E and anti-human Ki67 staining (Figure 2B). These results revealed that the metastatic potential of CRC cells was significantly impaired by CD26 repression (Fisher’s exact test, p = 0.003).
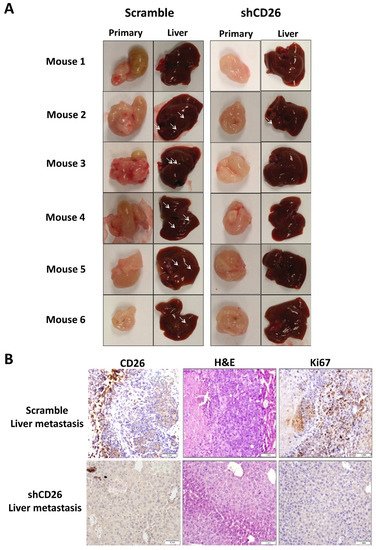
Figure 2. CD26 knock-down impairs CRC metastasis in mouse model. (A) HT29 cells with CD26 stably knock-down by retroviral-based method (shCD26) showed reduced ability to form metastatic liver nodules in immunodeficient mice when compared with the scramble group. White arrows indicate a potential tumor nodule on the liver. (B) Representative picture showing CD26 (left) level in liver metastasis of shCD26 and scramble groups. H&E (middle) and anti-human Ki67 (right) staining confirmed presence of liver metastasis. The scale bars correspond to 1 mm.
Furthermore, to evaluate the effect of CD26 on angiogenesis in a CRC tumor, we measured the number of blood vessels in the primary tumor from the shCD26 group and the scramble control group. The total number of blood vessels was determined in H&E-stained sections in 8 random fields in high-power microscopic fields (×40) by counting vascular structures based on typical morphological appearance and the presence of the counted vascular lumen and intraluminal red blood cells (indicated by arrows). The number of blood vessels was significantly reduced in shCD26 group when compared to scramble control group (Figure 3A,B). In addition, the expression of VEGF which is an important signaling protein involved in both vasculogenesis and angiogenesis was also significantly reduced in the shCD26 group (Figure 3A,B). These results demonstrated that CD26 repression impaired angiogenesis in CRC.
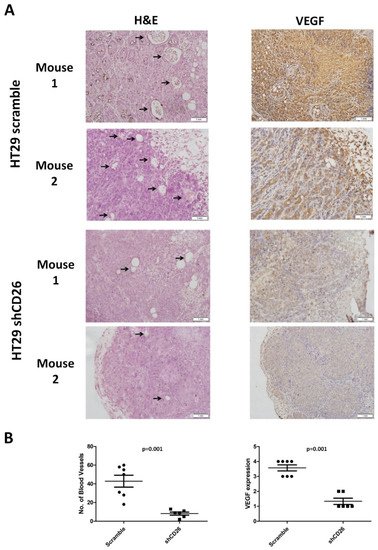
Figure 3. CD26 knock-down impairs CRC angiogenesis in mouse model. (A) Two representative photographs from scramble control and shCD26 group showing the blood vessels (indicated by arrows) formed in hematoxylin and eosin (H&E)-stained sections of primary tumor (left) and the expression of VEGF which is an important signaling protein involved in both vasculogenesis and angiogenesis (right). The scale bars correspond to 1 mm. (B). Dot plotted graphs showing lower number of blood vessels (left, average of 8 random fields at 40× magnification) and lower VEGF level (right) in the shCD26 group.
5. Gene Expression Profiling Revealed Elevated MMP1 in CD26+ Cells
In order to identify the underlying molecular mechanisms associated with CD26-mediated tumor metastasis and angiogenesis, we performed genome-wide mRNA expression array to identify dysregulated genes between CD26+ and CD26− HT29 cells. A total of 7902 differentially expressed genes were identified, including 3255 upregulated genes and 4647 downregulated genes. Certain genes related to pluripotency including SOX2, SOX4, CD133, CXCR4 and CD44 [10]; and genes associated with epithelial to mesenchymal transition (EMT) such as ZEB2 and SNAI1 were upregulated. These preliminary findings reaffirmed the association of CD26+ CRC cells with stem cell properties and activation of EMT process.
Notably, we found consistent upregulation of MMP1 in CD26+ HT29 cells. MMP-1 is a collagenase that degrades ECM, specifically targeting type I, II and III collagens, the major components of the interstitial stroma, and is required for angiogenesis [11]. In CRC, MMP-1 expression correlates with the level of invasion, lymph node involvement, metastasis and poor prognosis [12,13]. To confirm the association between CD26 and MMP1, we performed qPCR to determine the level of MMP1 in CD26+ and CD26− HCT116 and HT29 cells. As shown in Figure 4A, the level of MMP1 in CD26+ cells was 6- and 14.7-fold higher than in CD26− cells for HT29 and HCT116, respectively.
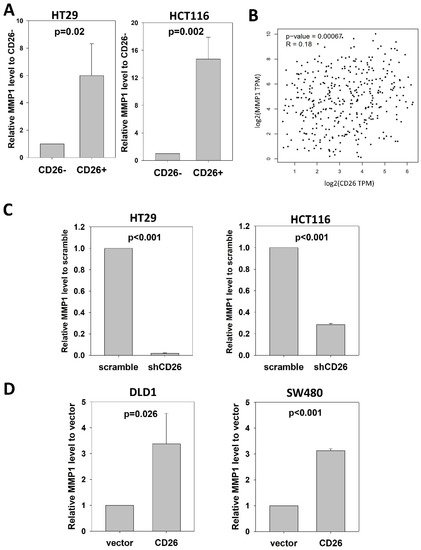
Figure 4. CD26 regulates MMP1 expression in CRC cells. (A) Relative MMP1 level in CD26− and CD26+ cells of HT29 and HCT116 cell lines. (B) CD26 level was positive correlated with MMP1 in CRC specimens from TCGA database. (C) Stable CD26-repressed cells (shCD26) of HT29 and HCT116 showed lower MMP1 level. (D) Stable CD26-overexpressed cells of DLD1 and SW480 showed higher MMP1 level.
We further analyzed whether CD26 was associated with MMP1 in CRC specimens (Figure 4B). Expression level of CD26 and MMP1 in CRC specimens from TCGA was analyzed at GEPIA (http://gepia2.cancer-pku.cn/#index (accessed on 23 November 2021)), which showed that CD26 was positively correlated with MMP1 level in colon and rectum cancer (R = 0.18, p = 0.00067).
The positive association between CD26 and MMP1 suggests that MMP1 is involved in CD26-induced tumor progression effects in CRC cells.
6. CD26 Functionally Regulated MMP1 Expression through CAV1
To investigate whether CD26 functionally induced MMP1 level in CRC cells, we perform qPCR to determine the level of MMP1 in shCD26 and scramble control of HT29 and HCT116 cells. MMP1 was significantly reduced following CD26 repression, which was ~0.02- and ~0.28-fold when compared to scramble control for HT29 and HCT116 cells, respectively (Figure 4C). In addition, we studied the effect of CD26 on MMP1 by determining the MMP1 level in DLD1 and SW480 CD26-overexpressed and vector control cells. Following CD26 overexpression, the level of MMP1 was ~3.4- and ~3.1-fold induced when compared to vector control for DLD1 and SW480 cells, respectively (Figure 4D).
CAV1 has been reported to negatively regulate the expression of MMP1 [14]. Our mRNA expression array demonstrated lower CAV1 level in FACS-sorted CD26+ HT29 and HCT116 cells when compared to the CD26− counterparts. In addition, our qPCR results showed that CAV1 was up-regulated in the HT29-shCD26 cells when compared to the scramble control cells (Figure 5A), indicating that CD26 functionally repressed the level of CAV1. Hence, we hypothesized CD26 regulated MMP1 level via CAV1. In line with our hypothesis, transient overexpression of CAV1 in DLD1 stable CD26 cells abrogated the MMP1 induction effect by CD26 overexpression (Figure 5B).
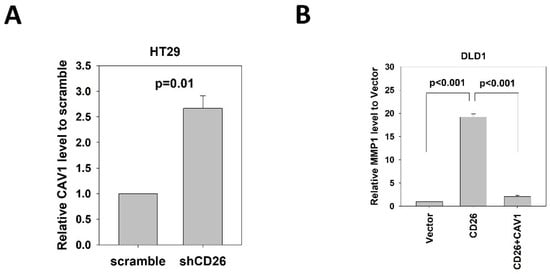
Figure 5. CD26 regulates MMP1 expression through repression of CAV1 in CRC cells. (A) QPCR revealed that CAV1 level was induced in HT29 cells following stable repression of CD26 (shCD26) compared to control (scramble transfected cells). (B) Relative MMP1 gene level in control (vector), CD26 overexpressing cells (CD26) and CD26 overexpressing cells with transient overexpression of CAV-1 of DLD1 cells. The induction of MMP1 by CD26 overexpression was abrogated by following CAV1 overexpression.
These findings demonstrated that CD26 induced the expression of MMP1 through repressing CAV1.
This entry is adapted from the peer-reviewed paper 10.3390/ijms23031181
This entry is offline, you can click here to edit this entry!