Wearable devices use sensors to evaluate physiological parameters, such as the heart rate,
pulse rate, number of steps taken, body fat and diet. The continuous monitoring of physiological parameters offers a potential solution to assess personal healthcare. Identifying outliers or anomalies in heart rates and other features can help identify patterns that can play a significant role in understanding the underlying cause of disease states. Since anomalies are present within the vast amount of data generated by wearable device sensors, identifying anomalies requires accurate automated techniques. Given the clinical significance of anomalies and their impact on diagnosis and treatment, a wide range of detection methods have been proposed to detect anomalies. Much of what is reported herein is based on previously published literature. Clinical studies employing wearable devices are also increasing. In this article, we review the nature of the wearables-associated data and the downstream processing methods for detecting anomalies. In addition, we also review supervised and un-supervised techniques as well as semi-supervised methods that overcome the challenges of missing and un-annotated healthcare data.
1. Introduction
The assistance of wearable technologies in monitoring healthcare is revolutionizing the medical field. The emergence of wearable devices has allowed real time monitoring of vital signs, including the heart rate, number of steps taken and other parameters, such as calories and elevation [
1]. These devices enable the continuous and longitudinal monitoring of the above-mentioned physiological parameters. The advantage of such a system is that it can be used anywhere and at any time.
Given the clinical significance of wearable devices and the associated physiological parameters that are measured, wearable devices likely can play a role in reducing health check-up costs and unwanted burden on the already overloaded healthcare programs around the world. The role of wearables in the future of precision health is currently being developed on a large scale [
2]. To obtain an overview of the number of studies in the field of wearables, a keyword-based search was performed. The term “wearable sensors healthcare monitoring” was searched using the Google Scholar database (accessed 18 October 2021). We observed that the number of wearables-related studies has significantly increased within the last two decades (
Figure S1).
The increase in wearables-associated studies published in the last few decades indicates a growing interest in wearable applications and efforts in advancing the data analysis associated with this field. The growing trend observed here also indicates the growth of the wearables market with several companies now developing biosensors for monitoring physiological parameters.
Several smart wearable devices and/or applications ranging from smart clothes, skin devices and other gadgets have been developed [
3]. Popular clinical and research-grade wearable sensor technologies are being manufactured by Ava Science, Abbot, Zoll and Medtronic, among others. These manufacturers have also been approved by the United States (US) Food and Drug Administration (FDA). Among them is also Fitbit
®, which has the largest user base along with Jawbone
®. These devices have shown good performance in terms of accuracy of user physiological parameters, which has led to them being employed for various scientific studies.
Apart from these devices, the Apple
® Watch 2, Samsung Gear S3
®, Xiaomi Mi
® and Huawei Talk Band B2
® are other wearable devices that provide health care monitoring [
4,
5]. In addition to these established names in the wearables industries, there are several manufacturers that assemble devices, including Welch Allyn, Scanadu Scout and iHealth-finger. These latter firms have even been utilized in clinical studies [
6]. Deemed a medical revolution, these devices provide continuous longitudinal monitoring.
Data processing of physiological parameters, such as heart rate, blood pressure and body temperature, recorded by the wearable devices, can provide a clinical yield that may play a role in assessing patient health. The continuous availability of the aforementioned features within well-defined time and date frames increases the availability of multiple unique patient data points individually as well as for larger population groups. In addition, such continuous monitoring may foster more efficient and reliable diagnoses.
2. Overview of Anomaly Detection
In addition to the enormous value of heart data, other physiological data that can be collected from wearables include steps, blood pressure, the respiration rate, SpO2 levels, electrocardiogram, calories and skin temperature [
16,
17]. Additionally, various studies have combined capnography, stroke volume, pain, level of consciousness and urine output to accurately determine the associated physiological changes in patients. Recent studies that will be discussed further have shown that there are few traditional vital parameters that are crucial and can accurately evaluate human health.
Heart rate is considered as the standard vital sign indicating changes in cycles of the heart. Recent studies have shown an increase in the usage of this primary attribute to infer various cardiac pathologies [
18,
19,
20]. Evidence is mounting in support of heart rate data to assess cardiovascular disease and its prevention [
21]. A high resting heart rate correlates with an increased risk of coronary artery disease (CAD) [
22]. Even in healthy people, heart rate monitoring gives an insight into normal cardiac physiology.
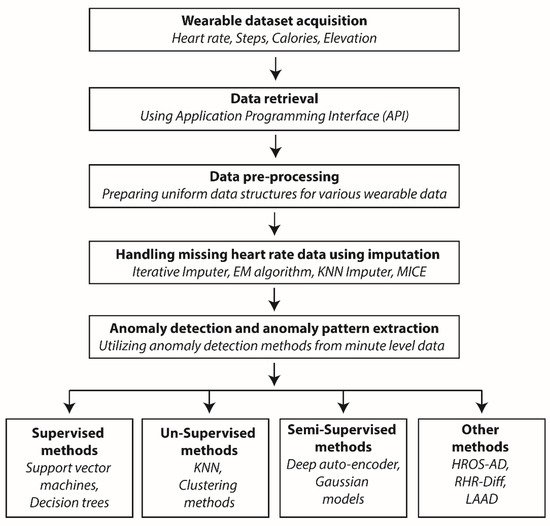
Monitoring healthy individuals is necessary as anomaly detection techniques employ supervised, un-supervised and semi-supervised algorithms, all of which requires continuous temporal data for analysis. Using anomaly detection, the identification of unusual patterns can sometimes be false positives and will not have any medical relevance; hence, the results obtained by anomaly detection methods should always be cross-checked with the electronic health record (EHR) data of the user. A general overview of anomaly detection is described below (Figure 1).
Figure 1. Flow chart describing a general anomaly detection workflow.
The process starts with acquiring data from patient wearable devices, which includes the heart rate and steps. Various API interfaces are available to download this information, and these use secure gateways to retrieve it. The raw data are then pre-processed to ensure all the parameters have a uniform data structure based on timestamps. Data pre-processing is followed by missing data imputation by utilizing various algorithms, e.g., the Expectation-Maximization (EM) algorithm. The processed data are then subjected to various statistical and machine-learning algorithms for anomaly detection.
Anomaly detection can be carried out using several methods as elaborated at the end of the workflow. Some of the methods comprise hybrid methods from statistics, machine learning and data analysis, for example, HROS-AD, RHR-diff and LAAD. The detected anomalies are used to predict and infer clinically relevant information for the user wearing the wearable device. Abbreviations: EM—Expectation Maximization; KNN—K-nearest neighbor; HROS-AD—Heart rate over steps anomaly detection; RHR-Diff—Resting Heart Rate difference; LAAD—Long Short-Term Memory Network-based autoencoder; and MICE—Multivariate imputation by chained equations.
2.1. Noise and Outliers
Anomaly detection is strictly distinct to noise in the data. As the word suggests, noise is a phenomenon that is of no interest to data analysis and must be removed before anomaly detection is carried out. Considering a subjective judgement, the designated deviation for a point to be called an outlier in real applications is a difficult task. The anomalies can be embedded in a huge amount of noise, and it is noteworthy that even an outlier should be considered an abnormality/noise. The problem with noise in data is far worse for electronic health records since very little information is available on the patient’s whereabouts, which is required to associate the physiological parameters.
Under such conditions, noise is considered a weak outlier, and its detection algorithms use quantifiable methods, such as the nearest neighbor algorithms [
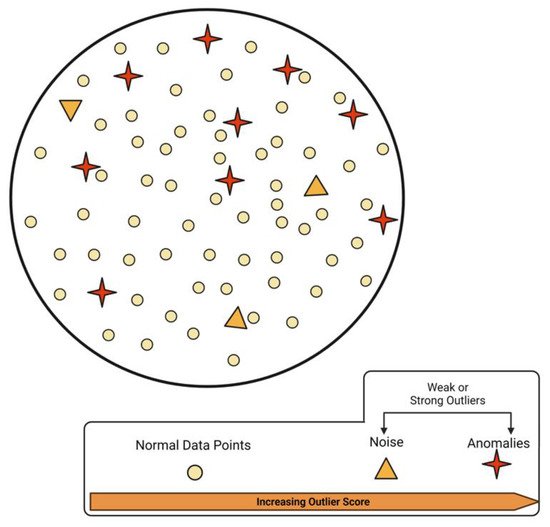
23]. Since wearable data comprises continuous time series data points, careful evaluation is required for the distinction between normal data, anomalies and noise. However, some studies suggest that even the outliers may contain valuable information [
24]. Raw data comprised of multiple components is illustrated in
Figure 2.
Figure 2. A schematic of normal, anomaly and noise data mixed in a wearable dataset.
These data instances require meticulous differentiation for further processing as discussed by Aggarwal (2017) [
23].
In wearables-associated data, the distinction between normal and other data types is primarily performed using machine-learning-based techniques.
Various statistical tests along with proximity models provide a good approximation for differentiating normal data points from the rest [
24]. Furthermore, the knowledge of outlier detection also requires understanding of the different machine-learning-based categories. Studies in anomaly detection problems in the area of finance, climate and internet applications have broadly used supervised, un-supervised and semi-supervised machine-learning approaches [
25,
26].
Semi-supervised methods have been successful and applications in the above fields have displayed methods, including the Mahalanobis distance [
27], Cook’s distance [
28], Tukey’s method [
29], Z-score [
30] and K-means [
31] and K-medoids [
24].
However, there are a few challenges to be addressed before considering anomaly detection from wearables-associated data. First, defining a region of anomaly is often in the boundaries of normal patterns. Under such situations, normal physiological behaviors can often be masked as anomalous and vice versa. Secondly, in the case of heart rate data, normal behavior might evolve, which can be otherwise represented in the absence of adequate knowledge of underlying physiological changes. Another important challenge is the unavailability of labelled data, which is usually used for training or validation processes. Under such conditions, appropriate modifications in the above-mentioned algorithms, as elaborated in
Section 4 of this article, are required.
2.2. Data Types
The data collected from wearables can be an object, point or vector among others. The data can have attributes that can be binary, continuous or categorical. These data can have a relationship with each other in the form of sequence data, spatial data and graphical data. The anomaly points from these data can be divided into point anomalies and contextual anomalies. While point anomalies are those instances from the data that are anomalous or those that lie outside the boundary of the normal regions, the latter categorizes points based on a specific context. They may be deemed as an outlier in one instance while being normal in another [
32].
The contextual anomalies are dependent on the structure of the data set and anomalies detected from time series data are a prominent example. Another group, called collective anomalies, is the occurrence of points that are not anomalous by themselves but occur as a collection of points as seen in cases where the data instances are related [
33]. In a particular study, Chandola et al. (2009) introduced an example of human electrocardiogram output in which a region of low value existed for a large time period. In such cases, this abnormality was not characterized as an anomaly.
Labels provide additional information about each instance in the wearables data. A significant feature of advanced wearable devices is the availability of several features that can enhance the value of each point. Along with heart rate, information on the number of steps, calorie consumption and temperature can aid the anomaly detection methods. Retrieving these labels, however, poses a challenge [
34]. The best practices in anomaly detection include associating wearable devices data with patient health records, which can annotate each instance of heart rate, steps, calorie consumption etc., into medically relevant information clusters [
35]. However, obtaining such data from health care management systems depends heavily on accurate measurements and a thorough knowledge of the underlying mechanisms.
2.3. Data Pre-Processing
Wearable devices, based on their capability, can detect various physiological measurements from their users. These include heart rate, steps, calories burned, elevation and various activity summary data at the seconds and/or minute levels. Several wearable manufacturers have also made available dedicated servers for storing the user information, e.g., Fitbit
® stores user data in their servers. The raw data can be accessed via an application programming interface (API) and user authentication [
36]. Once downloaded, these files can be converted into programmable formats for further processing.
The most popular among these are comma-separated values (CSV) files due to their pre-dominance in the data landscape [
37]. The wearable data, which includes all the physiological properties described above, can be downloaded for each day separately. These intraday data are typically processed in order to achieve uniform date–time stamps. The anomaly detection pipelines have different requirements based on their usage. Although, all of them need the heart rate and the corresponding time frames, which has to be built accordingly.
Machine-learning-based methods generally require one file with all the physiological annotations that could be extracted from the device. These methods are mostly unsupervised and are capable of predicting accurate anomalies from user data. The LAAD framework has been particularly successful in this respect, and this, along with other existing methods, will be elaborated in greater detail in
Section 3. A major challenge in the pre-processing step is filling and/or imputing the missing data [
38], which is detailed in the following section.
2.4. Missing Data and Data Imputation
The physiological data from daily activities gathered from wearable devices at a highly detailed level can yield accurate clinical information. However, retrieving continuous wearables data is a difficult task due to inherent “missing data” challenges. There can be a number of reasons why data is missing from a wearable device.
For example, instrument malfunctions as well as inconsistencies in extracting all of the data due to abrupt wearing behaviors constitute a few of the reasons [
39]. Imputing missing data may be suspect and draw great attention to the validity in time-series data analysis. Missing data can be categorized into three types based on the likelihood of being missing; missing completely at random (MCAR), missing at random (MAR) and missing not at random (MNAR). In MCAR, no difference exists between data sets with missing data and those with no missing data.
Missing data caused due to power loss in the wearable device is a loss of information, which is due to random chance. In the case of MAR, there is a pattern where the data would be missing based on the time period when the battery is still active. If the data were missing only on that specific time of day, it would be considered missing at random. It is assumed that, in the case of MAR, the missing data can be evaluated from the remaining values, i.e., we still have the information about the instance of the missing data. Here too, the missingness depends on the data we observe.
Here, the probability of the missing data is the same within certain specified instances. In both MAR and MCAR, we have a good chance of recovering the missing data. However in MNAR, the source of missing data is known, and yet, a mechanism to effectively retrieve it does not exist [
40]. Wearable devices could be removed because of various reasons and sometimes even purposely, which could lead to MNAR. When the data follow a MCAR or MAR distribution, the observed data are still representative of the population, unlike the MNAR. The chief principle of identifying the appropriate category of missing data is so that no one fills in missing data unnecessarily.
Omitting the missing data can directly lead to biased estimates. Hence, data imputation presents the alternative by estimation based on knowledge from data and predicting the values. The approaches to handle missing data are broadly distinguished into statistical imputation methods and imputation mechanisms that are integrated with machine-learning algorithms. One of the most basic methods of missing data imputation is mean value imputation.
In this method, the empty instances are filled using the mean values from the available observed data. However, this method is unable to preserve the relationship between variables. Since the imputation in this case are estimates, there will be associated errors, which will lead to committing type I errors, in which case, the null hypothesis will be rejected although accurate. Although there are several methods for handling missing data, two of the widely used approaches include the maximum likelihood (ML) and multiple imputation (MI) methods.
The maximum likelihood method is considered to be more efficient due to multiple reasons, including the minimum sampling variance, consistency in the results produced and one uniform model. On the other hand, the multiple imputation method requires several decisions and imputation models, etc. Hot deck imputation is a simple and effective method of imputing values from the observed set of a similar unit, i.e., imputing values using values from the same set. This method is not as developed as the other methods, and its applications may have challenges which are yet to be studied in detail.
The multivariate imputation by chained equations (MICE) method imputes data using assumptions like MAR and MCAR [
41]. The iterative series of the prediction models employs multiple variables to impute the missing variable making it highly robust. This is particularly useful for imputing values belonging to variables with good correlation. Bootstrapping along with multiple imputation using expectation maximization (EMB) is a robust method. This method is known to be effective for up to 30% missing data and is far superior to single imputation methods which do not consider the uncertainty of the predicted missing value as they are obtained using the mean, median or mode as opposed to the machine-learning-based methods, such as MICE.
3. Prospects
3.1. Handling and Transparency of Wearables Associated Data
Extracting clinically relevant outputs from wearables-associated data has several key requirements. The anomaly detection algorithms discussed above have all greatly benefited from the availability of large wearable datasets; hence, the development of data repositories should go hand in hand. A slow but steady shift from hospital-based care to patient-centric care is being observed worldwide. This, along with an increasing popularity of wearables, is slowly leading toward a data surge [
87,
88]. Tracking the progression of any disease state demands uninterrupted wearables-associated data points, which is beyond the scope of hospital care.
Such longitudinal data collected over large time periods on a daily basis can amount to data accumulation. The analytical usage of this data, as it has been discussed throughout this current review article, depends on approaches to access and distribute the data. The development of wearables-associated software directed at both accurate health monitoring and state of the art data collection, analysis and visualization is of the utmost importance [
89]. Both standalone and hybrid methods for anomaly detection require accurate interpretations that can be correlated with the user activity and their daily experience.
Generating recommendations includes decision making by the users and goal synchronization, both of which may require platforms in addition to mobile applications. Existing recommendations regarding the correlation of various variables from the device should be put to the test. For example, exercise and sleeping are independent variables, which, when correlated can conceal the underlying physiological anomaly. Additionally, statistical significance on relationships should leave enough room for practical significance, which arises with the increase in data.
Anomaly detection methods also needs gold-standard data against which to compare the generated results. Databases, like the UK Biobank [
90], and other similar libraries with cohort studies can be very useful in comparing standalone wearables-associated studies. Another important area is the transparency of algorithms designed to compute steps or sleep data, which should be encouraged. The limitations of the large-scale data generated from wearables need to be addressed more often [
89].
3.2. Application of Wearables in Healthcare
The impact of COVID-19 has renewed everyone’s interest towards novel healthcare solutions. Wearables-technology and its adoption is significantly increasing in awareness among the public. Wearables are already being integrated into clinical practices. The vital signs, such as heart rate, temperature, blood pressure and blood oxygen saturation, measured by the wearable devices are carefully being used for clinical applications. The extraction of useful health-related markers is slowly making its way into mobile health-related interventions [
90].
Intensive care units (ICU) have reported many benefits by employing wearables in making precise medical decisions. Heart rate and sleep measurements have helped manage post-ICU care. Patients recovering from major surgeries and associated stress can benefit from a continuous monitoring of their physiological changes. Heart rate and sleep are often associated with pain levels and underlying recovery.
Wearables-derived data employed with machine-learning algorithms can, therefore, provide accurate patient monitoring. A wide array of disorders is now being brought under the investigation paradigm of wearables. Metabolic disorders are marked by high blood pressure, blood sugar and abnormal cholesterol, among other conditions. With advancements in non-invasive monitoring of such conditions, the management and control of disease becomes easier [
7,
42]. Efforts are being made to monitor and diagnose hypertension by measuring blood pressure longitudinally over time. Blood pressure monitoring can be helpful for many associated primary conditions [
91,
92].
Additionally, sleep disorders, mental health, maternal and neo-natal care require active tracking; they can benefit from wearable technologies. Monitoring patient fitness has allowed for a better understanding of the before and after disease states. Such initiatives have afforded significant observations in various disease models. In case of cancer treatments, analyzing biometric data from wearables can be used to predict pain levels, stress etc. Similarly, activity and sleep data have been collected and employed to predict migraine attacks.
Monitoring energy expenditure in cardiac patients can be crucial in their rehabilitation. A Fitbit wearable-based clinical trial was able to assess the improvement in the physical activity of patients with chronic heart failure and coronary artery disease. Similarly, in demonstrating the effectiveness of a fitness tracker for children with deep vein thrombosis, a research team employed Fitbit devices to evaluate the physical activity in patients [
95]. Several such studies are proving that wearables are robust healthcare monitoring devices.
3.3. Impact of Wearables on Managing Healthcare
Steady improvements in algorithms for anomaly detection are being made. Simultaneously, large datasets have been made available to improve the predictability. Wearables and the data analysis are thus connected to certain key areas, such as the cloud and data security. The internet connection, in particular Wi-Fi, helps in communication between wearable devices with hand-held devices, such as smart phones and the cloud.
The development of a dedicated cloud infrastructure for storage and analyzing data can enhance wearables usage in healthcare. The security of these devices is another aspect to be considered. A systematically regulated online cloud infrastructure along with device-to-device connectivity is necessary in digital healthcare framework [
96]. These factors can eventually help in the application of wearables-associated big-data and accurate anomaly detection for studying disease pathogenesis.
Smartphones and other hand-held devices are typically used for obtaining and transmitting information collected from the wearables. An integrated system would be useful in managing disease states. Carefully detected anomalies with medical relevance can be translated into knowledge which can then be instrumental in handling a global health crisis. The COVID-19 pandemic has certainly shifted the thrust towards the need for a more digital or telemedicine-based healthcare system. The pandemic saw a rise in tele-consultations.
Under such situations, wearable devices can provide health parameters, which are otherwise collected during patient’s clinical visits. The primary health data collected in this way is already being used to assess chronic diseases. Tracking heart rate and other primary parameters has proved helpful in the past to develop models for the spread of influenza [
97]. Such physiological tracking studies have been initiated by The Scripps Research Translational Institute along with Fitbit
®, Apple
® Watch and Garmin
® devices [
98].
This entry is adapted from the peer-reviewed paper 10.3390/s22030756