Characterization of Ti/SnO2 Interface by X-ray Photoelectron Spectroscopy: History
Please note this is an old version of this entry, which may differ significantly from the current revision.
Contributor:

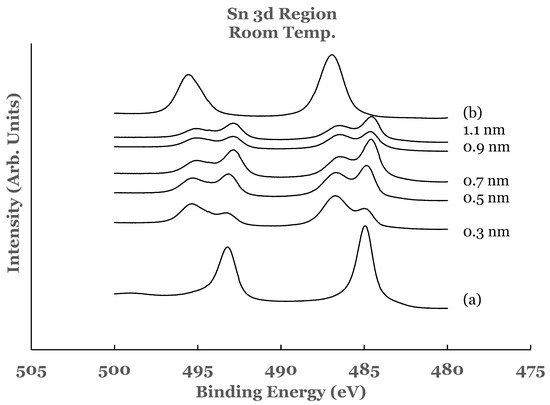
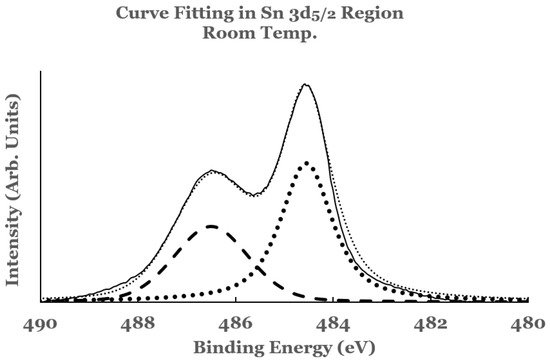
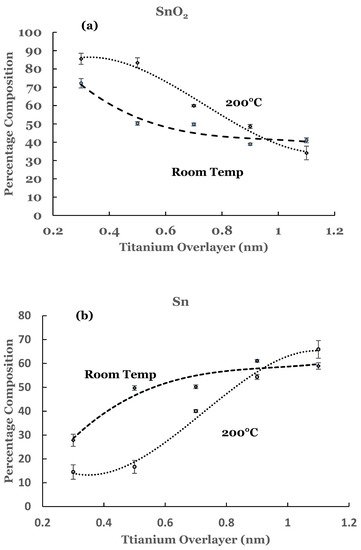
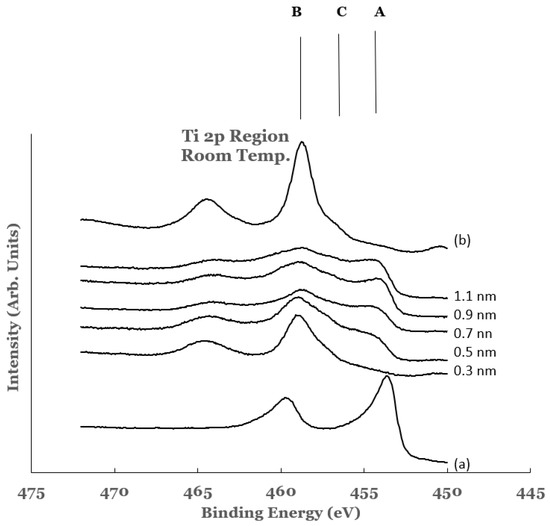
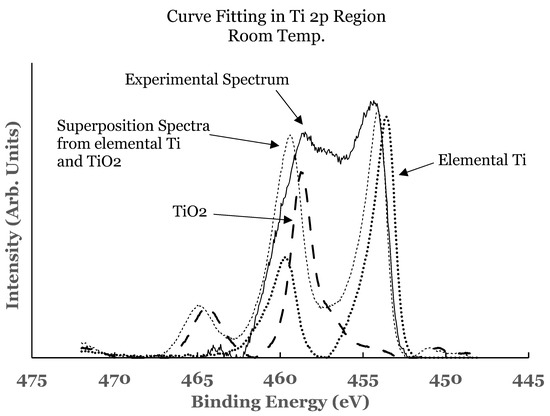
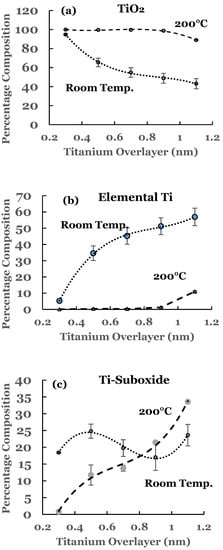
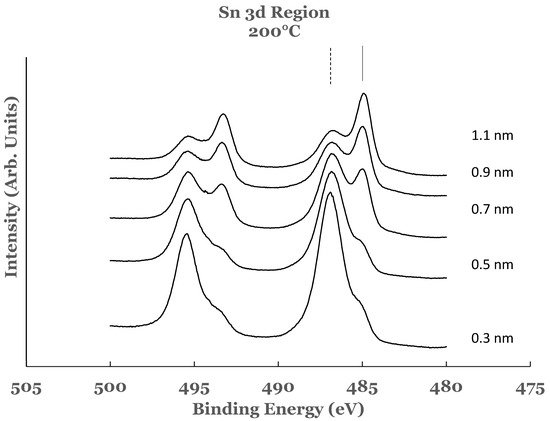
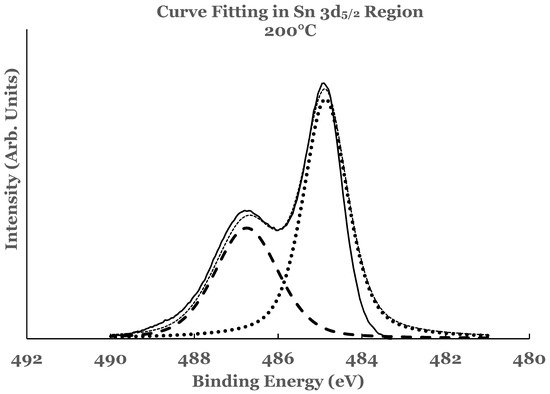
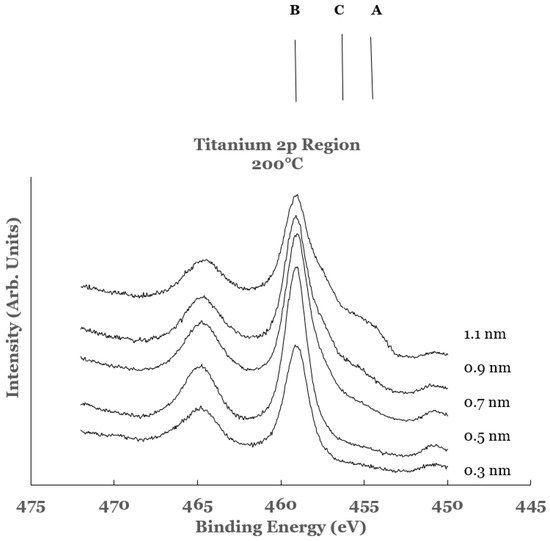
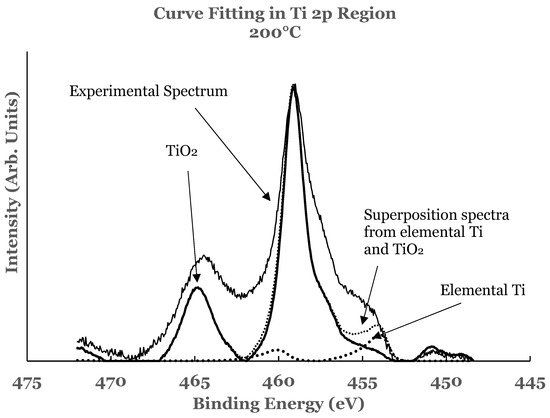
The Ti/SnO2 interface has been investigated in situ via the technique of x-ray photoelectron spectroscopy. Thin films (in the range from 0.3 to 1.1 nm) of titanium were deposited on SnO2 substrates via the e-beam technique. The deposition was carried out at two different substrate temperatures, namely room temperature and 200 °C. The photoelectron spectra of tin and titanium in the samples were found to exhibit significant differences upon comparison with the corresponding elemental and the oxide spectra. These changes result from chemical interaction between SnO2 and the titanium overlayer at the interface. The SnO2 was observed to be reduced to elemental tin while the titanium overlayer was observed to become oxidized. Complete reduction of SnO2 to elemental tin did not occur even for the lowest thickness of the titanium overlayer. The interfaces in both the types of the samples were observed to consist of elemental Sn, SnO2, elemental titanium, TiO2, and Ti-suboxide. 

  • tin
  • titanium
  • tin oxide
  • X-ray photoelectron spectroscopy

1. Introduction

Tin oxide (SnO2) has attracted significant attention due to its interesting properties. It is proving to be a possible alternative to TiO2 as an electron transporting layer in perovskite solar cells. The oxide has a lower crystallization temperature than that of TiO2. The TiO2 film requires a high annealing temperature (>450 °C) to obtain high quality films. This increases both the possibility of chemical interaction with the underlying substrates and interdiffusion [1][2]. The lower formation temperature makes it easier to crystallize and dope the tin oxide. Many materials as dopants (such as Mg, Li, Al, and Sb) to SnO2 have been investigated [3][4][5][6]. Tin oxide therefore becomes suitable for use in flexible solar cells, tandem solar cells, and large-scale commercialization at a lower cost [7][8][9]. It has been found to have excellent chemical stability, UV-resistance, and good antireflection as compared to TiO2. For example, Yahi et al. [10] have reported the average transmittance of SnO2 films to be around 80%. These properties increase the stability and lifespan of the devices [11].
The tin oxide and titanium oxide (TiO2) have found applications as gas sensors [12][13][14][15][16], photocatalysts [17][18][19][20][21], photovoltaic [22][23][24], optoelectronics [25][26][27][28], etc. Nanocomposites of these two oxides have found use in technological applications in various fields [29][30][31][32][33][34][35][36]. To increase the photocatalytic activity of photocatalysts, creation of nanocomposite of these two oxides (SnO2 and TiO2) represents a promising method. These two oxides bear some resemblance in terms of their material properties such as their structure, wide band gap, high transmittance, multi-valency state, and high melting point. SnO2 plays an essential role in nanocomposite structures with TiO2 due to the production of more hydroxyl radicals in such a composite compared to other oxides such as ZnO, WO3, and Fe2O3 [37]. A wide range of properties that could be obtained in the TiO2-SnO2 nanocomposites depend upon their synthesis method and precursor type. Several studies have been focused on the creation of TiO2-SnO2 nanocomposites in order to increase their photoactivity. Various methods used for the creation of the nanocomposites include sol-gel [38][39][40][41], hydrothermal synthesis [42][43], chemical vapor deposition [44], spray and laser pyrolysis [45][46][47], coprecipitation [48][49], and green [50]. The significant differences that exist between the present investigation and those employed by other researchers lie primarily in the method of preparing the Ti/SnO2 interface. In the present investigation, thin films of tin and titanium were deposited by the technique of electron-beam evaporation. Since the depositions have been carried out under high vacuum, such a method of preparation provides a contaminant free specimen.
In the present investigation, the chemical reactivity at the titanium-stannic oxide (Ti/SnO2) interface has been investigated as a function of the thickness of the titanium overlayer and the substrate temperature. Thin films of titanium were deposited onto the stannic oxide substrate. The deposition of the titanium overlayer was performed under two different processing conditions: the substrate kept at ambient temperature and at 200 °C during the deposition. The 200 °C temperature was chosen in order to view significant changes at the interface. The interfaces have been characterized in situ by the technique of XPS. This technique is sensitive to the changes in the chemical states and thus becomes suitable for this investigation [51].

2. Room Temperature Deposition

2.1. Sn 3d Region

In order to analyze the experimental data from the Ti/SnO2 interface, spectral data from elemental tin and tin oxide were recorded. For this purpose, a 20 nm thick film of tin was deposited on a silicon substrate at room temperature. The spectrum from this sample is shown as curve (a) in Figure 1. In this spectrum the 3d5/2 and 3d3/2 core level peaks are observed to be at BE values of 484.95 and 493.18 eV, respectively. These values are in agreement with those reported for elemental tin by other researchers [52][53]. The spectrum indicates that under the deposition conditions used in this investigation, tin gets deposited as elemental tin on silicon. The tin oxide (SnO2) was formed by oxidizing a similar sample of tin in a quartz tube furnace. The spectrum obtained from this sample is included as curve (b) in Figure 1. The core level peaks obtained from the SnO2 sample are seen to be shifted to the high BE side as compared to those for elemental tin. The BEs of the 3d5/2 and 3d3/2 core level peaks in this curve are measured to be 486.93 eV and 495.56 eV, respectively, and are in agreement with those reported by other researchers [52][53].
Figure 1. Spectral data in the Sn 3d region as a function of the thickness of the titanium overlayer. The overlayer was deposited at room temperature. Curve (a) corresponds to elemental Sn while curve (b) corresponds to SnO2.
Figure 1 also includes the high resolution spectra in the 3D region of tin obtained from the Ti/SnO2 interfaces for the different thicknesses of the titanium overlayer. These spectra are normalized to have equal intensity at 482 eV. The normalization of the spectra facilitates comparison for increase or decrease in the intensity in the core level region. The spectrum from the 0.3 nm sample shows the presence of a shoulder on the low BE side of each of the tin oxide core level peaks. Upon comparison with the elemental spectrum, the presence of this shoulder is attributed to the presence of elemental tin at the Ti/SnO2 interface. The spectral features therefore indicate that the room temperature deposition of the 0.3 nm overlayer of titanium on SnO2 results in the partial reduction of the oxide into elemental tin. This is corroborated by the investigation of the 2p region of titanium in these samples, as explained later in this paper.
The spectral data from the 0.5, 0.7, 0.9, and 1.1 nm thick titanium overlayers are similar to those observed for the 0.3 nm sample. In all of these samples, there is no change in the shape of the spectral features. The intensity of the core level peaks corresponding to SnO2 is observed to decrease while that due to elemental Sn to increase as a function of the thickness of the titanium overlayer. Only a partial reduction of SnO2 is observed even with the lowest thickness of the titanium overlayer.
To estimate the amounts of the SnO2 and elemental Sn present at the interface, a curve fit was carried out to the spectral data. An example of curve fit is given in Figure 2 for the 1.1 nm sample. A Shirley background was subtracted from the spectrum before the curve fit. The elemental and the oxide spectra were scaled to match the spectral data from the sample. The relative percentages of SnO2 and elemental Sn were determined from the areas under the corresponding fitting curves, normalized to the total area of the 3D peak. Plots of the percentage composition of SnO2 and elemental Sn thus determined as a function of the thickness of the titanium overlayer are shown in Figure 3a,b. The dashed lines serve as a guide to represent the trend in the data. From these figures it is observed that SnO2 shows a decreasing trend while elemental Sn shows an increasing trend with the increase in the titanium overlayer. The decrease in SnO2 is significant until 0.5 nm Ti overlayer and then it becomes gradual for thicknesses greater than this. This can be understood from the amount of titanium available to interact with SnO2 at the interface. Till 0.5 nm thickness, significant amount of titanium interacts with SnO2. As the thickness increases, the underlying layers prevent further interaction with the SnO2 substrate. The study therefore indicates the presence of SnO2 and reduced elemental tin at the Ti/SnO2 interface.
Figure 2. Curve fit for the 3d5/2 region of tin for the 1.1 nm titanium overlayer deposited at room temperature. The thin solid line represents the experimental data. The thick dotted line represents the spectrum from elemental Sn while the thick dashed line that from SnO2. The thin dotted line represents the superposition from elemental Sn and SnO2.
Figure 3. (a) Percentage composition of SnO2 as a function of the thickness of the titanium overlayer in the two sets of samples, and (b) percentage composition of elemental Sn as a function of the thickness of the titanium overlayer in the two sets of samples. The lines serve as a guide for the trend in the data. The error bars are also included.

2.2. Ti 2p Region

The titanium 2p region in the samples investigated are shown in Figure 4. The spectra are normalized to have equal intensity at 450 eV. The data from elemental titanium and TiO2 are also included in this figure. The spectrum of elemental titanium was obtained by depositing about 20 nm of elemental titanium on a silicon substrate (Ti/Si). The spectrum from this sample is shown as curve (a) in Figure 4. The spectral features show BE values of 454.1 and 460.2 eV, respectively, for the 2p3/2 and 2p1/2 core level peaks. These values are in agreement with those reported in literature for elemental titanium [54][55]. The titanium oxide (TiO2) was formed by oxidizing the Ti/Si sample in an oxygen environment using a quartz tube furnace. The spectrum obtained from the oxide is included as curve (b) in Figure 4. The core level peaks in this spectrum are observed to be broader and shifted to the high BE side as compared to those for elemental titanium. The BEs of the 2p3/2 and 2p1/2 core level peaks are measured to be 458.9 and 464.7 eV, respectively. These values are in good agreement with those reported by other researchers for TiO2 [56][57].
Figure 4. Spectral data in the Ti 2p region as a function of the titanium overlayer. The overlayer was deposited at room temperature. Vertical lines represent the positions of the 2p3/2 core level of titanium in the different chemical states of titanium. Line A represents the position of the 2p3/2 core level for elemental Ti, line B that for TiO2, and line C that for Ti-suboxide. Spectrum (a) corresponds to that for elemental Ti while spectrum (b) to that for TiO2.
The 2p region of titanium in all of the spectra from the Ti/SnO2 samples is observed to contain broad spectral features. The presence of these features indicates chemical reactivity at the Ti/SnO2 interface. The features can be divided into three regions: region A (centered around 453 eV), region B (centered around 458 eV), and region C (centered around 456 eV). The intensities in these regions are compared with those from elemental Ti and TiO2 to estimate the extent of the chemical reactivity. Region A corresponds to that from the 2p3/2 core level peak of elemental titanium. It represents the amount of elemental titanium left unreacted from the overlayer. It is observed to increase as a function of the thickness of the overlayer. Region B corresponds to that from the 2p3/2 core level peak of titanium in TiO2. It represents the amount of TiO2 formed at the interface as a result of chemical interaction between Ti and SnO2. In the 0.3 nm sample, larger intensity in region B and a very small intensity in region A are observed. The increase in the intensity in region A and the decrease in the region B for other samples are attributed to the increase and decrease of elemental Ti and TiO2, respectively, at the interface. The spectral data therefore indicate intense chemical reaction at the Ti/SnO2 interface. The amount of unreacted titanium is observed to increase with the increase in the thickness of the Ti-overlayer. The extent of the chemical reactivity at the interface is observed to decrease with this increase.
A curve fitting was also performed in the 2p region to estimate the amounts of the constituents present at the interface. A Shirley background was subtracted from the experimental curve before the curve fit. The spectra from elemental Ti and TiO2 were superimposed on the experimental curve. For this, their intensities were scaled to match one end of the spectrum. An example of such a curve fitting is shown in Figure 5 for the 1.1 nm sample. Due to the asymmetric shape of the core level peaks of titanium, a complete match of the fitted curve with the experimental one was not possible. Any excess intensity of the fitted curve was subtracted from the total area before estimating the percentage concentration. It is evident from this figure that the region C consists of additional intensity. This intensity is due to the suboxide of titanium resulting from incomplete chemical interaction between titanium and SnO2 at the interface. The results therefore show that the interface consists of TiO2, elemental Ti, and Ti-suboxide. The amounts of TiO2, unreacted Ti, and suboxide of Ti have been estimated from the spectral data. The areas under the curves were determined using the trapezoidal method. The relative percentage of each of the constituents was determined from these areas, normalized to the total area of the spectrum. The variations in the percentage of TiO2, elemental Ti, and Ti-suboxide in these samples as a function of the thickness of the titanium overlayer are shown in Figure 6a–c. The lines in these figures represent the guides for the variations. The TiO2 shows an initial decrease followed by saturation beyond the 0.5 nm of the titanium overlayer. The Ti-suboxide and unreacted titanium are observed to increase initially followed by flattening off for the same thickness of the titanium overlayer. These trends are in accord with those observed for elemental Sn and SnO2.
Figure 5. Curve fit for the 2p region of titanium for the 1.1 nm overlayer deposited at room temperature. The thin solid line represents the experimental data. The thick dotted line represents the spectrum from elemental Ti while the thick dashed line that from TiO2. The thin dotted line represents the superposition from elemental Ti and TiO2.
Figure 6. (a) Percentage composition of TiO2 as a function of the thickness of the titanium overlayer in the two sets of samples; (b) percentage composition of elemental Ti as a function of the thickness of the titanium overlayer in the two sets of samples; (c) percentage composition of Ti-suboxide as a function of the thickness of the titanium overlayer in the two sets of samples. The lines serve as a guide for the trend in the data. The error bars are also included.
Different researchers have employed different techniques of curve fitting to quantify the presence of the constituents in a specimen. Saric et al. [58] have investigated the oxidation of cobalt metal by low-energy oxygen bombardment at room temperature. They have estimated the concentration fraction of CoO and Co3O4 in the samples through curve fitting. The 2p3/2 core level of elemental cobalt was fitted with an intense asymmetric peak with two small additional peaks. In the oxidized samples, they observed that at least eight fitting components were required to obtain a good fit. Due to the possibility of the presence of other sub-oxides of cobalt and the overlap of the fitted peaks, their method may not fully account for the fraction concentration of the constituents. Hong et al. [59] have investigated the Fe/CuO interface. They have estimated the amount of unreacted iron and Fe2O3 at the interface by modeling the spectra from the elemental iron and pure Fe2O3. The fitted spectra were calculated with the constraint: x + y = thickness of the deposited overlayer with x being the thickness of the elemental iron and y that for Fe2O3. The values of x and y were varied to get a good fit with the experimental curve. These methods may work if there were no sub-oxides present. In the present investigation, scaling the intensities of the peaks is expected to account for the various components to scale accordingly. Hence, the method of curve fitting employed in the present investigation is suitable for the estimation of the suboxide at the interface.

3. Substrate Temperature (200 °C) Deposition

3.1. Sn 3d Region

The high resolution spectra in the 3D region of tin obtained from the Ti/SnO2 interfaces for the titanium overlayer deposited at a substrate temperature of 200 °C are shown in Figure 7. These spectra are normalized to have equal intensity at 482 eV. The spectrum from the 0.3 nm sample shows the presence of shoulder on the low BE side of each of the tin oxide core level peaks. The presence of this shoulder is attributed to the reduction of SnO2 to elemental tin by the titanium overlayer. The intense peaks in this spectrum are due to the SnO2. The spectral features therefore indicate that the deposition of titanium at this substrate temperature results in the partial reduction of the oxide into elemental tin. The spectral data from the 0.5, 0.7, 0.9, and 1.1 nm thick titanium overlayers are similar to those observed for the 0.3 nm sample. In all of these samples there is no change in the shape of the spectral features. The intensity of the core level peaks corresponding to SnO2 is observed to decrease while that due to elemental Sn to increase as a function of the thickness of the titanium overlayer. As in the previous case, only a partial reduction of SnO2 is observed even with the lowest thickness of the titanium overlayer.
Figure 7. Spectral data in the Sn 3d region as a function of the titanium overlayer. The overlayer was deposited at the substrate temperature of 200 °C. The vertical lines represent the positions of the 3d5/2 core level. The solid line corresponds to elemental Sn while the dashed line to SnO2.
The amounts of SnO2 and elemental Sn at the interface were estimated for these sam-ples also. For this purpose a curve fit to the spectral data was performed as explained ear-lier. An example of curve fit is given in Figure 8 for the 1.1 nm of titanium on SnO2. The relative percentages of SnO2 and elemental Sn were determined from the areas of the cor-responding fitting curves, normalized to the total area of the 3d peak. Plots of the percent-age compositions of SnO2 and elemental Sn, thus determined as a function of the thickness of the titanium overlayer, are also included in Figure 3a,b. The dashed lines serve as a guide to represent the trend in the data. For these samples, a decreasing trend in SnO2 while an increasing trend in elemental Sn are observed with the increase in the titanium overlayer. Some differences exist when comparing these data with the room temperature data. The SnO2 concentration starts from a higher value in such samples and continues to show a decreasing trend for thicknesses greater than 0.9 nm. Similarly, the elemental Sn starts from a lower value and continues to show an increasing trend. The data from these samples therefore suggest that the titanium overlayer continues to interact with the underlying SnO2 layer for thicknesses greater than 0.9 nm. The increased interaction at the interface can be attributed to the thermal diffusion of the titanium overlayer into the underlying SnO2 in such samples. The study therefore indicates the presence of SnO2 and elemental Sn in greater amounts in such samples.
Figure 8. Curve fit for the 3d5/2 region of tin for the 1.1 nm titanium overlayer deposited at substrate temperature of 200 °C. The thin solid line represents the experimental data. The thick dotted line represents the spectrum from elemental Sn while the thick dashed line that from SnO2. The thin dotted line represents the superposition from elemental Sn and SnO2.

3.2. Ti 2p Region

The high resolution spectra in the 2p region of titanium obtained from the Ti/SnO2 interfaces for the titanium overlayer deposited at a substrate temperature of 200 °C are shown in Figure 9. The spectra are normalized to have equal intensity at 450 eV. The spectral features in these samples exhibit considerable chemical reactivity at the Ti/SnO2 interface. The intensity in the region A (centered around 453 eV and corresponds to the 2p3/2 core level of titanium in elemental titanium) is observed to increase for thicknesses greater than 0.5 nm. A large intensity in the region B (centered around 458 eV and corresponds to that from the 2p3/2 core level peak of titanium in TiO2) is observed in all of the samples. The intensity of this spectral feature is observed to decrease with increase in the overlayer thickness. The intensity in region C (centered around 456 eV and corresponds to that from the Ti-suboxide) is observed to increase for thicknesses greater than 0.5 nm. The spectral data therefore indicate intense chemical reaction at the Ti/SnO2 interface. The increase in the amount of unreacted titanium with the increase in the thickness of the Ti-overlayer represents a decrease in the extent of the chemical reactivity at the interface. A decrease in the intensity in region C is observed in these samples when compared with the room temperature data. This is interpreted as an increase in the TiO2 content in such samples resulting from the diffusion of the titanium overlayer into the underlying SnO2 layer.
Figure 9. Spectral data in the Ti 2p region as a function of the titanium overlayer. The overlayer was deposited at the substrate temperature of 200 °C. Vertical lines represent the positions of the 2p3/2 core level of titanium in the different chemical states of titanium. Line A represents the position of the 2p3/2 core level for elemental Ti, line B that for TiO2, and line C that for Ti-suboxide.
A curve fitting was also performed in the 2p region in these samples to estimate the amount of the constituents present at the interface. The details of curve fitting have been outlined earlier. An example of such a curve fitting is shown in Figure 10 for the 1.1 nm sample. It is evident from this figure that the region C consists of additional intensity. This intensity is due to the suboxide of titanium resulting from incomplete chemical interaction between titanium and SnO2 at the interface. The results therefore show that the interface consists of TiO2, elemental Ti, and Ti-suboxide. The amounts of TiO2, unreacted Ti, and suboxide of Ti have also been estimated from the spectral data of such samples.
Figure 10. Curve fit for titanium for the 1.1 nm overlayer deposited at 200 °C substrate temperature. The thin solid line represents the experimental data. The thick dotted line represents the spectrum from elemental Ti while the thick solid line that from TiO2. The thin dotted line represents the superposition from elemental Ti and TiO2.
The variations in the percentage of TiO2, elemental Ti, and Ti-suboxide in these samples as a function of the thickness of the titanium overlayer are also included in Figure 6a–c, respectively. The lines in these figures represent the guides for the variations. The percentage of TiO2 is observed to be around 100% till 0.9 nm thickness of the overlayer. This is followed by a decrease in its concentration beyond this thickness. The thermal diffusion of the Ti overlayer makes more titanium to be available for chemical interaction with SnO2. When compared with the room temperature data, the spectral data for these samples indicate complete oxidation of the titanium overlayer till 0.9 nm thickness. This variation is corroborated by the variation in the percentage for elemental Ti (Figure 6b). The elemental titanium is near zero and shows an increasing trend beyond the 0.9 nm thickness. The trend is markedly different from that of the room temperature data. The unreacted titanium shows a rather sharp increase in the percentage for the first two samples in the case of the room temperature deposition. This increase then becomes gradual for thicknesses beyond 0.5 nm. The variation in the Ti-suboxide is also included Figure 6c for these samples. Significant variation in the percentage is observed for thicknesses beyond 0.5 nm. The room temperature data, on the other hand, shows variation around 20% for all of the samples. The trends are in accord with those observed for elemental Sn and SnO2.
The interfacial reaction between Ti and SnO2 can be understood by considering the Gibbs free energy of the involved products. Gamsjager et al. [60] have compiled the Gibbs free energy data for SnO2 from various sources. The table A-58 in that reference lists a range of values between −367 and −372 kJ/mol. These values have been measured over a temperature range 673–1380 K. Schaefer has also compiled various values (Table 8 in Ref. [61]) from different researchers. For the present investigation, a value of −407 kJ/mol has been used for SnO2. Kim and Kang [62] have listed experimental values of the Gibbs free energy for various titanium oxides. The value of −659 kJ/mol has been used for TiO2 in the present calculation.
The spectral data for the room temperature Ti/SnO2 interface show the interfacial reaction to occur as:
Ti + SnO2  TiO2 + Sn + SnO2 + Ti-suboxide
Titanium exhibits oxidation states of +2, +3, and +4. The Ti-suboxide can therefore be attributed to the presence of Ti2O3 near the interface. The above reaction can then be written as:
5Ti + 4SnO2  TiO2 + 4Sn + 2Ti2O3
Considering the above mentioned Gibbs free energy for the involved constituents (the value for Ti2O3 is −1430 kJ/mol, [63]), the Reaction (2) results in an approximate value for the change in Gibbs free energy as −1891 kJ/mol. This indicates that such an interfacial reaction can proceed thermodynamically.
For the deposition at the substrate temperature of 200 °C, the reaction occurs according to the following equation:
Ti + SnO2  TiO2 + Sn
which is also favored thermodynamically (change in Gibbs free energy is approximately −742 kJ/mol). The data also suggest that TiO2 is more readily formed at the interface when the substrate temperature is increased.
The partial reduction of SnO2 to SnO can also occur according to:
2Ti + 3SnO2  2TiO2 + 2SnO
The value of the Gibbs free energy for the formation of SnO is −253 kJ/mol [64]. This yields a value of −1893 kJ/mol for the above reaction. However, the spectral data indicate that such a reaction is not favorable under the experimental conditions.
The analysis of the data thus provides a picture of the contents at the interface. The oxidized titanium and the reduced tin are present at the interface. As the titanium overlayer increases, the interfacial TiO2 layer serves as a barrier for further oxidation of titanium. Due to less availability of oxygen away from the interface, the subsequent titanium overlayer gets partially oxidized. This occurs until after a certain thickness the titanium overlayer results in the unreacted titanium. The present investigation points to the need for more experiments to establish a correlation between the amount of constituents and the substrate temperatures. The electrical properties of these interfaces can then be explored against particular device applications.

This entry is adapted from the peer-reviewed paper 10.3390/nano12020202

References

  1. Jeon, N.J.; Noh, J.H.; Kim, Y.C.; Yang, W.S.; Ryu, S.; Seok, S.I. Solvent engineering for high-performance inorganic–organic hybrid perovskite solar cells. Nat. Mater. 2014, 13, 897–903.
  2. Liu, M.; Johnston, M.; Snaith, H. Efficient planar heterojunction perovskite solar cells by vapour deposition. Nature 2013, 501, 395–398.
  3. Xiong, L.B.; Qin, M.C.; Chen, C.; Wen, J.; Yang, G.; Guo, Y.X.; Ma, J.J.; Zhang, Q.; Qin, P.L.; Li, S.Z.; et al. Fully High-Temperature-Processed SnO2 as Blocking Layer and Scaffold for Efficient, Stable, and Hysteresis-Free Mesoporous Perovskite Solar Cells. Adv. Funct. Mater. 2018, 28, 1706276.
  4. Park, M.; Kim, J.-Y.; Son, H.J.; Lee, C.-H.; Jang, S.S.; Ko, M.J. Low-temperature solution-processed Li-doped SnO2 as an effective electron transporting layer for high-performance flexible and wearable perovskite solar cells. Nano Energy 2016, 26, 208–215.
  5. Bai, Y.; Fang, Y.; Deng, Y.; Wang, Q.; Zhao, J.; Zheng, X.; Zhang, Y.; Huang, J. Low Temperature Solution-Processed Sb:SnO2 Nanocrystals for Efficient Planar Perovskite Solar Cells. ChemSusChem 2016, 9, 2686–2691.
  6. Chen, H.; Liu, D.; Wang, Y.; Wang, C.; Zhang, T.; Zhang, P.; Sarvari, H.; Chen, Z.; Li, S. Enhanced Performance of Planar Perovskite Solar Cells Using Low-Temperature Solution-Processed Al-Doped SnO2 as Electron Transport Layers. Nanoscale Res. Lett. 2017, 12, 1–6.
  7. Ren, X.; Yang, D.; Yang, Z.; Feng, J.; Zhu, X.; Niu, J.; Liu, Y.; Zhao, W.; Liu, S.F. Solution-Processed Nb:SnO2 Electron Transport Layer for Efficient Planar Perovskite Solar Cells. ACS Appl. Mater. Inter. 2017, 9, 2421–2429.
  8. Xiong, L.B.; Qin, M.C.; Yang, G.; Guo, Y.X.; Lei, H.W.; Liu, Q.; Ke, W.J.; Tao, H.; Qin, P.L.; Li, S.Z.; et al. Performance enhancement of high temperature SnO2-based planar perovskite solar cells: Electrical characterization and understanding of the mechanism. J. Mater. Chem. A 2016, 4, 8374–8383.
  9. Roose, B.; Johansen, C.M.; Dupraz, K.; Jaouen, T.; Aebi, P.; Steiner, U.; Abate, A. A Ga-doped SnO2 mesoporous contact for UV stable highly efficient perovskite solar cells. J. Mater. Chem. A 2017, 6, 1850–1857.
  10. Yahi, A.; Bouzidi, A.; Miloua, R.; Medles, M.; Nakrela, A.; Khadraoui, M.; Tabet-Derraz, H.; Desfeux, R.; Ferri, A.; Blach, J.-F. The relationship between processing and structural, optical, electrical properties of spray pyrolysed SnO2 thin films prepared for different deposition times. Optik 2019, 196.
  11. Jiang, Q.; Zhang, L.; Wang, H.; Yang, X.; Meng, J.; Liu, H.; Yin, Z.; Wu, J.; Zhang, X.; You, J. Enhanced electron extraction using SnO2 for high-efficiency planar-structure HC(NH2)2PbI3-based perovskite solar cells. Nat. Energy 2016, 2, 16177.
  12. Barsan, N.; Schweizer-Berberich, M.; Göpel†, W. Fundamental and practical aspects in the design of nanoscaled SnO 2 gas sensors: A status report. Anal. Bioanal. Chem. 1999, 365, 287–304.
  13. Wang, C.; Yin, L.; Zhang, L.; Xiang, D.; Gao, R. Metal Oxide Gas Sensors: Sensitivity and Influencing Factors. Sensors 2010, 10, 2088–2106.
  14. Wang, B.; Zhu, L.F.; Yang, Y.H.; Xu, A.N.S.; Yang, G.W. Fabrication of a SnO2 Nanowire Gas Sensor and Sensor Performance for Hydrogen. J. Phys. Chem. C 2008, 112, 6643–6647.
  15. Nisar, J.; Topalian, Z.; De Sarkar, A.; Österlund, L.; Ahuja, R. TiO2-Based Gas Sensor: A Possible Application to SO2. ACS Appl. Mater. Interfaces 2013, 5, 8516–8522.
  16. Garzellaa, C.; Cominia, E.; Tempestia, E.; Frigerib, C.; Sberveglieri, G. TiO2 thin films by a novel sol–gel processing for gas sensor applications. Sens. Actuators 2000, B68, 189–196.
  17. Yu, J.; Zhao, X.; Zhao, Q. Effect of surface structure on photocatalytic activity of TiO2 thin films prepared by sol-gel method. Thin Solid Films 2000, 379, 7–14.
  18. Yu, J.; Zhao, X.; Zhao, Q. Photocatalytic activity of nanometer TiO2 thin films prepared by the sol–gel method. Mater. Chem. Phys. 2001, 69, 25–29.
  19. Manjula, P.; Boppella, R.; Manorama, S.V. A Facile and Green Approach for the Controlled Synthesis of Porous SnO2 Nanospheres: Application as an Efficient Photocatalyst and an Excellent Gas Sensing Material. ACS Appl. Mater. Interfaces 2012, 4, 6252–6260.
  20. Liu, Y.; Jiao, Y.; Zhang, Z.; Qu, F.; Umar, A.; Wu, X. Hierarchical SnO2 Nanostructures Made of Intermingled Ultrathin Nanosheets for Environmental Remediation, Smart Gas Sensor, and Supercapacitor Applications. ACS Appl. Mater. Interfaces 2014, 6, 2174–2184.
  21. Daghrir, R.; Drogui, P.; Robert, D. Modified TiO2 For Environmental Photocatalytic Applications: A Review. Ind. Eng. Chem. Res. 2013, 52, 3581–3599.
  22. Wang, H.; Rogach, A.L. Hierarchical SnO2 Nanostructures: Recent Advances in Design, Synthesis, and Applications. Chem. Mater. 2013, 26, 123–133.
  23. Fortunato, E.; Ginley, D.; Hosono, H.; Paine, D.C. Transparent Conducting Oxides for Photovoltaics. MRS Bull. 2007, 32, 242–247.
  24. Green, A.N.M.; Palomares, D.C.; Haque, S.A.; Kroon, A.J.M.; Durrant, J.R. Charge Transport versus Recombination in Dye-Sensitized Solar Cells Employing Nanocrystalline TiO2 and SnO2 Films. J. Phys. Chem. B 2005, 109, 12525–12533.
  25. Lewis, B.G.; Paine, D.C. Applications and Processing of Transparent Conducting Oxides. MRS Bull. 2000, 25, 22–27.
  26. Dutta, S.; Patra, A.K.; De, S.; Bhaumik, A.; Saha, B. Self-Assembled TiO2 Nanospheres By Using a Biopolymer as a Template and Its Optoelectronic Application. ACS Appl. Mater. Interfaces 2012, 4, 1560–1564.
  27. Presley, R.E.; Munsee, C.L.; Park, C.-H.; Hong, D.; Wager, J.F.; Keszler, D. Tin oxide transparent thin-film transistors. J. Phys. D Appl. Phys. 2004, 37, 2810–2813.
  28. Bob, B.; Song, T.-B.; Chen, C.-C.; Xu, Z.; Yang, Y. Nanoscale Dispersions of Gelled SnO2: Material Properties and Device Applications. Chem. Mater. 2013, 25, 4725–4730.
  29. Vinodgopal, K.; Kamat, P.V. Enhanced rates of photocatalytic degradation of an azo dye using SnO2/TiO2 coupled semiconductor thin films. Environ. Sci. Technol. 1995, 29, 841–845.
  30. Liu, Z.; Sun, D.D.; Guo, P.; Leckie, J.O. An Efficient Bicomponent TiO2/SnO2 Nanofiber Photocatalyst Fabricated by Electrospinning with a Side-by-Side Dual Spinneret Method. Nano Lett. 2007, 7, 1081–1085.
  31. Beltrán, A.; Andrés, J.; Sambrano, J.R.; Longo, E. Density Functional Theory Study on the Structural and Electronic Properties of Low Index Rutile Surfaces for TiO2/SnO2/TiO2 and SnO2/TiO2/SnO2 Composite Systems. J. Phys. Chem. A 2008, 112, 8943–8952.
  32. Yadav, B.; Verma, N.; Singh, S. Nanocrystalline SnO2–TiO2 thin film deposited on base of equilateral prism as an opto-electronic humidity sensor. Opt. Laser Technol. 2012, 44, 1681–1688.
  33. Hou, X.; Wang, X.; Liu, B.; Wang, Q.; Wang, Z.; Chen, D.; Shen, G. SnO2@TiO2Heterojunction Nanostructures for Lithium-Ion Batteries and Self-Powered UV Photodetectors with Improved Performances. ChemElectroChem 2013, 1, 108–115.
  34. Radecka, M.; Zakrzewska, K.; Rerkas, M. SnO2–TiO2 solid solutions for gas sensors. Sens. Actuators B Chem. 1998, 47, 194–204.
  35. Chai, S.; Zhao, G.; Li, P.; Lei, Y.; Zhang, Y.; Li, D. Novel Sieve-Like SnO2/TiO2 Nanotubes with Integrated Photoelectrocatalysis: Fabrication and Application for Efficient Toxicity Elimination of Nitrophenol Wastewater. J. Phys. Chem. C 2011, 115, 18261–18269.
  36. Kumar, V.; Jaiswal, M.K.; Gupta, R.; Kulriya, P.K.; Asokan, K.; Sulania, I.; Ojha, S.; Kumar, R. Modification in the properties of SnO2 and TiO2 nanocomposite thin films by low energy ion irradiation. Integr. Ferroelectr. 2018, 193, 88–99.
  37. Huang, M.; Yu, J.; Li, B.; Deng, C.; Wang, L.; Wu, W.; Dong, L.; Zhang, F.; Fan, M. Intergrowth and coexistence effects of TiO2–SnO2 nanocomposite with excellent photocatalytic activity. J. Alloy. Compd. 2015, 629, 55–61.
  38. Vargas, M.A.; Rodríguez-Páez, J.E. Amorphous TiO2 nanoparticles: Synthesis and antibacterial capacity. J. Non-Crystalline Solids 2017, 459, 192–205.
  39. Wang, Q.; Wei, X.; Dai, J.; Jiang, J.; Huo, X. Influence of annealing process on ferromagnetism of undoped TiO2 nanoparticles prepared by sol–gel method. Mater. Sci. Semicond. Process. 2014, 21, 111–115.
  40. Kutuzova, A.S.; Dontsova, T.A. Characterization and properties of TiO2–SnO2 nanocomposites, obtained by hydrolysis method. Appl. Nanosci. 2019, 9, 873–880.
  41. Ivanova, T.; Harizanova, A.; Koutzarova, T.; Vertruyen, B. Optical and structural characterization of TiO2 films doped with silver nanoparticles obtained by sol–gel method. Opt. Mater. 2013, 36, 207–213.
  42. Liu, N.; Chen, X.; Zhang, J.; Schwank, J.W. A review on TiO2-based nanotubes synthesized via hydrothermal method: Formation mechanism, structure modification, and photocatalytic applications. Catal. Today 2014, 225, 34–51.
  43. Kovalev, I.A.; Petrov, A.A.; Ibragimova, O.A.; Shokod’ko, A.V.; Chernyavskii, A.S.; Goodilin, E.A.; Solntsev, K.A.; Tarasov, A.B. New hierarchical titania-based structures for photocatalysis. Mendeleev Commun. 2018, 28, 541–542.
  44. Rasoulnezhad, H.; Kavei, G.; Ahmadi, K.; Rahimipour, M.R. Combined sonochemical/CVD method for preparation of nanostructured carbon-doped TiO 2 thin film. Appl. Surf. Sci. 2017, 408, 1–10.
  45. Wittawat, R.; Rittipun, R.; Jarasfah, M.; Nattaporn, B. Synthesis of ZnO/TiO2 spherical particles for blue light screening by ultrasonic spray pyrolysis. Mater. Today Commun. 2020, 24, 101126.
  46. Bettini, L.; Dozzi, M.V.; Della Foglia, F.; Chiarello, G.L.; Selli, E.; Lenardi, C.; Piseri, P.; Milani, P. Mixed-phase nanocrystalline TiO2 photocatalysts produced by flame spray pyrolysis. Appl. Catal. B Environ. 2015, 178, 226–232.
  47. Scarisoreanu, M.; Fleaca, C.; Morjan, I.; Niculescu, A.-M.; Luculescu, C.; Dutu, E.; Ilie, A.; Morjan, I.; Florescu, L.G.; Vasile, E.; et al. High photoactive TiO 2 /SnO 2 nanocomposites prepared by laser pyrolysis. Appl. Surf. Sci. 2017, 418, 491–498.
  48. Anandan, S.; Pugazhenthiran, N.; Lana-Villarreal, T.; Lee, G.-J.; Wu, J.J. Catalytic degradation of a plasticizer, di-ethylhexyl phthalate, using Nx–TiO2−x nanoparticles synthesized via co-precipitation. Chem. Eng. J. 2013, 231, 182–189.
  49. Zikriya, M.; Nadaf, Y.; Bharathy, P.V.; Renuka, C. Luminescent characterization of rare earth Dy3+ ion doped TiO2 prepared by simple chemical co-precipitation method. J. Rare Earths 2018, 37, 24–31.
  50. Hariharan, D.; Thangamuniyandi, P.; Selvakumar, P.; Devan, U.; Pugazhendhi, A.; Vasantharaja, R.; Nehru, L. Green approach synthesis of 2 nanoparticles: Characterization, visible light active picric acid degradation and anticancer activity. Process Biochem. 2019, 87, 83–88.
  51. Papp, C.; Steinrück, H.-P. In situ high-resolution X-ray photoelectron spectroscopy—Fundamental insights in surface reactions. Surf. Sci. Rep. 2013, 68, 446–487.
  52. Moulder, J.F.; Stickle, W.F.; Sobol, P.E.; Bomben, K.D. Handbook of X-ray Photoelectron Spectroscopy; Perkin-Elmer Corporation: Eden Prairie, MN, USA, 1992.
  53. Cho, S.; Yu, J.; Kang, S.K.; Shih, D.-Y. Oxidation study of pure tin and its alloys via electrochemical reduction analysis. J. Electron. Mater. 2005, 34, 635–642.
  54. Thompson, A. X-ray Data Booklet; LBNL/PUB-490 Rev. 3; University of California: Berkeley, CA, USA, 2009.
  55. Kumar, D.; Chen, M.; Goodman, D. Characterization of ultra-thin TiO2 films grown on Mo(112). Thin Solid Films 2006, 515, 1475–1479.
  56. Dolat, D.; Mozia, S.; Wróbel, R.; Moszyński, D.; Ohtani, B.; Guskos, N.; Morawski, A.W. Nitrogen-doped, metal-modified rutile titanium dioxide as photocatalysts for water remediation. Appl. Catal. B Environ. 2015, 162, 310–318.
  57. Boscher, N.; Olivier, S.; Maurau, R.; Bulou, S.; Sindzingre, T.; Belmonte, T.; Choquet, P. Photocatalytic anatase titanium dioxide thin films deposition by an atmospheric pressure blown arc discharge. Appl. Surf. Sci. 2014, 311, 721–728.
  58. Saric, I.; Peter, R.; Petravic, M. Oxidation of Cobalt by Oxygen Bombardment at Room Temperature. J. Phys. Chem. C 2016, 120, 22421–22425.
  59. Dong, H.; Edmondson, J.; Miller, R.; Chourasia, A. Chemical reactivity at Fe/CuO interface studied in situ by X-ray photoelectron spectroscopy. Vacuum 2014, 101, 27–32.
  60. Gamsjager, H.; Gajda, T.; Sangster, J.; Saxena, S.K.; Voigt, W. Chemical Thermodynamics Volume 12; Perrone, J., Ed.; OECD Nuclear Energy Agency, Data Bank: Leoben, Austria, 2013; ISBN 978-92-64-99206-1.
  61. Schaefer, S.C. Electrochemical Determination of Thermodynamic Properties of Bismuth Sesquioxide and Stannic Oxide; United States Department of the Interior Report of Investigation 8906; Bureau of Mines Report of Investigations: Anchorage, AK, USA, 1984.
  62. Kim, J.; Kang, S. Stable phase domains of the TiO2–Ti3O5–Ti2O3–TiO–Ti(CxOy)–TiC system examined experimentally and via first principles calculations. J. Mater. Chem. A 2013, 2, 2641–2647.
  63. Lide, D.R. (Ed.) Handbook of Chemistry and Physics, 72nd ed.; CRC Press Inc.: Boca Raton, FL, USA, 1991.
  64. Magill, P.L. Equilibrium in the System Hydrogen, Water Vapor and the Oxides of Tin. Unpublished Bachelor’s Thesis, California Institute of Technology, Pasadena, CA, USA, 1923.
More
This entry is offline, you can click here to edit this entry!
Video Production Service