We present a study on the taxonomy of eleven Thymus species, belonging to two sections and occurring naturally in Bulgaria. Four DNA barcoding markers—matK, rbcL, trnH-psbA and ITS—were applied to discriminate the species and to reveal their phylogenetic relationships. The results showed that rbcL has the lowest discriminating power regarding the studied species, while the other markers yielded results fitting better to the existing taxonomic schemes based on morphological traits. However, even in the case of better performing markers, the results were not straightforward—morphologically distinct species belonging to different sections were grouped together, and closely related species appeared genetically distinct. The results are typical for taxonomically complex groups, such as the genus Thymus, characterized in Bulgaria with great diversity, high percentage of endemism and still requiring a full and comprehensive taxonomic study. The results are discussed in the light of unresolved taxonomic problems and application of DNA barcoding methods.
1. Introduction
Resolving the problems arising when studying taxonomically complex groups (TCGs) requires a combined approach consisting of classical (morphological, anatomical, cytological) and modern (molecular) methods. Representatives of the genus
Thymus can be a good example of a complex group encompassing many taxa, some of them with uncertain status, related among each other by hybridization, overlapping phenotypic variation and other attributes of the reticulate evolution, making the task of taxonomists more difficult [
1].
The complex systematics of the genus
Thymus has been outlined in many studies attempting to resolve the puzzle or a part of it [
2,
3,
4,
5,
6]. Most of the challenges still stand today, and in many cases, the application of modern molecular methods did not provide a clear solution to taxonomic problems [
1,
7].
Currently, the number of species of the genus
Thymus in Bulgaria is 21 [
8,
9,
10,
11], and the species list slightly differs from the one in the Euro+Med PlantBase (
https://ww2.bgbm.org/EuroPlusMed/; last accessed 23 December 2021). In terms of species diversity, Bulgaria is among the richest countries in Europe (see also [
12], for review). The genus
Thymus is subdivided in two subgenera:
Coridothymus (Reichenb. f.) Borbás and
Thymus [
2]. All Bulgarian species belong to the nominate subgenus.
Due to the importance of Thymus species as medicinal and aromatic plants and because of the conservation value of many species, they always provoked a substantial interest and have been subjected to diverse studies.
The last comprehensive study on the systematics of genus
Thymus in Bulgaria was published more than 30 years ago [
8], and practically no other taxonomic studies have been performed afterwards, with the exception of some floristic notes [
12] and few studies on the essential oil composition [
13,
14]. Recently, Sostarić et al. [
15] studied the genetic diversity and relationships among seven species of section
Serpyllum (Miller) Bentham from Serbia. Apart from the taxonomic studies, essential oils and some other bioactive compounds of the species have provoked substantial interest [
16,
17,
18,
19,
20].
Genetic diversity, evolution and phylogeny of
Thymus species have received considerable attention [
21,
22,
23], with application of newly developed methods. DNA barcoding is one of the modern methods applied successfully to the taxonomy of various groups of living organisms [
24,
25,
26,
27]. It is often pointed out that in the plant application of barcoding markers, distinguishing among the species is more difficult and not as straightforward as in animals and other organismic groups. The application of barcoding to TCGs in plants experiences some marked difficulties. The success of choosing an appropriate marker that could differentiate between closely related and morphologically similar species depends on many factors, among them polyploidy, the degree of relatedness of taxa of interest, gene flow and hybridization, dispersal ability and other life-history traits (see [
25]). Several large-scale phylogenetic studies were performed at a higher than species level and revealed the phylogeny of the genera and tribes within Lamiaceae [
28,
29,
30]. Genus
Thymus was found to be paraphytletic to
Argantoniella and
Saccocalyx in both nuclear and plastid markers and to
Origanum in a plastid marker only [
28] and was placed within a clade together with
Thymbra,
Origanum,
Satureja and
Micromeria [
30]. DNA barcoding has been successfully applied for identifying different species in commercial samples of herbs [
31] and for the identification of different Lamiaceae species [
32]. However, its application to infrageneric
Thymus taxonomy did not allow definite conclusions [
1,
28,
33,
34]. Evidently, there are many unresolved problems related to the application of DNA barcoding to TCGs, but the approach is promising and will surely be improved further [
26,
27,
35]. Therefore, it is worthy of applying this class of markers to a TCG, whose representatives were studied to a lesser extent.
2. Efficiency of PCR Amplification and Sequencing
The success rates for PCR amplification and sequence efficiency were measured for all DNA barcodes obtained using the respective primers (Table 1). In the genus Thymus, primers used for different barcodes showed 100% amplification and sequencing efficiency among the 15 tested samples. One sample did not amplify, and one sample failed to be sequenced for ITS primers. Alignment length was 760 bp for matK, 530 bp for rbcL, 350 for trnH-psbA and 619 for ITS.
Table 1. Efficiency of PCR amplification and sequencing for Thymus accessions for four DNA barcode regions.
| Barcode Region |
N (Samples Tested) |
Alignment Length (bp) |
Percentage of Amplification Efficiency |
Percentage of Sequencing Efficiency (from Amplified Barcodes) |
| matK |
14 |
760 |
100 |
100 |
| rbcL |
14 |
530 |
100 |
100 |
| trnH-psbA |
14 |
350 |
100 |
100 |
| ITS |
14 |
619 |
93.4 |
93.4 |
3. Genetic Diversity of Thymus Species and Accessions
Table 2 represents the parameters of genetic diversity of the studied DNA barcode regions. The total number of sites varied between 351 (trnH-psbA) to 761 (matK) and up to 1290 when combinations of different barcodes were considered. However, in all cases, more than 90% of the total number of sites were constant. The number of variable sites varied from 2 to 16 per region and increased to 29 in the combinations of two regions. The number of parsimony-informative sites was of similar magnitude and varied from 2 to 13.
Table 2. Statistical parameters of genetic diversity calculated in MEGA X.
| DNA Barcode Region |
Ns |
C |
V |
Pi |
S |
Average Pairwise Distance/SE |
| rbcL |
529 |
527 |
2 |
2 |
0 |
0.00127/0.00009 |
| trnH-psbA |
351 |
333 |
16 |
10 |
6 |
0.13205/0.00371 |
| matK |
761 |
748 |
13 |
3 |
10 |
0.00342/0.00171 |
| ITS |
618 |
604 |
14 |
2 |
12 |
0.00464/0.00144 |
| rbcL+matK |
1290 |
1275 |
15 |
5 |
10 |
0.00230/0.00066 |
| rbcL+trnH-psbA |
880 |
860 |
18 |
12 |
6 |
0.00577/0.00147 |
| matK+trnH-psbA |
1112 |
1081 |
29 |
13 |
16 |
0.00748/0.00176 |
We used the software package Geneious to construct a phylogenetic tree to infer genetic distances and the taxonomic relationship between
Thymus accessions. A test of different genetic distance models (see Material and Methods) available in the package was performed under the clustering method UPGMA (unweighted pair group method with averages). Among the three models, Jukes–Cantor and Tamura–Nei models displayed highly comparable patterns of clustering of
Thymus accessions for all analyzed DNA barcode regions and thus were both considered relevant for use (
Supplement—Figures S1 and S2). For further analyses, we used the Jukes–Cantor model, and the constructed phylogenetic trees for different analyzed DNA barcode regions are presented in
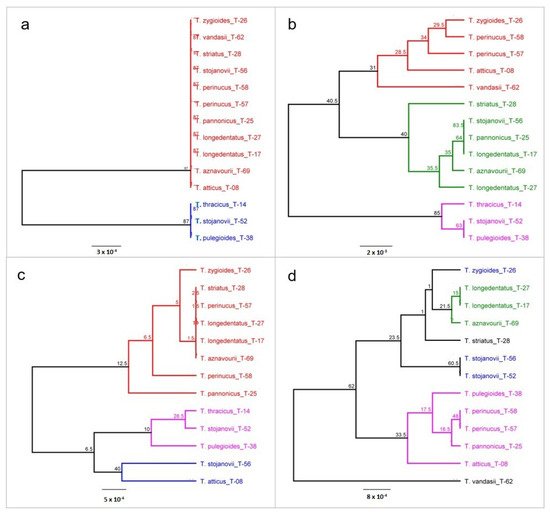
Figure 1.
Figure 1. Phylogenetic trees of Thymus taxa constructed based on barcode regions rbcL (a), trnH-psbA (b), matK (c) and ITS (d). The trees were constructed using the Geneious software with the genetic distance model Jukes–Cantor, the unweighted pair group method with averages UPGMA clustering method and the resampling method bootstrap with 200 replicates. Bootstrap values > 50% are shown along the branches.
The level of genetic discrimination of
Thymus specimens based on genetic distances differed between DNA barcode regions used. The rbcL region showed the lowest level of genetic differentiation, with the species specimens
T. stojanovii,
T. thracicus and
T. pulegioides splitting into a distinct cluster (
Figure 1a). The data from the rbcL region reflect the close genetic relationships of these species (
Figure 1b). While the three species of this cluster belong to the same section
Serpyllum (
T. pulegioides to subsection
Alternantes and the other two species to subsection
Pseudomarginati), the second cluster includes all remaining species, which belong to the two sections (
Serpyllum and
Hyphodromi). The sections were specified based entirely on morphological characters, and some differences between the classification based on morphology and that based on genetic markers are expected. However, the differences and grouping based on the rbcL barcode region do not show some particular trend. Therefore, we consider this region to have little information value for the taxonomic classification of
Thymus. Federici et al. [
1] found the same sequence length of rbcL in all species studied, and the overall K2P distance was the lowest of all barcoding markers (0.1%).
The other region (trnH-psbA) showed the highest level of genetic divergence (Figure 1c). Three main groups were formed—two small and a bigger one. The first small group consisted of three species belonging to section Hyphodromi, and the second one combined species of section Serpyllum—similarly to rbcL tree topology. The larger group consisted of three species of section Serpyllum and two of section Hyphodromi. One species—T. vandasii—had a somewhat distinct position.
No particular trend could be observed in the third DNA barcode region matK. Several micro-clusters were formed combining species belonging to different sections, and different accessions of the same species were grouped in different clusters.
The fourth DNA barcode region—ITS—yielded a construction consisting of three clusters and one species distant from the others (Figure 1d). Again, like in the trnH-psbA region, this species was T. vandasii. The clusters combined species belonging to different sections—for example, the first small cluster consisted of T. zygioides (sect. Hyphodromi) and two accessions of T. stojanovii (sect. Serpyllum). However, it can be noted that here, different accessions of the same species clustered together, contrary to the other barcode regions.
The success of DNA barcoding in distinguishing taxa at the species level in plants depends on many factors [
25]. It differs among the different groups and is usually lower in the TCGs, such as genus
Thymus.
It has been reported in many studies that DNA barcoding leads to 90% success in species identification and differentiation [
36,
37,
38]. However, there were also reports of lower success, especially in the TCGs. For example, [
7] obtained about 60% success in species identification and delimitation in sedges (
Carex spp.).
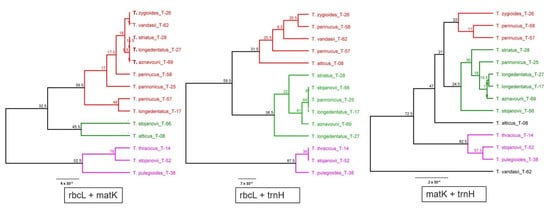
It is known that the combination of DNA barcode markers can improve the resolution of taxonomic and evolutionary studies. Therefore, here, we made an attempt to find out whether a combination of DNA barcode markers that have shown little information value can improve the taxonomic classification of the studied taxa. Phylogenetic trees based on the combination of plastid markers are shown in Figure 2.
Figure 2. Consensus phylogenetic trees of Thymus taxa constructed based on a combination of plastid DNA barcode markers. The trees were constructed using the Geneious software with the genetic distance model Jukes–Cantor, the clustering method UPGMA and the resampling method bootstrap with 200 replicates. Bootstrap values > 50% are shown along the branches.
Overall, based on data from the four DNA barcode regions, we can conclude about the presence of pronounced genetic diversity within the genus
Thymus. The analyzed rbcL and matK regions alone cannot be used for relevant taxonomic differentiation of
Thymus species and accessions. The most effective in distinguishing species and grouping closely related taxa of
Thymus together was the ITS region. It was also the most informative region for other TCGs, such as the family Meliaceae [
39] and a large set of medicinal plants [
38]. It was reported by [
39] species belonging to the same TCGs often have identical sequences of cytoplasmic DNA barcoding regions which greatly reduces the discrimination power of these markers. It is often recommended to use two-loci and/or multilocus combinations for obtaining better results [
35,
40]. However, in many studies using multulocus combination of DNA barcoding, markers did not substantially improve the resolution and identification power [
39,
41].
Phylogenetic trees constructed with combining of DNA barcoding markers yielded similar grouping, like in the case of individual DNA barcodes (Figure 2), and repeating most of the peculiarities established by using individual DNA barcodes. It is difficult to evaluate whether the grouping of different markers provides better results or not.
Taxonomic assignment of
Thymus specimens through Basic Local Alignment Search Tool (BLAST) analyses [
42] against publicly available accessions in NCBI did not return reliable results, probably because the publicly available sequences in the databases represent mostly well-known and studied species with a large distribution, and, to a lesser extent, species from insufficiently studied regions (at least by using molecular markers), such as the Balkans and Bulgaria in particular. Therefore, the most similar to Bulgarian species were ones with a remote distribution, such as
T. japonicus (H. Hara) Kitag.,
T. mongolicus (Ronniger) Ronniger (rbcL barcoding region) and for the ITS region,
T. quinquecostatus Celak. and
T. serpillum L. (results not shown). Evidently, much more information and richer databases are necessary for reliable application of the BLAST analysis to the Bulgarian
Thymus species.
As discussed by [
1], often in TCGs, the fragmented populations of the species with reduced or lacking gene flow and long-term evolution in isolation result in spatial structures with morphological and genetic divergence without a strong correspondence among each other. This makes distinguishing taxa very difficult without clearly determined taxonomic boundaries. Plant taxonomy is a complex issue, and speciation processes could be extremely variable, especially in TCGs [
43,
44,
45].
We consider the present study as a first step toward an updated and taxonomically sound classification of the Bulgarian species of the genus Thymus. Including the remaining indigenous species and such that are not occurring naturally in the country but are important as key species with well-known and established taxonomic positions could facilitate the process of obtaining a proper and reliable classification.
This entry is adapted from the peer-reviewed paper 10.3390/plants11030270