Your browser does not fully support modern features. Please upgrade for a smoother experience.
Metabolic Syndrome Management: History
Please note this is an old version of this entry, which may differ significantly from the current revision.
Contributor: Maroun Bou Zerdan

Metabolic syndrome (MetS) forms a cluster of metabolic dysregulations including insulin resistance, atherogenic dyslipidemia, central obesity, and hypertension. The pathogenesis of MetS encompasses multiple genetic and acquired entities that fall under the umbrella of insulin resistance and chronic low-grade inflammation. If left untreated, MetS is significantly associated with an increased risk of developing diabetes and cardiovascular diseases (CVDs). Given that CVDs constitute by far the leading cause of morbidity and mortality worldwide, it has become essential to investigate the role played by MetS in this context to reduce the heavy burden of the disease.

  • metabolic syndrome
  • insulin resistance
  • nutraceuticals

1. Introduction

1.1. History

In 1988, Reaven raised the possibility that insulin resistance (IR) is not only involved in the etiology of type 2 diabetes mellitus (T2DM) but also that of cardiovascular disease (CVD) [1]. Reaven remarked that IR frequently presents in conjunction with a set of abnormalities and described them as syndrome X. The qualifier “metabolic” was added to Reaven’s syndrome X to differentiate it from the pre-existing syndrome X in cardiology [2]. In sum, metabolic syndrome X is a risk factor for cardiovascular diseases (CVDs) even without concomitant T2DM and it includes IR, hyperinsulinemia, dysglycemia, dyslipidemia, and hypertension. The disorders are, respectively, assessed using six indices to make the diagnosis of metabolic syndrome (MetS): waist circumference, fasting glucose levels, triglyceride levels, high-density lipoprotein (HDL) levels, cholesterol levels, and blood pressure (Table 1) [2,3].
Table 1. Evolution of metabolic syndrome diagnostic definitions throughout the years.
Clinical Measure Criteria Diagnosis
Central Obesity Blood Glc High TG Low HDL High BP
AHA/
NHLBI
(2009)
[4]
  • WC

>40” (men) or
>35” (women)
  • IFG or
  • on high blood Glc txt or
  • T2DM dx
  • ≥150 mg/dL or
  • on TG txt
  • <40 mg/dL (men) or <50 mg/dL (women) or
  • on HDL txt
  • ≥130 mmHg systolic and/or
  • ≥85 mmHg diastolic or
  • on HTN txt
≥3 criteria
IDF
(2005)
[5,6]
  • WC
>37” (men) or
>32” (women) or
  • BMI >30 kg/m2
≥3 criteria one of which should be central obesity
ATPIII
(2001)
[7]
WC
>40” (men) or
>35” (women)
  • ≥150 mg/dL
  • <40 mg/dL (men) or <50 mg/dL (women)
  • ≥130 mmHg systolic and ≥85 mmHg diastolic or
  • on HTN txt
≥3 criteria
EGIR
(1999)
[8]
  • WC
>37” (men) or
>32” (women)
  • IFG or
  • IGT
  • <39 mg/dL (men and women)
  • ≥140 mmHg systolic and ≥90 mmHg diastolic or
  • on HTN txt
≥3 criteria one of which should be IR *
WHO
(1998)
[1]
  • Waist/hip ratio > 0.9 (men) or > 0.85 (women) or
  • BMI > 30 kg/m2
  • IFG orx
  • IIGT or
  • T2DM dx
  • <35 mg/dL (men) or <39 mg/dL (women)
  • ≥140 mmHg systolic and ≥90 mmHg diastolic
≥3 criteria one of which should be IR **
Note that IFG is defined as ≥110 mg/dL in 2001 but this was momdified in 2004 to be ≥100 mg/dL, IGT is defined as 2 h glucose >140 mg/dL. * EGIR IR is defined as plasma insulin levels >75th percentile. ** WHO IR is defined as presence of IR or IFG or IGT. Abbreviations: AHA: American Heart Association, ATPIII: National Cholesterol Education Program Adult Treatment Panel III; dx: diagnosis; EGIR: European group for study of insulin resistance; Glc: glucose; HDL: high density lipoprotein; HTN: hypertension; IR: insulin resistance; IDF: International Diabetes Federation; IGT: impaired glucose tolerance; IFG: impaired fasting glucose; NHLBI: National Heart, Lung, and Blood Institute; TG: triglyceride; txt: treatment; WC: waist circumference; WHO: World Health Organization.
 
Notice that blood insulin is not part of the five criteria because measuring this parameter for large-scale screening is cumbersome in clinical practice. Waist circumference is employed instead, as it was later proven to strongly correlate with IR [9]. Total body fat did not initially take part in the characterization of Reaven’s MetS as he found many cases showing a reverse association between total body fat and IR. Subgroup analyses later revealed that body fat distribution was the missing element in the equation explaining heterogeneity in results [10]. “Apple-shaped” bodies demonstrate central or abdominal visceral obesity and therefore carry a greater risk of developing IR than individuals with “pear-shaped” bodies with subcutaneous fat accumulation [11,12]. However, waist circumference alone remains inconclusive of abdominal adiposity and must be interpreted along with body mass index (BMI) in order to promptly evaluate for the high-risk abdominal obesity [9]. In addition, excess visceral adipose tissue is often accompanied by fat infiltration of hepatocytes, a condition known as non-alcoholic fatty liver. The latter is a dangerous phenotype of the disease, possibly progressing to cirrhosis or liver cancer [13].
Not a disease per se, but a term that serves as an umbrella of risk factors for individuals to be at an increased risk of disease, MetS has appeared for the first time on PubMed in 1940. Alberti et al. described a global definition of MetS in 2009 where three abnormal findings would qualify a person for MetS. Risk factors such as raised blood pressure, dyslipidemia (raised triglycerides and lowered high-density lipoprotein cholesterol), raised fasting glucose, and central obesity were proposed by the International Diabetes Federation and the American Heart Association/National Heart, Lung, and Blood Institute [14].
A single set of cut points was used for all components except waist circumference, for which national or regional cut points were utilized. Several studies later on have shown that waist-to-height ratio was a better screening tool than waist circumference [14,15].

1.2. Epidemiology

According to the Center of Disease Control and Prevention (CDC), the United States witnessed a 35% increase in MetS prevalence since the appearance of the term in the 1980s till 2012 [16]. The incidence of MetS matches that of obesity and T2DM. About 85% of T2DM patients also have MetS and thus are at higher risk of CVDs [14]. As such, in 2017, about 12.2% of the USA adult population had T2DM. Around one-quarter of them were unaware of their disease. Unsurprisingly, the MetS prevalence was three times higher, marking about one-third of the American adult population [4]. Fortunately, the National Health and Nutrition Examination Survey (NHANES) released recent data demonstrating declining numbers of the disease with 24% in men and 22% in women [17].

2. Management

2.1. Mediterranean Diet

Long known to be associated with low risk of cardiovascular disease, the adherence to the Mediterranean diet has also been shown to decrease the risk of MetS [194,195]. It has been shown to have a protective role on every component of the MetS pentad [194]. The antioxidant and anti-inflammatory properties of the different Mediterranean diet components, including olive oil, fish, cereals, vegetables, and fruits, likely constitute the most likely explanation of those findings [196,197,198,199]. A recent metanalysis of 50 prospective studies and randomized control trials showed that the greater the adherence to the Mediterranean diet, the greater the reversion of MetS and its components [200].

2.2. Nutraceuticals

Recent research is assessing the role of nutraceuticals in the management of MetS. Several plant extracts, spices, herbs, and essential oil extracts have apparent benefit in the management of patients with MetS. Although some benefits have been documented, these agents are still under investigation and cannot be considered as an alternative for pharmacotherapy. However, the dependence on nutraceuticals—that are graciously available and with minimal complications—in the management of MetS may be a promising field in the development of novel therapies [201].
Table 5 illustrates the nutraceuticals that have been studied and have proven some benefits in MetS.
Table 5. Role of nutraceuticals in MetS. ↑ signifies increase. ↓ signifies decrease.
Source Action
Turmeric (Curcuma longa)
Active ingredient: diferuloylmethane in curcumin
Suppress NF-kB activation-> ↓ expression of pro-inflammatory cytokines-↓ TNF-α expression, ↓ expression of plasminogen activator inhibitor type-1-> ↓ inflammation [202]—antioxidant effect [201]—curcumin hinders Wnt/β-catenin pathway associated with obesity [203]
Garlic (Allium sativum)
Active ingredient: allicin
Anti-inflammatory effect from the organosulfur compounds in its derivatives. Antioxidant action due to thiol groups—Antithrombotic effect [201]—increases insulin sensitivity [204]
Cinnamon (Cinnamomum verum)
Active ingredient: polyphenols
Antithrombotic–antioxidant–anti-inflammatory effects—increases insulin sensitivity—regulates blood glucose and blood pressure [201]
Rhizoma coptidis
Active ingredient: berberine
Improves body weight, triglyceride levels—increases insulin sensitivity—downregulation of genes involved in lipogenesis [205]—reduction in blood pressure [206]
Neem
(Azadirachta indica)
Active ingredient: neem oil
Increases glucose tolerance via reduction of intestinal and pancreatic glucosidase activity → improves post-prandial hyperglycemia [207]—regenerates pancreatic beta cells → ↑ insulin secretion [201]
Bergamot orange (Citrus bergamia)
Active ingredient: bergamot essential oil
Anticancer–anti-inflammatory–antimicrobial–antioxidant–antianxiety properties—↓ ROS formation—↓ lectin-like LDL receptor-1 expression [208]
Grapes (Vitus vinifera)
Active ingredient: resveratrol, (3,5,4′-trihydroxystilbene)
↓ Adipogenesis—↑ lipolysis—inhibits cyclooxygenase → antioxidant action [209]—enhances insulin sensitivity, glucose tolerance, overall weight, and BMI—[210]
Onions (Allium cepa)
Active ingredient: quercetin
Anti-inflammatory—antioxidant—↓ blood pressure—↓ cholesterol levels—↓ insulin resistance [211]
Fish oils (omega fatty acids)
Active ingredient: polyunsaturated fatty acids
↓ Lipogenesis—↑ fatty acid oxidation in liver and adipose tissue—regulates peroxisome proliferator—activates receptor gamma [212]
Broccoli (Brassica oleracea)
Active ingredient: sulforaphrane
Anti-inflammatory properties—activates nuclear factor erythroid 2-related factor 2, an antioxidant transcription factor → antioxidant properties—role against hypertension, hyperlipidemia, and diabetes [213]
Ginger
Active ingredient: gingerols, shogaols, parasols
Anti-inflammatory—↓ cyclooxygenase-2—↓ 5-lipoxygenase—↓ systolic blood pressure [201]
Cumin (Cuminum cyaminum)
Active ingredient: cuminaldehyde
↓ Lipid levels—↓ glycemia [201]
Cynara cardunculus (L.) subsp. scolymus Hayek-based
Altilix®
Modulates the expression of PPAR-γ and inhibits fatty acid synthase activity—↓ in body weight, waist circumference, HbA1c, plasma lipids, hepatic transaminases, flow-mediated dilation, carotid intima-media thickness [214].
Monascus purpureus, red yeast rice Reversible inhibition of 3-hydroxy-3-methyl-glutaryl-CoA reductase [215]
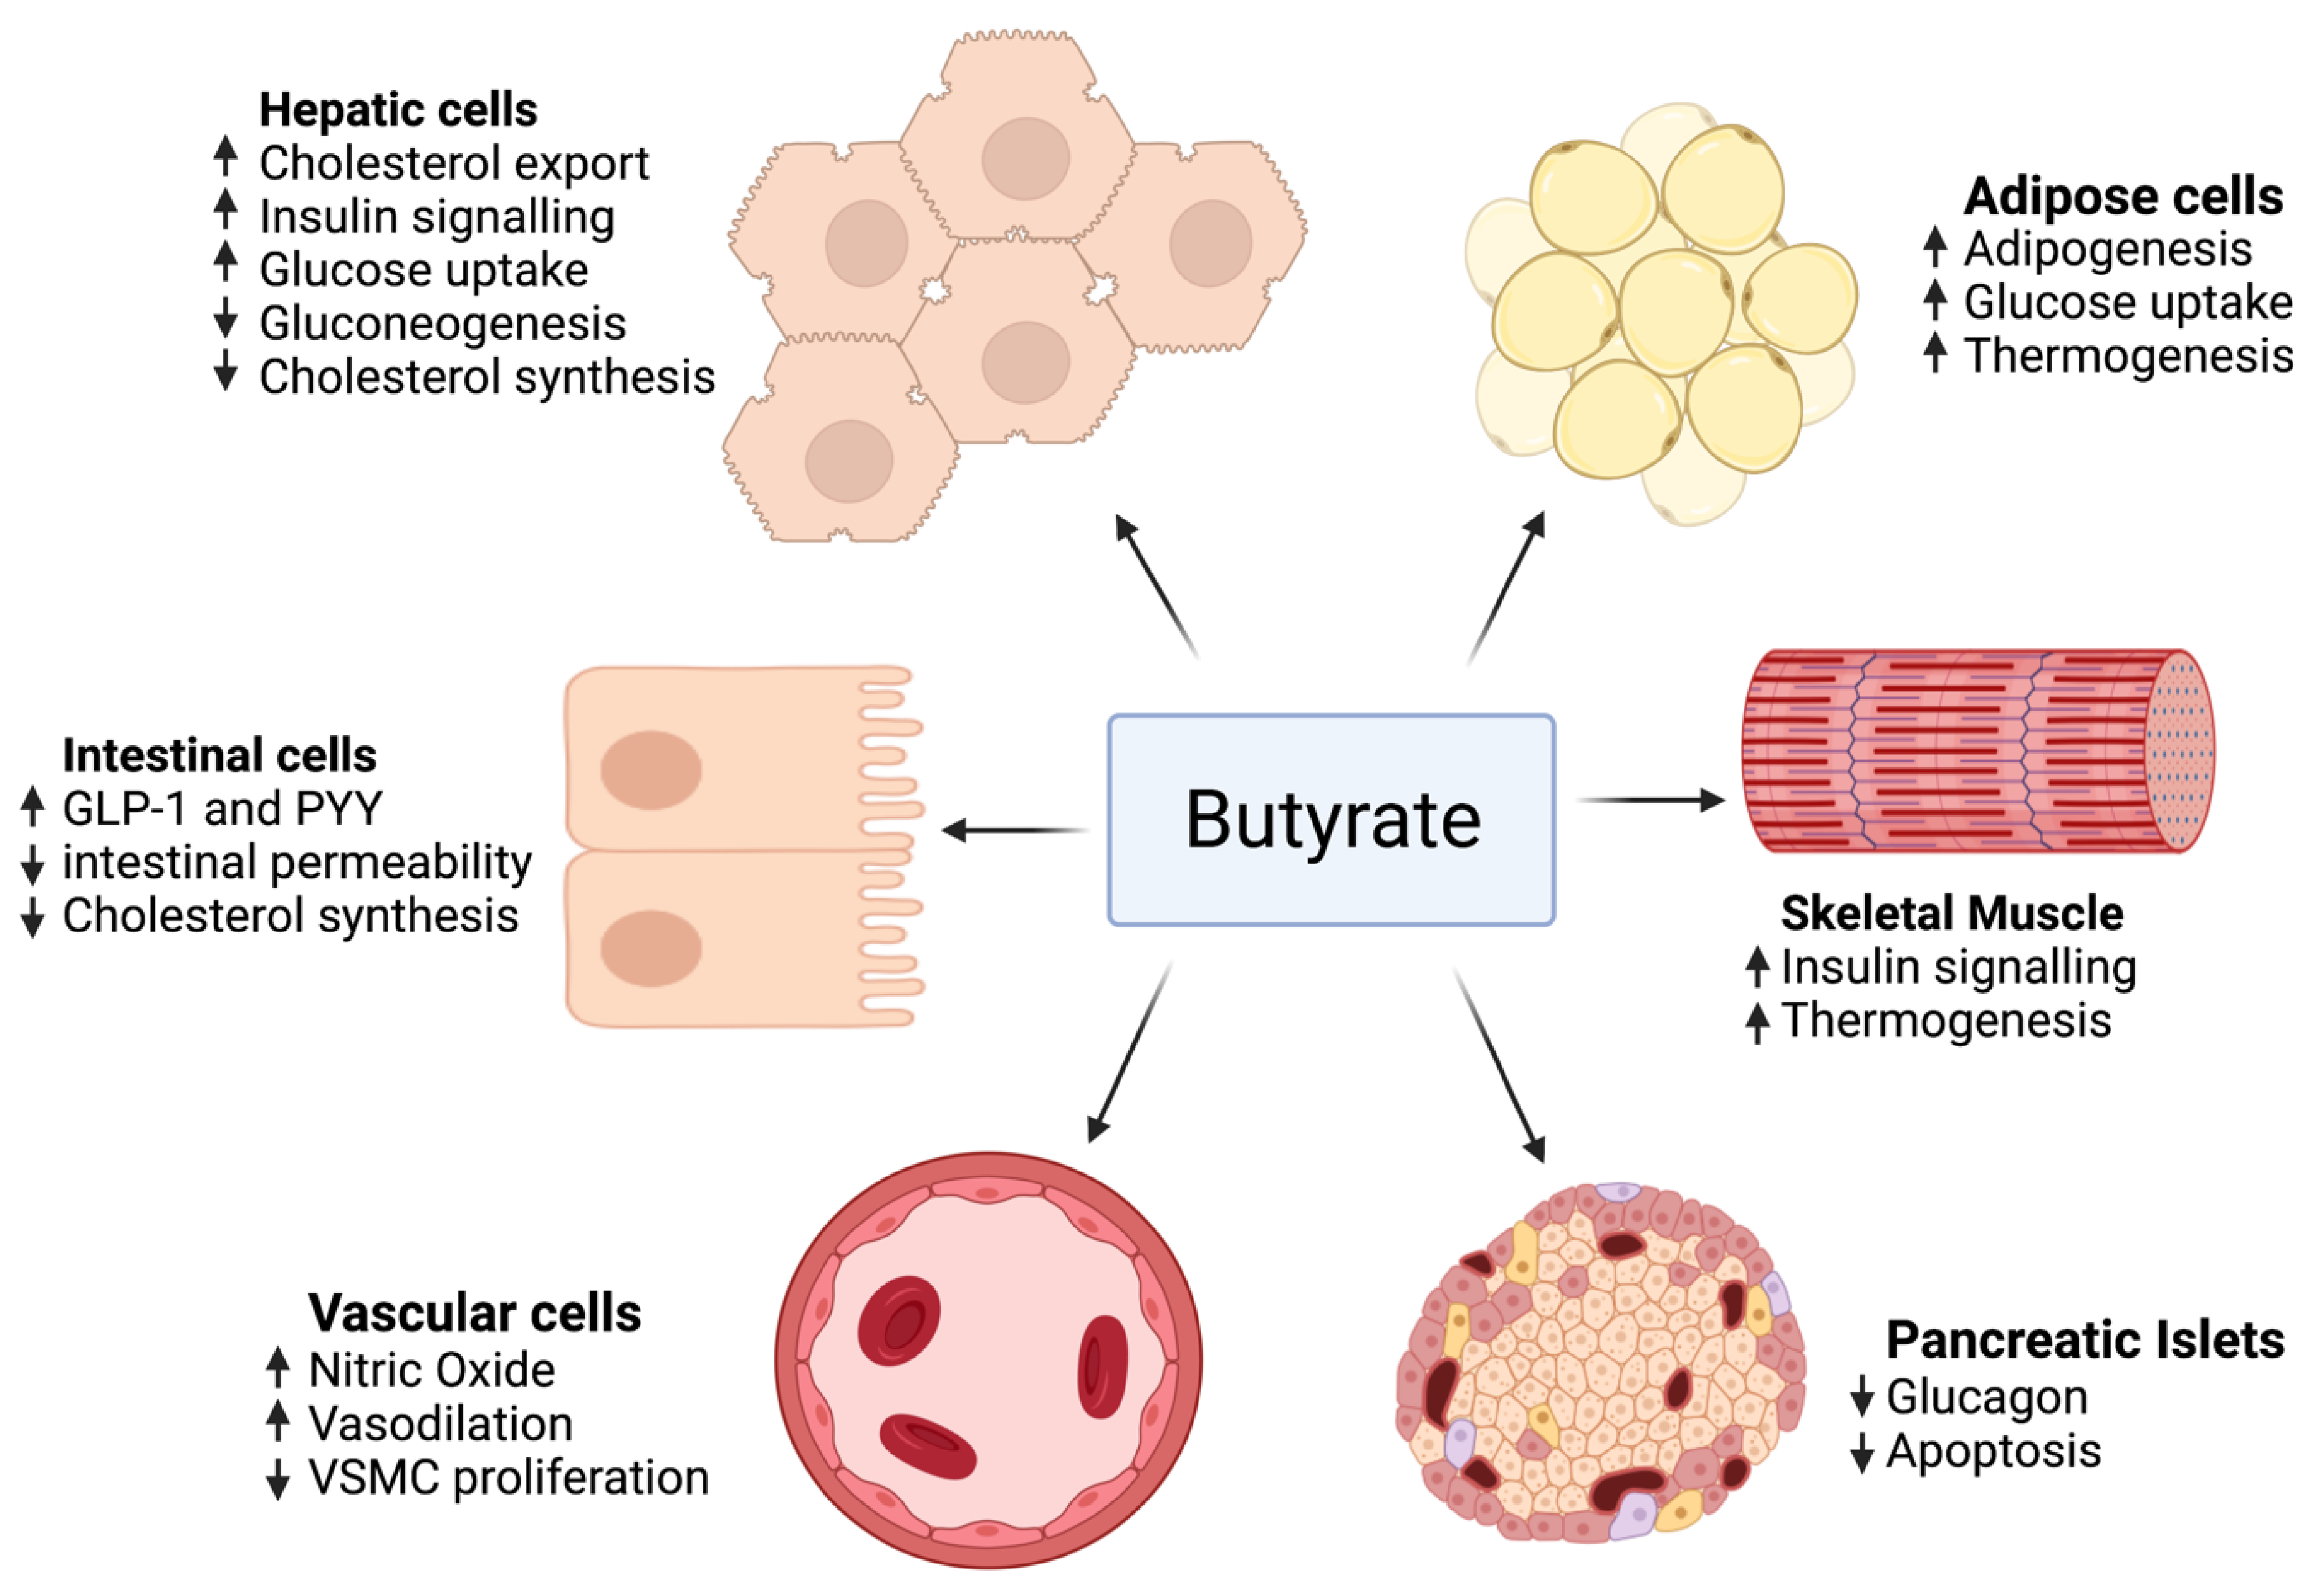
2.3. Butyrate

Human gastrointestinal microbiota have been broadly explored because of their role in both maintaining gut health and disease causation. Dietary fiber and resistant starch are not completely hydrolyzed by host enzymes in the small intestine; instead, they are broken down by the large intestinal microbiota. The principal fermentation products resulting from the breakdown of these fibers are the short-chain fatty acids (SCFAs) acetate, propionate, and butyrate. SCFAs are an important fuel for intestinal epithelial cells, and the main energy source is butyrate, followed by propionate and then acetate (butyrate > propionate > acetate). In general, approximately 10% of the daily energy requirement in adults on a westernized diet originates from the colon-derived SCFAs.
Recently, butyrate has been reported to improve lipid profile, glycemia, body weight, composition, and insulin sensitivity in animal models of MetS. In vitro analyses tested the effect of butyrate on adipose tissue, intestinal cells, skeletal muscle, pancreatic islets, hepatocytes, and blood vessels, emphasizing the role of genes and pathways interplay in its beneficial effects.
A link between obesity and the components of the human microbiota has been described. Nevertheless, these conclusions depend on experimental studies completed using relatively small and distinct groups of volunteers or model animals. Moreover, microbiota components and nutrient intake regulate the total amount and relative quantity of butyrate [216].
For the moment, most human clinical trials have focused on the role of butyrate in intestinal disorders administered rectally or orally, and several trials showed improvement in diverticulitis [238], Crohn’s disease [239], ulcerative colitis [240], and travelers’ diarrhea [241]. No major side effects were described, and it was well tolerated. The unique problem was that the orally administered butyrate led to foul-smelling belching [240].
On the other hand, no sufficient human clinical trials studied butyrate benefits in MetS. Only two small trials were conducted. One was a randomized placebo-controlled clinical trial that studied the outcome of 100 mg sodium butyrate given six times daily for 45 days in type 2 diabetics [233], finding that there was no improvement in fasting insulin, fasting blood glucose, cholesterol, or triglyceride levels; however, an increase in GLP-1 and a reduction in diastolic blood pressure were observed. The second trial used a small sample size and was not placebo-controlled. It studied the effect of 4 g of oral sodium butyrate given daily for 4 weeks. The outcome was an improvement of hepatic and peripheral insulin sensitivity in lean males rather than obese males [242]. Figure 3 summarizes the role of butyrate in MetS.
Ijms 23 00786 g003
Figure 3. The effect of butyrate on adipose tissue, intestinal cells, skeletal muscle, pancreatic islets, hepatocytes, and blood vessels.

2.4. Probiotics

Nowadays, there is evidence that gastrointestinal dysbiosis, which is the modification of the gastrointestinal microbiome, can participate in insulin resistance development [243]. Viewed in this way, many studies have revealed the undesirable effects of low or atypical gastrointestinal bacterial load on dyslipidemia, inflammatory markers, adiposity, and insulin resistance [244]. Additionally, one of the mechanisms was exposure to the bacterial LPS, which is the main cause of metabolic endotoxemia linked to MetS [245]. Moreover, studies have shown that compared to normal-weight people, obese individuals have a reduced ratio of Bacteroidetes/Firmicutes [246].
In terms of therapy, several studies have evaluated the beneficial effects of probiotics in obese and MetS patients (Table 6). Analysis of the data shows that the inclusion of probiotics to the treatment of patients with MetS may improve the current medical treatment but would not affect all of the clinical characteristics of the MetS and related inflammatory biomarkers. Although we cannot deduce that probiotics exert beneficial effects, they may have some positive outcomes that are marginal compared to drug therapy and a healthy lifestyle, and are likely dose- and strain-specific. In addition, the duration of the interventions may have not been long enough to prove the decrease in MetS associated complications. Accordingly, better RCTs were needed in humans with MetS able to fully enlighten if probiotics can be truly used as a coadjuvant therapy for this pathology.
Table 6. Association between metabolic syndrome and probiotics.
Reference Sample Size (n) Age Range
Probiotic Strain
Period of Intervention (Weeks)
Probiotic Dose
Primary Outcomes Secondary Outcomes
[247] 28 Control group: 54.5 ± 8.9
Probiotic group: 51.5 ± 11.4
Lactobacillus casei Shirota
12
milk (65 mL bottles × 3/day) 108 cells/mL
No changes were found in BMI, BP, waist circumference, triacylglycerols, TC, and fasting glucose levels. High-sensitive CRP (1.86 mg/L in the probiotic group vs. −1.60 mg/L in the placebo group, p = 0.016) and LBP levels (5827 ng/mL in the probiotic group vs. −1510 ng/mL in the placebo group, p = 0.023) increased within the probiotic group
[248] 40 Control group: 51.7 ± 12.1
Probiotic group: 52 ± 10.9
Lactobacillus plantarum TENSIA
3
cheese (50 g/day) 1.5 × 10¹¹ CFU/g
BMI was significantly reduced in the probiotic group
(BMI variation in probiotic group −2 vs. −1.6 kg/m2 in the placebo group, p = 0.031).
A positive association was detected between TENSIA colonization and the extent of change of morning diastolic BP (r = 0.617, p = 0.0248)
[249] 28 Control group: 55 ± 9
Probiotic group: 51 ± 11
Lactobacillus casei Shirota
12
milk (65 mL bottles × 3/day) 108 cells/mL
No changes were found in BMI, fasting plasma glucose levels, and HOMA-IR index. Probiotic supplementation resulted in a significant reduction in sVCAM-1 level (−195 ng/mL in the probiotic group vs. 30 ng/mL in the placebo group, p = 0.008) and a significant increase in high-sensitive CRP level (1.86 mg/L in the probiotic group vs. −1.60 mg/L in the placebo group, p = 0.002)
[247] 24 Control group: 63 ± 7.6
Probiotic group: 62 ± 4.35
Lactobacillus plantarum
12
milk (80 mL bottles × 1/day) 107 CFU/g
Glucose levels showed a significant reduction in the FM group compared with the NFM group (glucose variation in FM −10.5 vs. −3 mg/dL in NFM group, p = 0.037). Homocysteine levels showed a significant reduction in the FM group compared with the NFM group p = 0.019).
[250] 28 Control group:
55 ± 9
Probiotic group: 51 ± 11
Lactobacillus casei Shirota
12
milk (65 mL bottles × 3/day) 108 cells/mL
No changes were found in BMI, BP, waist circumference, triacylglycerols, and TC blood levels. LcS administration was associated with subtle microbiota changes at a genus level (enrichment of Parabacteroidetes)
[251] 51 No data
Bifidobacterium lactis HN019
6
milk (80 mL bottle × 1/day) 3.4 × 10⁸ CFU/mL
Significant differences in BMI variation (probiotic group −1.3 vs. −0.3 kg/m2 in control group, p = 0.017); TC variation (probiotic group −15 vs. 6 mg/dL in control group, p = 0.09) and LDLc variation (probiotic group −17.5 vs. −2 mg/dL in control group, p = 0.08). Significant decrease in TNFα and IL−6 (p < 0.05) in the probiotic group
[252] 81 Control group: 58.72 ± 7.25
Low-dose group: 56.38 ± 6.55
High-dose group: 55.16 ± 6.87
Bifidobacterium bifidum W23, Bifidobacterium lactis W51, Bifidobacterium lactis W52, Lactobacillus acidophilus W37, Lactobacillus brevis W63, Lactobacillus casei W56, Lactobacillus salivarius W24, Lactococcus lactis W19, and Lactococcus lactis W58
12
lyophilisate powder low dose (2.5 × 10⁹ CFU/day) or high dose (1 × 10¹⁰ CFU/day)
Significant differences were found in glucose variation (HD vs. placebo −0.61 mg/dL, p= 0.0272; HD vs. LD −0.72 mg/dL, p = 0.0043), insulin (HD vs. placebo −0.83 UI/L, p = 0.0002; HD vs. LD −0.40 UI/L, p = 0.0155), and HOMA-IR (HD vs. placebo −0.90, p = 0.0005; HD vs. LD −0.54 mg/dL, p = 0.0127). Significant differences were found in uric acid (HD vs. placebo −0.73 mmol/L, p = 0.0109; HD vs. LD −0.92 mmol/L, p = 0.0016) and LPS levels (HD vs. placebo −0.99 ng/mL, p = 0.001)
[253] 81 Control group: 58.72 ± 7.25
Low-dose group: 56.38 ± 6.55
High-dose group: 55.16 ± 6.87
Bifidobacterium bifidum W23, Bifidobacterium lactis W51, Bifidobacterium lactis W52, Lactobacillus acidophilus W37, Lactobacillus brevis W63, Lactobacillus casei W56, Lactobacillus salivarius W24, Lactococcus lactis W19, and Lactococcus lactis W58
12
lyophilisate powder low dose (2.5 × 10⁹ CFU/day) or high dose (1 × 10¹⁰ CFU/day)
No changes were found in BMI and BP. Significant differences were found in the pulse wave analysis systolic pressure (HD vs. placebo −1 mmHg, p = 0.0054; HD vs. LD −0.91 mmHg, p = 0.0057), the pulse wave analysis augmentation index (HD vs. placebo −0.55, p = 0.0079), the pulse wave velocity (HD vs. placebo −0.82 m/s, p = 0.0045; HD vs. LD −0.55 m/s, p = 0.0189), VEGF (HD vs. placebo −1.09 pg/mL, p = 0.0001; HD vs. LD −1.10 pg/mL, p = 0.0007), TNFα (HD vs. placebo −1.03 pg/mL, p = 0.0009; HD vs. LD −0.68 pg/mL, p = 0.0471), and thrombomodulin levels (HD vs. placebo −0.78 ng/mL, p= 0.0194)
[254] 44 Control group: 44.55 ± 5.70
Probiotic group: 44.05 ± 6.60
Lactobacillus acidophilus La5, Bifidobacterium lactis Bb12
8
yogurt containing 6.45 × 10⁶ CFU/g of L. acidophilus and 4.94 × 10⁶ CFU/g of B. lactis Bb12
Consumption of probiotic yogurt resulted in a significant reduction in the level of blood glucose (mean difference: −3.80, p = 0.01). Consumption of probiotic yogurt resulted in a significant reduction in the level of VCAM-1 (mean difference −463.39, p = 0.001)
BMI: body mass index, BP: blood pressure, CFU: colony-forming units, CI: confidence interval, CRP: C-reactive protein, FM: fermented milk, HD: high dose, HOMA-IR: homeostasis model assessment–insulin resistance, IL-6: interleukin-6, LBP: lipopolysaccharide-binding protein, LcS: Lactobacillus casei Shirota, LD: low dose, LDLc: low-density lipoprotein cholesterol, LPS: lipopolysaccharide, NFM: non-fermented milk, TC: total cholesterol, VCAM-1: vascular cell adhesion molecule 1, VEGF: vascular endothelial growth factor.

2.5. Coconut Oil Effect on Asymmetric Dimethylarginine (ADMA)

Diet has been shown to be one of the most crucial factors that contribute to MetS. Additionally, dietary fats are well known to affect lipoprotein and triglyceride levels [256]. Therefore, many studies have evaluated the effect of dietary fat on MetS. Some of them suggested that reducing dietary fat had a beneficial effect [257]. However, several other studies indicated that the type of fats that an individual consumes is more essential than the quantity of fat for the treatment of MetS [258].
Saturated and trans fatty acids are generally considered to have negative effects on cardiovascular risk, and recent studies have advised reducing their consumption to no more than 10% of total calories daily [259]. Conversely, medium-chain fatty acid (MCFAs) and SCFA consumption showed a beneficial effect on MetS [260].
Lately, several studies have evaluated the beneficial effect of coconut oil as an antithrombotic, anti-inflammatory, and hypolipidemic agent [261]. Coconut oil has an elevated quantity of MCFAs—it is made of 8% caprylic acid, 7% capric acid, 8% myristic acid, 2% stearic acid, 6% oleic acid, 8% palmitic acid, 2% linoleic acid, and 49% lauric acid [262]. Although 85% of coconut oil is composed of saturated fatty acid (SFA), the major SFA, lauric acid, has been shown to have positive health outcomes in CVD risk profile and body composition when compared with other SFAs such as palmitic acid, which exists mainly in palm oil, butter, and animal fat [263]. Additionally, when compared with refined coconut oil, virgin coconut oil (VCO) has a more antioxidant effect because of the high proportion of phenolic content. Consequently, by decreasing oxidative stress, it has further benefits in preventing cardiovascular dysfunction [261].

3. Conclusions

A cluster of components or risk factors are associated with an increased risk of CVDs and T2DM, and MetS has a prevalence that has been on the rise across all ages. While it is not clear if MetS can be treated in and of itself, ongoing research seems to be unlocking different targets along the disease’s pathway. Concentrating therapeutic efforts on treating the excess adiposity and insulin resistance associated with the MetS may provide the most overall success in attaining these goals. Much has been answered in the past few years, but much remains to be unraveled. The associations of MetS with other comorbidities such as NAFLD, sleep disorders, reproductive tract disorders, and microvascular disease are examples of areas yet to be fully determined.

This entry is adapted from the peer-reviewed paper 10.3390/ijms23020786

This entry is offline, you can click here to edit this entry!
Academic Video Service