Heart Health Monitoring Service Platform is a concept that allows medical device manufacturers to offer diagnosis support for a range of diseases to healthcare providers. The proposed platform is based on heart rate monitoring and the diagnosis support is achieved with deep learning.
- Platform
- Heart rate
- Computer aided diagnosis
- Deep learning
- Atrial fibrillation
- Stroke
- Cardiovascular disease
- Diabetes
Definition
To address this need, we put forward the idea that the combination of Heart Rate (HR) measurements, Internet of Things (IoT), and advanced Artificial Intelligence (AI), forms a Heart Health Monitoring Service Platform (HHMSP). This service platform can be used for multi-disease monitoring, where a distinct service meets the needs of patients having a specific disease. The service functionality is realized by combining common and distinct modules. This forms the technological basis which facilitates a hybrid diagnosis process where machines and practitioners work cooperatively to improve outcomes for patients.
1. Introduction
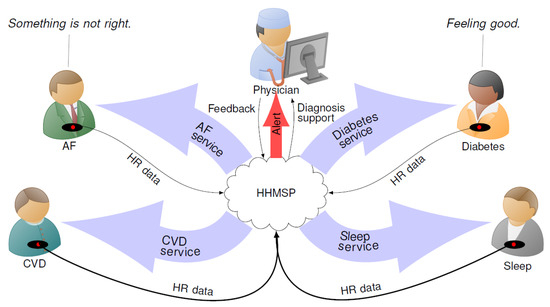
Figure 1. Overview diagram of the Heart Health Monitoring Service Platform (HHMSP).
2. System Architecture
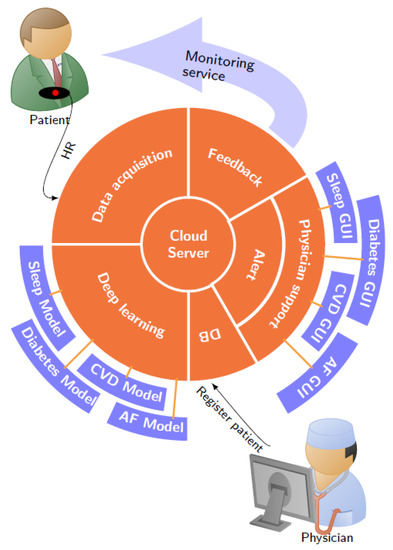
Figure 2. Heart Health Monitoring Service Platform (HHMSP) architecture. The common modules are in orange and the distinct modules are in blue. Abbreviations in the figure: Cardiovascular Disease (CVD), Atrial Fibrillation (AF), and Graphical User Interface (GUI).
3.1. DB Module
3.2. Data Acquisition Module
The measurement setup is straight forward. The patient wears a breast strap with an embedded HR sensor. The sensor picks up the electrical activity which indicates the human heartbeat, known as the R peak. The time between two consecutive R peaks is measured and the resulting value is communicated to the mobile phone as the RR interval. A stream of RR intervals is referred to as HR signal. We tested our system with two commercially available sensors, namely Polar H10 and Polar H7 (www.polar.com/uk-en). Low power Bluetooth is used to transfer the data from the HR sensor to an Android smartphone or tablet.
The heart health app relays the sensor information to the IoT cloud server. The data exchange with the IoT cloud server is facilitated by an Internet connection. Figure 3 shows a screen shot of the heart health app, which was created by extending the BLEConnect program (https://github.com/mobilars/BLEConnect). The background shows an averaged HR trace. The dialogue in the foreground requests the user to enter the login data for the IoT server. Each user has a unique cloud server login key. Both the patient and authorized caregivers can access the patient’s data using the same cloud server login key, which is stored in the DB module.
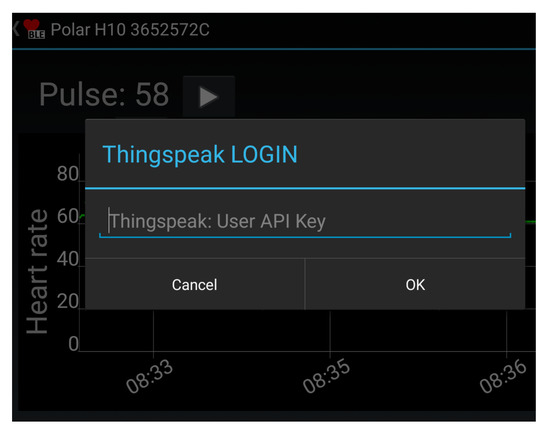
Figure 3. Screen shot of the heart health app which relays the sensor data to the cloud server.
3.3. Cloud Server
3.4. Deep Learning Module
The deep learning module reads new entries from the RR_interval_data channel and writes the classification outcomes to the AF_detection_result channel. The DL system was used because of its ability to detect the disease based on hidden information present in the HR signals. As such, DL does not require feature engineering. This is a significant improvement compared to conventional machine learning algorithms [10]. The absence of feature engineering makes DL robust when it classifies samples from a larger data set. In a clinical setting, this robustness translates to high-quality diagnostic support for patients using HR signals. Each disease requires a distinct DL model. Based on information from the DB module (disease type), the deep learning module selects the appropriate model for the HR to be analyzed.
The AF module was created by training the DL system using labeled HR data obtained from PhysioNet’s AFDB (www.physionet.org/physiobank/database/afdb/). Based on data from 20 subjects, the system achieved an accuracy of 98.51% with 10-fold cross-validation [15]. The blindfold classification performance, with 99.77% accuracy, indicates that the model is able to deliver high quality diagnostic support for patients using HR signals.
3.5. Alert Module
3.6. Physician Support Module
The assigned physician has access to the HR data and DL diagnostic support through the HHMSP. As such, HR signals are complex and their waveform resembles noise. Therefore, disease detection, with the naked eye, is inefficient and error prone. Algorithm support is needed to extract relevant information from the signal. The HHMSP physician support module incorporates algorithm support in the form of DL results and features. The use case scenario for the module unfolds as follows. The assigned physician receives an alert from the alert module with information about the patient condition. Figure 1 shows an example where the physician received an alert message, because the DL system detected an AF episode in the HR signal from one of the patients. By using the physician support module, the assigned physician confirms or rejects the DL assessment and establishes a diagnosis [72]. Then the diagnosis will be communicated to the patient and other stakeholders via the feedback module, as discussed in the next section.
Figure 4 shows a screenshot of the prototype HHMSP physician support module with the AF GUI. This module was developed by extending the Heart Rate Variability Analysis Software (HRVAS) (https://github.com/jramshur/HRVAS). The drop-down list allows the assigned physician to select a patient based on the patient ID, as provided by the DB module. The left-hand side of the figure visualizes the automated decision support from the deep learning module. The right-hand side shows the HRV signal features which were designed to help the assigned physician to validate the DL results.
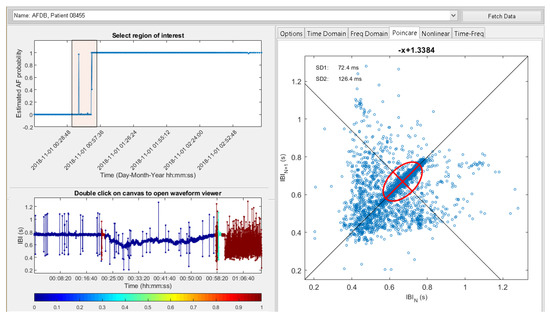
Figure 4. Physician support with the modified Heart Rate Variability Analysis Software (HRVAS) program.
In the example, shown in Figure 4, the patient with ID 08455 was selected, because of an alert message. After pressing ”Fetch Data” the DL results are displayed as estimated AF probability over time, in the upper left corner of the figure. In the timeline, the assigned physician can select a region of interest. Once the region is identified, the support tool fetches the corresponding HR signal segment and calculates a wide range of features from that segment. The feature extraction results are displayed on the right side. Figure 4 shows the selected region of interest as a light red square in the timeline plot. The square area encompasses a spike in estimated AF probability and a step edge. The estimated AF probability is reflected in the color scheme of the HR graph shown in the lower left corner. The color bar maps the estimated AF probability to a specific color, for example a low probability is blue and a high probability is red. The small red region in the HR graph reflects the spike. Similarly, the red region on the right of the HR graph reflects the step edge. The Poincaré plot [73], as well as features SD1 and SD2, for the selected HR signal segment are displayed on the right side of Figure 4.
3.7. Feedback Module
3.8. Testing
The HHMSP was tested with the AF monitoring service. By doing that, we tested all common modules for data handling and the specific modules which establish diagnostic support. To verify all aspects of the AF monitoring service, we registered two healthy volunteers with the DB module. Subsequently the volunteers were fitted with HR sensors and their data was communicated and processed by the HHMSP. To be specific, their data was processed with the deep learning module which executed the AF specific DL model. However, the DL results were not verified by a cardiologist. Therefore, no diagnosis was established and the results have only an indicative character.
To validate both deep learning and physician support modules for the AF monitoring service, we streamed benchmark data from PhysioNet’s MIT-BIH Atrial Fibrillation Database [74] to the data acquisition module. Figure 4 shows a screenshot of the physician support module which details both DL and feature extraction results for the benchmark data. Apart from visual inspection, enabled by the physician support module, we also compared the deep learning module results for the benchmark data with the results for the same benchmark data obtained by a previous study on the automated detection of atrial fibrillation using a long short-term memory network with RR interval signals [15]. In that study, we used the same model as in the deep learning module. We established that the DL results were the same. With that, we could validate both data acquisition and deep learning modules. Furthermore, that validation confirmed that the AF monitoring service achieved 99.77% accuracy with benchmark data.
This entry is adapted from the peer-reviewed paper 10.3390/ijerph17176313