Your browser does not fully support modern features. Please upgrade for a smoother experience.
Please note this is an old version of this entry, which may differ significantly from the current revision.
Hypovolemia is a physiological state of reduced blood volume that can exist as either (1) absolute hypovolemia because of a lower circulating blood (plasma) volume for a given vascular space (dehydration, hemorrhage) or (2) relative hypovolemia resulting from an expanded vascular space (vasodilation) for a given circulating blood volume (e.g., heat stress, hypoxia, sepsis). The external environment and the user's level of physical activity can exacerbate hypovolemic challenges to the body. Noninvasive, wearable sensing systems are being developed to track a user's ability to compensate for these challenges.
- wearable sensors
- compensatory reserve
- cardiac decompensation
1. Introduction
For many occupational, military and athletic situations, an individual may suffer marked hypovolemia, which impairs health, safety and performance. As discussed, hypovolemia can occur from dehydration or decreased total circulating protein and/or increased vascular space from cutaneous and skeletal muscle vasodilation induced by environmental exposure or performing physical work. It is important to note that the physiological responses to these conditions are highly individual, with some people exhibiting much greater tolerance and capacity to compensate for the conditions than others [1][2][3].
Decision-support wearable technologies are needed that can measure the integrated physiological compensation or decompensation providing ‘individualized’ assessment of progression towards hypovolemia-mediated compromised capacity, or degree of physiological adaptation to several stressors that protect against hypovolemia to sustain performance [4][5][6]. A ruggedized wearable physiological monitoring system that can reliably measure the magnitude of integrated physiological compensation or decompensation from hypovolemia would provide critical information to manage health, safety and optimize performance [5].
2. Compensatory Reserve
The compensatory reserve measure (CRM), a novel concept introduced by Convertino and colleagues, provides a single indicator, measured peripherally with noninvasive sensors, that could represent the sum of compensatory responses to hypovolemia and a validated index of potential cardiovascular instability [4]. The CRM uses a deep convolutional neural network to compute the distance or similarity between recorded vascular signal segments from either a non-invasive continuous blood pressure waveform or a transmissive photoplethysmogram (TPPG) waveform to a library of arterial waveforms recorded from subjects with known CRM as shown in Figure 1 [7]. The label from the library waveform with the closest distance or highest similarity to the incoming waveform is then assigned as the prediction value for the incoming waveform. The library used for comparisons contains noninvasive blood pressure waveforms recorded from more than 260 healthy subjects (men and women aged 18 to 55 years) who underwent graded lower body negative pressure (LBNP) to induce central hypovolemia until they reached a point of decompensated shock, which was labeled as 0% compensatory reserve [5]. “Decompensated shock” refers to the point at which the ongoing trauma or stress to the body overwhelms the body’s compensatory measures. For the CRM, 0% or “decompensated shock” was defined as the point during the LBNP protocol at which the subject experienced presyncope, indicating inadequate blood circulation to the brain. The subject’s normal baseline is then defined as 100% CRM, during which their body is not under any strain. The CRM’s performance in detecting and monitoring hypovolemia due to hemorrhage has been well documented [4] and researchers will present data demonstrating its sensitivity to heat stress, dehydration and physical exercise.
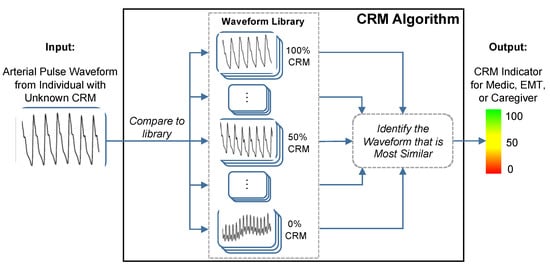
Figure 1. The conceptual framework of the compensatory reserve measure (CRM) algorithm. The input waveform from the current subject is compared to a library of more than 650,000 waveforms recordings collected from more than 260 subjects exposed to experimentally-controlled progressive reductions in central blood volume by lower-body negative pressure to generate an estimated individual compensatory reserve measurement (CRM). Image modified from [7].
3. Validation of Compensatory Reserve for Heat Stress, Dehydration and Physical Exercise
The compensatory reserve measure has been shown to be sensitive to hypovolemia induced by heat stress, physical exercise, dehydration, resting recovery and rehydration. Figure 2 presents results from experiments designed to determine if CRM differences could be observed with whole-body hyperthermia (heat stress) and if such differences would correspond to decreased tolerance to progressive hypovolemia induced by lower body negative pressure (LBNP) [8]. Healthy subjects underwent LBNP when normothermic (core temperature 37 °C) and hyperthermic (core temperature 38.3 °C), and after sweat-induced dehydration of 2% of their body mass. Mean baseline CRM were 92% on both days, however the cutaneous vasodilation during hyperthermia was associated with <50% in baseline CRM with a more rapid cardiovascular collapse. These data demonstrate that CRM is sensitive to relative hypovolemia induced by hyperthermia. During the euhydration (hydrated) and dehydration experiments all subjects were hyperthermic (core temperature 38.2 °C), thus experiencing relative hypovolemia (cutaneous vasodilation from hyperthermia) or relative with absolute hypovolemia (dehydration). CRM was initially lowered with dehydration compared to euhydration, and with LBNP the dehydrated subjects demonstrated a lower CRM with a more rapid onset of cardiovascular collapse (i.e., reduced physiological performance). Interestingly, the impact of dehydration with hyperthermia on CRM between experiments was initially more modest than with hyperthermia alone. These data demonstrate that CRM is sensitive to relative and absolute hypovolemia and their additive effects with increasing LBNP causing greater simulated hypovolemia.
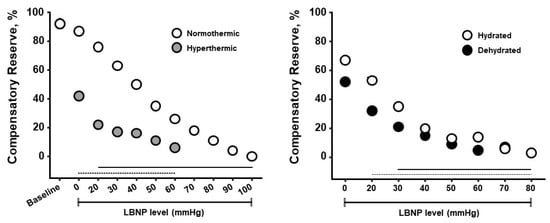
Figure 2. Compensatory reserve measures for normothermic vs hyperthermic subjects (left) and euhydrated vs dehydrated subjects (right) during progressive lower body negative pressure (LBNP) experiments. Data are means and 95% confidence intervals, with the solid lines at the bottom indicating statistically significant differences from baseline. Image modified from [5].
Several studies have demonstrated that CRM changes are sensitive to vasodilation and cardiovascular perturbations associated with physical exercise [9][10]. Figure 3 presents compensatory reserve values from subjects during progressive intensity cycle ergometer exercise until they achieved their maximal oxygen uptake (VO2max). CRM progressively decreased with increasing exercise intensity to an asymptote at ~20%. This response is logical as a greater oxygen uptake should translate to greater active vasodilation or relative hypovolemia. The asymptote at 20% suggests that blood pressure regulation was not the limiting factor for maximal intensity exercise.
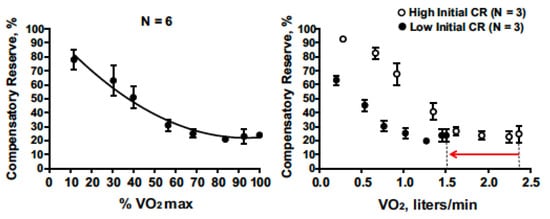
Figure 3. Compensatory reserve measure responses to progressive increases in aerobic exercise intensity (percent maximal aerobic power) that result in maximal exertion (left). On the (right), low baseline CRM (filled circles with 95% confidence intervals) is associated with lower maximal aerobic power (VO2max) compared to subjects with high initial CRM (open circles with 95% confidence intervals) with the final difference shown by the red arrow on the x-axis. Image from [5].
It is reasonable to anticipate that if this exercise was performed during heat stress conditions, CRM would have deceased further indicating muscle oxygen delivery as a more limiting factor.
Figure 4 provides the plotted measurements of compensatory reserve influenced by simultaneous exposure to physical exercise with heat stress and then resting recovery. In this figure, a human subject performed progressively increasing levels of physical exercise in a hot environment of 100 °F air temperature. Note the dramatic progressive reduction in compensatory reserve from a resting value of 91% in a room controlled at 75 °F air temperature to a significantly compromised level of <30% after only 20 min exposure to exercise and heat. After exercise was terminated and the subject recovered in the hot conditions, the compensatory reserve was restored to nearly 80%, suggesting that ~50% of the capacity to compensate for hypovolemia was attributed to the metabolic demand (active muscle vasodilation) of physical exercise while the remaining ~10% could be explained by the cutaneous vasodilation induced by heat. In this regard, a measurement of compensatory reserve provides an accurate integrated indicator of the individual’s physiological status for continued successful performance.
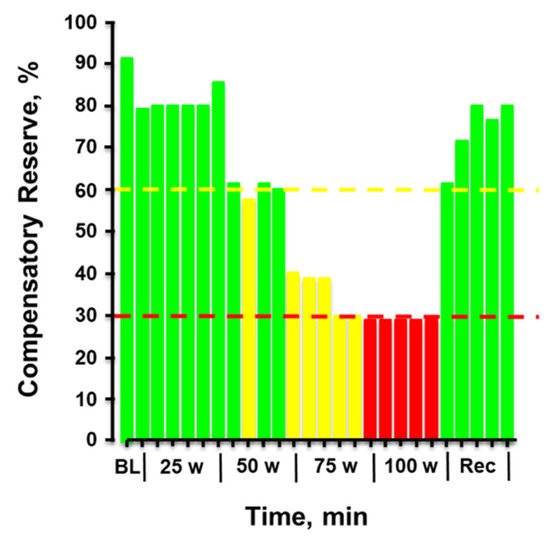
Figure 4. Compensatory reserve measured in a human subject during a 20-min graded cycle ergometer exercise performed at 100 °F air temperature. Each bar represents the average response over 1 min. Bar colors: green, compensatory reserve >60%; yellow, compensatory reserve ≤60% and >30%; red, compensatory reserve ≤30%. BL, baseline; W, watts. Image modified from [9].
Figure 5 provides the plotted measurements of compensatory reserve influenced by 45 min of running exercise with dehydration and the impact of subsequent rehydration [9]. With each bar representing a 3-min average measurement, a reduction in compensatory reserve was reported from a resting standing position ≥92% to 28% after exercise was terminated. It should be noted that the longer exercise duration (45 min vs. 20 min) vs the previous experiments should have resulted in greater dehydration. Compensatory reserve was restored to approximately 60% within 10 min of the cessation of metabolic load created by the exercise and continued to recover to baseline levels of >90% as fluid ingestion reversed the absolute hypovolemia created by prolonged exposure to physical exercise with an unknown amount of dehydration. In this regard, a measurement of compensatory reserve provided an accurate integrated indicator of the individual’s physiological status and a way to assess recovery from heat stress and dehydration.
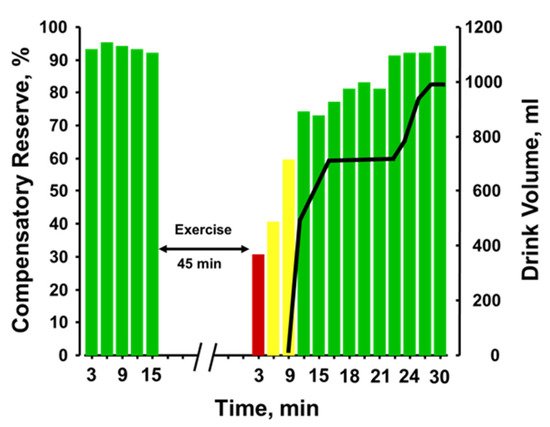
Figure 5. Compensatory reserve measures before and after 45 min of running exercise in the heat and resting recovery (10 min) and then fluid replacement (black line). Bar colors: green, compensatory reserve >60%; yellow, compensatory reserve ≤60% and >30%; red, compensatory reserve ≤30%. BL, baseline; W, watts. Image modified from [9].
4. Future Capabilities Required to Further Advance the CRM
Although the CRM has been validated in its ability to track physiological changes in many different scenarios, it is potentially limited for use in humans in ambulatory or field settings in its current form, as it requires the use of either a noninvasive continuous blood pressure monitor (i.e., Finapres) or a transmissive (T) PPG sensor [6]. Continuous noninvasive blood pressure systems, while used in clinics and research labs, are far too bulky and expensive for an individualized monitoring device. Additionally, the TPPG sensor type is generally considered too obtrusive for wear-and-forget use, as it has to clamp over the recording site, which is most often a finger or sometimes an earlobe [11]. These locations are likely motion sensitive or hindering to the wearer. Moreover, many commercially available TPPG (or pulse oximeter) devices such as those frequently seen in hospitals and clinics have substantial filtering and automatic gain control built in, forcing the waveforms to be smoothed and homogenized. While this is optimal for their designed function of providing heart rate and SpO2 measurements, rich waveform information that could be used to estimate CRM is lost. The CRM has also not yet been validated in the presence of motion artifacts and external vibrations that will likely degrade the recorded arterial waveforms. A ruggedized wear-and-forget form factor is much more likely to be widely adopted for longitudinal monitoring for occupational, military and sports use [5][6]. Thus, a later section of this review will examine emerging wearable mechanical sensors, such as the seismocardiogram (SCG), which should be able to provide complementary or additional information to expand upon the current CRM. The SCG records the acceleration of the chest wall due to heart contraction and blood ejection movements as valves open and close.
One advantage of adding SCG signals to the CRM could be to decouple changes in the signals used for deriving CRM that are related to peripheral effects—e.g., vasodilation and altered vascular stiffness—from changes that are related to central effects—e.g., reduced preload. The substantial reduction in CRM for the hyperthermic individuals in Figure 1 (left) vs Figure 2 (right) even at 0 mmHg of LBNP suggests that peripheral vasodilation (from the hot environment) may be confounded to some extent with reduced compensatory reserve. PPG signals are very sensitive to ambient temperature and skin temperature in their waveform characteristics [12][13], and thus the combination of PPG (a peripheral measure) with SCG (a central measure) might be advantageous in future work to predict cardiovascular instability in individuals exercising in the heat. Finally, though the CRM has presented a convenient single metric to encapsulate a patient’s cardiovascular status, it utilizes a black-box deep learning approach for waveform comparisons that does not provide a direct linkage between algorithm features and physiological phenomena. An example feature that could be extracted for use with the current setup is measurement of arterial oxygen saturation, which will vary due to changes in altitude or sickness and could be combined with compensatory reserve [14].
5. Blood Volume Decompensation Status: Multi-Sensor Fusion with Explainable AI
Encouraged by the results from CRM, a collaboration led by Inan and colleagues recently developed the blood volume decompensation status (BVDS) metric [15][16]. The goal of the BVDS metric builds from that of the CRM—to develop a single metric that represents the integrative compensatory response based on some aspect of PPG feature changes, and thus can be used to represent an individual’s compensatory reserve or decompensation status. One main difference between the BVDS and the CRM algorithmic approach is that the BVDS approach makes use of multi-modal cardiovascular sensing. A second main difference is that the BVDS approach leverages explainable AI approaches such that the exact features of the waveforms driving the output result can be individually examined from a physiological perspective. Thirdly, rather than using a TPPG sensor, the BVDS was developed with a reflectance-mode photoplethysmogram (RPPG) sensor, which can be placed anywhere on the body. Beyond capturing vascular information, electromechanical information from the heart is integrated into the BVDS metric by recording the electrocardiogram (ECG) and seismocardiogram (SCG) signals. This customized and modular sensing system design including ECG, SCG and RPPG sensors can be deployed in a wearable patch or smartwatch as shown in Figure 6 [17][18].
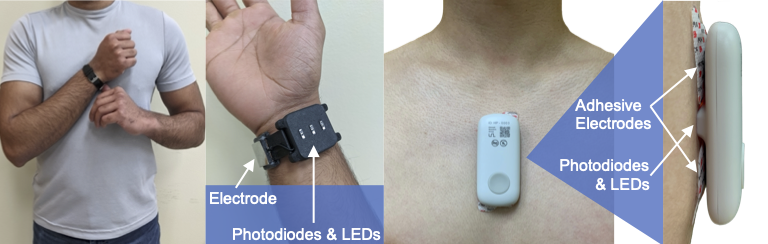
Figure 6. Device form factor. Electrodes for a single-lead ECG, photodiodes and LEDs to record the PPG, and tri-axial accelerometers and gyroscopes (internal to the devices) to acquire the SCG signal can be customized and modularized to work in multiple form factors. The left side shows the watch-based approach described in [18], while the right side shows an updated version of the chest-worn patch originally described in [17].
The BVDS metric has thus far been limited to a single preclinical animal (pig) study and is thus at an earlier stage of development. In this study, the animals underwent both relative and absolute hypovolemia through graded vasodilation and hemorrhage, as well as resuscitation with whole blood. ECG, SCG and RPPG were recorded continuously through the experiment. As shown in Figure 7, the inclusion of the ECG allows for feature extraction on a heartbeat-by-heartbeat level. A limited set of clinically relevant features was extracted from the ECG, SCG and RPPG signals. This set includes the pre-ejection period (PEP) and left ventricular ejection time (LVET) cardiac timing intervals, their ratio (PEP/LVET), the RPPG pulse arrival time (PAT) and pulse transit time (PTT), the plethysmography variability index (PVI) and RPPG amplitude, as well as heart rate (HR) and heart rate variability (HRV) measures. An initial model was developed using only the hemorrhage data recorded from the noninvasive sensors and compared to another model created with an analogous feature set extracted from simultaneously acquired invasive catheter blood pressure waveforms [16]. The BVDS model was further developed as data from the relative and absolute portions of the experiment were used together to train the random forest regression model with leave-one-subject-out cross validation to create a more generic metric of decompensation status [15]. The feature importance output by this model is shown in Figure 8, indicating that electromechanical features of cardiac performance were the most important predictors. This result shows that the ECG and SCG signals contain information that is very relevant to decompensation status or compensatory reserve. In particular, the ratio of PEP/LVET was the most important feature. In the literature, PEP/LVET has been shown to be a clear indicator of left ventricular performance [19][20] and changes in PEP/LVET have been shown to correlate with different stages of lower-body negative pressure [21].
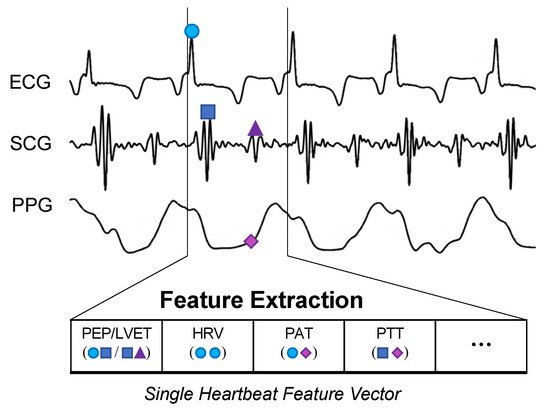
Figure 7. BVDS feature extraction. While the CRM evaluates 30-s segments of the recorded arterial waveform signal, the BVDS metric uses the ECG to segment and analyze all signals on a heartbeat-by-heartbeat level. Fiducial points are detected in each heartbeat and used to calculate cardiac timing intervals and a handful of other clinically relevant features.
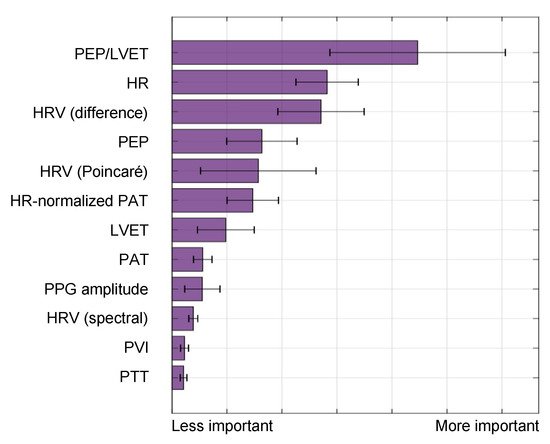
Figure 8. Feature importance for the BVDS model, as output by the random forest algorithm in [15]. Electromechanical features include the pre-ejection period (PEP), left ventricular ejection time (LVET) and their ratio, PEP/LVET along with heart rate (HR) and multiple measures of heart rate variability (HRV). Vascular features include the distal (and normalized) pulse arrival time (PAT), the distal pulse transit time (PTT), the PPG amplitude and the plethysmograph variability index (PVI). PEP/LVET is the most important feature for this model by a large margin, and six of the top seven features are from an electromechanical signal. This result highlights the relevance of including the ECG and SCG signals in predicting cardiovascular decompensation. Image modified from [15].
6. Validation of Decompensation Status
Although the BVDS metric has only been validated in a single study thus far, it has shown promise as a globalized metric for predicting decompensation status in both relative and absolute hypovolemia as well as for resuscitation with whole blood following hemorrhage. The overall prediction results from this study are shown in Figure 9. In this figure, all predictions for all heartbeats for all pigs over the course of the entire protocol (baseline, relative and absolute hypovolemia and resuscitation) are aggregated. The mean and standard deviation for all graded decompensation status levels are shown, as well as the line of best fit through the means for each level. Status levels were defined such that 0% represents a baseline period and 100% represents full cardiovascular decompensation. Intermediate gradations were designated based on the percentage of blood removed during the hemorrhage portion of the experiment. As this model was created with data from separate interventions for relative and absolute hypovolemia and used to predict on hypovolemic, resuscitation and baseline periods, this represents a more generalized metric of cardiovascular decompensation status as compared to the previously published result focused on absolute hypovolemia alone.
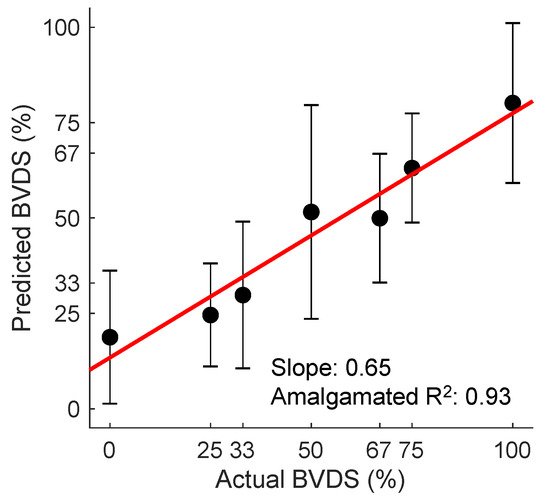
Figure 9. The BVDS metric performance in predicting decompensation. The line of best fit through the mean of the aggregated predictions for all animals during all portions of the experiment is shown in red. BVDS levels range on a scale from 0 to 100, with 100 indicating full decompensation status. The slope of the line (0.65) is an indicator of the overall prediction accuracy, while the R2 value of 0.93 is an indicator of the prediction consistency between BVDS levels. Standard deviation bars are also shown for each level, indicating the consistency of predictions within a single decompensation level. Image modified from [15].
The wearable chest-worn patch [17] that provides measures of simultaneous ECG, SCG and PPG (and thus could be used to monitor BVDS) has been used in other studies. The most pertinent data may have been generated in a study designed to segregate patients with compensated and decompensated heart failure [22]. In heart failure, patients are generally hypervolemic rather than hypovolemic, while still experiencing poor circulation and perfusion. Additionally, environmental stressors and exercise exacerbate their poor cardiac performance, particularly for patients with decompensated heart failure. In this study, the structure of the SCG signals recorded with the patch was studied in 45 patients with heart failure before and after a standard six-minute walk test, after which a similarity score was computed from the graph representing the structure of the SCG data in the spectral domain. As seen in Figure 10, significant differences in the SCG signal structure were found between decompensated heart failure patients at admission and at discharge after receiving treatment. It is notable that some patients responded much better to the treatment than others, again highlighting the need for individual-specific metrics of performance. Specifically, decompensated patients had a higher graph similarity score comparing their SCG before and after the walk test than did compensated patients, indicating a higher similarity in contractility and cardiovascular hemodynamics between rest and recovery, meaning their cardiovascular systems were unable to compensate for the strain of exercise. In short, the decompensated patients experienced a lower compensatory reserve than compensated heart failure patients. In turn, researchers would expect heart failure patients (and those who are yet to be diagnosed) to experience a lower operating compensatory reserve and a faster decline of their reserve than healthier patients for a similar amount of physical activity, including activity in the workplace.
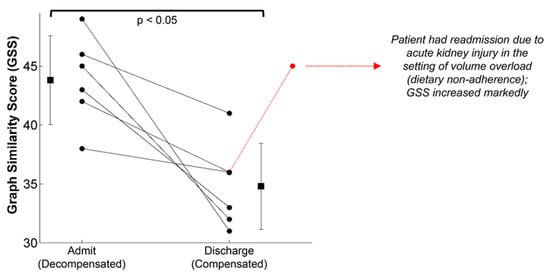
Figure 10. The graph similarity score representing structural differences in the SCG signal recorded from a wearable patch found significant differences between compensated and decompensated heart failure patients from admission to discharge. Though all patients improved following treatment, some patients responded much better to the treatment than others. Image from [22].
7. Advancements and Next Steps
The BVDS metric requires validation in additional studies. As the initial algorithm was developed in an animal model, new datasets should be curated from human subjects with realistic progression of perturbations that includes both relative and absolute hypovolemia. Realistic noise sources should also be included in this development in the form of data from both free-moving subjects and those being transported in multiple classes of vehicles. Advanced modeling techniques, such as the graph analysis described for the heart failure study, and other techniques ,such as transfer learning and time series analysis, should be explored.
The previously constructed wearable sensing patch for ECG, SCG and environmental context sensing was designed for use in patients with heart failure—a frail population of older patients that would wear the device around the home and during normal activities of daily living. To enable usage of this patch for wearable sensing in the context of human performance—i.e., occupational, military, and sports applications—the hardware should be ruggedized, appropriately miniaturized, and validated with a broad range of environmental testing scenarios. For example, the hardware and adhesives must be designed to tolerate high moisture levels such as heavy sweating. The mechanical coupling integrity of the sensing system to the chest should be evaluated at high levels of vibration that could result from motion artifacts or other external vibration sources, as well as in the presence of fluids such as sweat or blood. To this end, some initial testing and validation work has been conducted at Georgia Tech with healthy human subjects performing various exercise tasks both indoors and outdoors, and with signals being measured in the presence of external vibrations [23][24][25].
When it comes to addressing motion artifacts, there are two main stages that should be considered. The first is developing customizable signal quality indices (SQI) to remove portions of the recording that contain too much noise. The second stage then takes the output from the SQI and processes the signal in the presence of remaining noise. ‘Motion artifacts’ include any noise sources related to the user—physical movement, speech, interference from clothing or gear, etc. The SCG and PPG have been criticized for their susceptibility to motion artifacts; however, recent studies demonstrate that PPG and SCG can be ruggedized for free-range use. Clifford and colleagues have developed quality indices for hospital-grade ECG and PPG signals and shared them through their open-source cardiovascular waveform toolbox on PhysioNet [26]. An SQI developed specifically for SCG signals (but that can be applied to other signals such as PPG) is presented in [27]. This study retroactively stratified SCG heartbeat quality recorded from subjects during rest, exercise and recovery. Heartbeats from the SCG were segregated based on their similarity to a template beat, allowing for higher quality beats to be identified during the noisier periods such as exercise. Multiple groups have made progress on the second stage processing for SCG and PPG signals. Yang et al. utilized an adaptive filtering technique to effectively process SCG recordings in walking subjects [28]. Additional studies have indicated that using a gyroscope along with an accelerometer to record the SCG can improve signal feature estimations, possibly due to differing levels of noise in the linear and angular domains [29][30]. By including an array of sensors and leveraging independent component analysis, Yang et al. were able to extract relevant cardiac timing intervals from the SCG in both walking and jogging subjects, tested up to 4.6 mph [31]. Beyond SCG improvements, multi-wavelength PPG analysis shows promise for developing more robust feature extraction methods [18][32]. Adaptive filtering and signal deconstruction/reconstruction approaches have also been utilized for analyzing PPG recordings from subjects during moderate and intensive exercise [33][34].
The problem of reducing the impact of external vibration sources, such as vehicles, on SCG and PPG recordings has been less-thoroughly explored than the problem of reducing motion artifacts in general. One group recorded the SCG of a single subject for an entire day, including commuting to and from the office in a subway train [35]. To process the portions with subway noise, Di Rienzo et al. utilized an ensemble averaging approach prior to annotating the heartbeats. In a separate study, Lin et al. combined SCG recordings with accelerometer recordings taken on a subway train and used an ensemble empirical mode decomposition approach to remove the vehicular noise [24]. Similar approaches could potentially be used to remove noise from additional transport vehicles or other external vibration sources.
This entry is adapted from the peer-reviewed paper 10.3390/s22020442
References
- Sawka, M.N.; Young, A.J.; Latzka, W.A.; Neufer, P.D.; Quigley, M.D.; Pandolf, K.B. Human Tolerance to Heat Strain During Exercise—Influence of Hydration. J. Appl. Physiol. 1992, 73, 368–375.
- Schiller, A.M.; Howard, J.T.; Convertino, V.A. The physiology of blood loss and shock: New insights from a human laboratory model of hemorrhage. Exp. Biol. Med. 2017, 242, 874–883.
- Crandall, C.G.; Rickards, C.A.; Johnson, B.D. Impact of environmental stressors on tolerance to hemorrhage in humans. Am. J. Physiol.-Regul. Integr. Comp. Physiol. 2019, 316, R88–R100.
- Convertino, V.A.; Koons, N.J.; Suresh, M.R. Physiology of Human Hemorrhage and Compensation. Compr. Physiol. 2021, 11, 1531–1574.
- Convertino, V.A.; Sawka, M.N. Wearable technology for compensatory reserve to sense hypovolemia. J. Appl. Physiol. 2018, 124, 442–451.
- Convertino, V.A.; Schauer, S.G.; Weitzel, E.K.; Cardin, S.; Stackle, M.E.; Talley, M.J.; Sawka, M.N.; Inan, O.T. Wearable Sensors Incorporating Compensatory Reserve Measurement for Advancing Physiological Monitoring in Critically Injured Trauma Patients. Sensors 2020, 20, 6413.
- Convertino, V.A.; Wirt, M.D.; Glenn, J.F.; Lein, B.C. The Compensatory Reserve for Early and Accurate Prediction of Hemodynamic Compromise: A Review of the Underlying Physiology. Shock 2016, 45, 580–590.
- Gagnon, D.; Schlader, Z.J.; Adams, A.; Rivas, E.; Mulligan, J.; Grudic, G.Z.; Convertino, V.A.; Howard, J.T.; Crandall, C.G. The Effect of Passive Heat Stress and Exercise-Induced Dehydration on the Compensatory Reserve During Simulated Hemorrhage. Shock 2016, 46, 74–82.
- Stewart, C.L.; Nawn, C.D.; Mulligan, J.; Grudic, G.Z.; Moulton, S.L.; Convertino, V.A. Compensatory Reserve for Early and Accurate Prediction of Hemodynamic Compromise: Case Studies for Clinical Utility in Acute Care and Physical Performance. J. Spec. Oper. Med. 2016, 16, 6–13.
- Mulder, M.B.; Eidelson, S.A.; Buzzelli, M.D.; Gross, K.R.; Batchinsky, A.I.; Convertino, V.A.; Schulman, C.I.; Namias, N.; Proctor, K.G. Exercise-Induced Changes in Compensatory Reserve and Heart Rate Complexity. Aerosp. Med. Hum. Perform. 2019, 90, 1009–1015.
- Tamura, T.; Maeda, Y.; Sekine, M.; Yoshida, M. Wearable Photoplethysmographic Sensors-Past and Present. Electronics 2014, 3, 282–302.
- Jeong, I.C.; Yoon, H.; Kang, H.; Yeom, H. Effects of Skin Surface Temperature on Photoplethysmograph. J. Healthc. Eng. 2014, 5, 429–438.
- Fine, J.; Branan, K.L.; Rodriguez, A.J.; Boonya-ananta, T.; Ajmal; Ramella-Roman, J.C.; McShane, M.J.; Cote, G.L. Sources of Inaccuracy in Photoplethysmography for Continuous Cardiovascular Monitoring. Biosensors 2021, 11, 126.
- Muza, S.R. Wearable physiological sensors and real-time algorithms for detection of acute mountain sickness. J. Appl. Physiol. 2018, 124, 557–563.
- Kimball, J.P.; Zia, J.S.; An, S.T.; Rolfes, C.; Hahn, J.O.; Sawka, M.N.; Inan, O.T. Unifying the Estimation of Blood Volume Decompensation Status in a Porcine Mode of Relative and Absolute Hypovolemia Via Wearable Sensing. IEEE J. Biomed. Health Inform. 2021, 25, 3351–3360.
- Zia, J.; Kimball, J.; Rolfes, C.; Hahn, J.O.; Inan, O.T. Enabling the assessment of trauma-induced hemorrhage via smart wearable systems. Sci. Adv. 2020, 6.
- Etemadi, M.; Inan, O.T.; Heller, J.A.; Hersek, S.; Klein, L.; Roy, S. A Wearable Patch to Enable Long-Term Monitoring of Environmental, Activity and Hemodynamics Variables. IEEE Trans. Biomed. Circuits Syst. 2016, 10, 280–288.
- Ganti, V.G.; Carek, A.M.; Nevius, B.N.; Heller, J.A.; Etemadi, M.; Inan, O.T. Wearable Cuff-Less Blood Pressure Estimation at Home via Pulse Transit Time. IEEE J. Biomed. Health Inform. 2021, 25, 1926–1937.
- Ahmed, S.S.; Schwartz, C.J.; Levinson, G.E.; Ettinger, P.O. Systolic Time Intervals as Measures of Contractile State of Left Ventricular Myocardium in Man. Circulation 1972, 46, 559.
- Lewis, R.P.; Rittgers, S.E.; Forester, W.F.; Boudoulas, H. Critical-Review of Systolic-Time Intervals. Circulation 1977, 56, 146–158.
- Tavakolian, K.; Dumont, G.A.; Houlton, G.; Blaber, A.P. Precordial Vibrations Provide Noninvasive Detection of Early-Stage Hemorrhage. Shock 2014, 41, 91–96.
- Inan, O.T.; Pouyan, M.B.; Javaid, A.Q.; Dowling, S.; Etemadi, M.; Dorier, A.; Heller, J.A.; Bicen, A.O.; Roy, S.; De Marco, T.; et al. Novel Wearable Seismocardiography and Machine Learning Algorithms Can Assess Clinical Status of Heart Failure Patients. Circ. Heart Fail. 2018, 11, e004313.
- Shandhi, M.M.H.; Hersek, S.; Fan, J.; Sander, E.; De Marco, T.; Heller, J.A.; Etemadi, M.; Klein, L.; Inan, O.T. Wearable Patch-Based Estimation of Oxygen Uptake and Assessment of Clinical Status during Cardiopulmonary Exercise Testing in Patients With Heart Failure. J. Card. Fail. 2020, 26, 948–958.
- Lin, D.J.; Kimball, J.P.; Zia, J.S.; Ganti, V.G.; Inan, O.T. Reducing the Impact of External Vibrations on Fiducial Point Detection in Seismocardiogram Signals. IEEE Trans. Biomed. Eng. 2022, 69, 176–185.
- Javaid, A.Q.; Ashouri, H.; Dorier, A.; Etemadi, M.; Heller, J.A.; Roy, S.; Inan, O.T. Quantifying and Reducing Motion Artifacts in Wearable Seismocardiogram Measurements During Walking to Assess Left Ventricular Health. IEEE Trans. Biomed. Eng. 2017, 64, 1277–1286.
- Vest, A.N.; Poian, G.D.; Li, Q.; Liu, C.; Nemati, S.; Shah, A.; Clifford, G.D. Cliffordlab/PhysioNet-Cardiovascular-Signal-Toolbox: PhysioNet-Cardiovascular-Signal-Toolbox 1.0.2. Zenodo 2019.
- Zia, J.; Kimball, J.; Hersek, S.; Shandhi, M.M.H.; Semiz, B.; Inan, O.T. A Unified Framework for Quality Indexing and Classification of Seismocardiogram Signals. IEEE J. Biomed. Health Inform. 2020, 24, 1080–1092.
- Yang, C.X.; Tavassolian, N. Motion Artifact Cancellation of Seismocardiographic Recording From Moving Subjects. IEEE Sens. J. 2016, 16, 5702–5708.
- Yang, C.X.; Tavassolian, N. Combined Seismo- and Gyro-Cardiography: A More Comprehensive Evaluation of Heart-Induced Chest Vibrations. IEEE J. Biomed. Health Inform. 2018, 22, 1466–1475.
- Shandhi, M.M.H.; Semiz, B.; Hersek, S.; Goller, N.; Ayazi, F.; Inan, O.T. Performance Analysis of Gyroscope and Accelerometer Sensors for Seismocardiography-Based Wearable Pre-Ejection Period Estimation. IEEE J. Biomed. Health Inform. 2019, 23, 2365–2374.
- Yang, C.X.; Tavassolian, N. An Independent Component Analysis Approach to Motion Noise Cancelation of Cardio-Mechanical Signals. IEEE Trans. Biomed. Eng. 2019, 66, 784–793.
- Kim, B.S.; Yoo, S.K. Motion artifact reduction in photoplethysmography using independent component analysis. IEEE Trans. Biomed. Eng. 2006, 53, 566–568.
- Yousefi, R.; Nourani, M.; Ostadabbas, S.; Panahi, I. A Motion-Tolerant Adaptive Algorithm for Wearable Photoplethysmographic Biosensors. IEEE J. Biomed. Health Inform. 2014, 18, 670–681.
- Zhang, Z.L.; Pi, Z.Y.; Liu, B.Y. TROIKA: A General Framework for Heart Rate Monitoring Using Wrist-Type Photoplethysmographic Signals During Intensive Physical Exercise. IEEE Trans. Biomed. Eng. 2015, 62, 522–531.
- Di Rienzo, M.; Vaini, E.; Castiglioni, P.; Merati, G.; Meriggi, P.; Parati, G.; Faini, A.; Rizzo, F. Wearable seismocardiography: Towards a beat-by-beat assessment of cardiac mechanics in ambulant subjects. Auton. Neurosci. Basic Clin. 2013, 178, 50–59.
This entry is offline, you can click here to edit this entry!