Your browser does not fully support modern features. Please upgrade for a smoother experience.
Please note this is an old version of this entry, which may differ significantly from the current revision.
Subjects:
Agriculture, Dairy & Animal Science
Prunus cornuta Wall. ex Royle (Rosaceae) and Quercus semicarpifolia Sm (Fagaceae) are widely found in the Himalayan regions of Pakistan and India. These plants contain numerous phytochemicals such as alkaloids, glycosides, flavonoids, and tannins. Traditionally, P. cornuta has been used to cure anemia. In contrast, Q. semicarpifolia is used to treat various ailments such as muscular pain, bleeding, chronic diarrhea, wound healing, inflammation, and dysentery.
- antibacterial
- anti-cancer
- medical plants
1. Background
The use of wild medicinal plants to treat human ailments has been known since ancient times. For pharmacological purposes, the unveiling of the potential of natural sources like plants is not a new approach [1]. Nearly 80% of the world population in developing countries relies on plants to treat many ailments like infections, pain management, wound healing, reproductive problems, skin infections, gut issues, etc. [2]. Due to the adverse effects of chemical entities, the preference for herbal products over synthetic medicine increases day by day. Still, many studies are required to explore the potential use of indigenous plants for human illnesses such as cancer and infectious diseases [3].
Bacterial infections are considered to be a significant health problem due to the genetic modification of microbes against a selected drug, resulting in various globally resistant bacterial species [4]. Research to find a better substance from a natural source to overcome this health hazard is always in progress. Several plants have been investigated for antibacterial activities [5]. In addition to this, cancer incidence is one of the leading causes of death in developing and developed countries. Its increasing prevalence results in vast and continuous economic losses throughout the world. Adverse effects of chemotherapy on the human body, like nausea, vomiting, alopecia, etc., demand the search for novel candidate plant species or medicinal agents with less toxic effects on normal cells and more toxicity against cancerous cells [6]. Plants and their derivatives can be helpful in cancer therapy. However, some wild medicinal plants that are still obscured in their pharmacological potential have been scientifically evaluated [7].
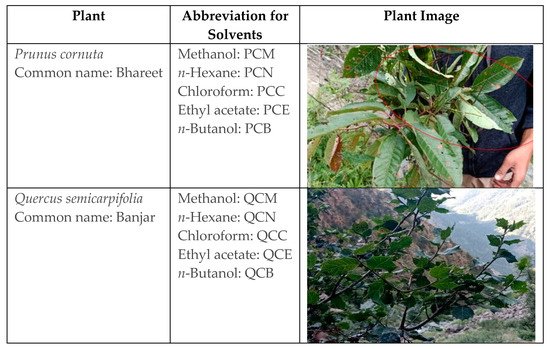
Prunus cornuta Wall. ex Royle (Rosaceae) and Quercus semicarpifolia Sm (Fagaceae) are widely found in the Himalayan regions of Pakistan and India [8][9][10]. These plants contain numerous phytochemicals such as alkaloids, glycosides, flavonoids, and tannins. Traditionally, P. cornuta has been used to cure anemia. In contrast, Q. semicarpifolia is used to treat various ailments such as muscular pain, bleeding, chronic diarrhea, wound healing, inflammation, and dysentery [11][12][13]. Therefore, the present study reports the phytochemical composition and therapeutic validation of P. cornuta (PC) and Q. semicarpifolia (QS) plants, particularly with antimicrobial and anticancer effects (Figure 1).

Figure 1. Details of plant species, common names, and solvents used for extraction.
2. Phytochemical Screening
The results of the phytochemical investigation of methanolic extracts are summarized in Table 1.
Table 1. Qualitative phytochemical analysis of methanolic crude extracts of selected plants.
| Constituents | Tests | PCM | QSM |
|---|---|---|---|
| Alkaloids | Mayer’s test | + | + |
| Hager’s test | + | + | |
| Tannins | FCl3 test | + | + |
| Alkaline reagent test | + | + | |
| Saponins | Foam test | + | + |
| Flavonoids | + | + | |
| Glycosides | + | + | |
| Sterols | N | + | |
| Phenols | N | + | |
| Carbohydrates | N | N | |
| Anthraquinones | + | N | |
| Phlobatanins | − | − | |
| Anthocyanin | − | − | |
| Quinones | + | + | |
| Protein | Xanthoproteic test | N |
Illustrated the qualitative indication of phytochemicals present in plant methanolic extracts. Abbreviations: + sign, present; − sign, absence; N, Not indicated.
3. Antimicrobial Potential
3.1. Antibacterial Effect
In this study, two strains, A. baumannii and S. enterica, were more sensitive than the other tested bacterial strains. Extracts showed the highest inhibition against A. baumannii, followed by S. enterica. Furthermore, extracts exhibited moderate activity against B. subtilis, K. pneumoniae, and E. coli. In PC extracts, the highest activity was observed by PCN and PCC (Table 2). The current study validated the excellent antibacterial activity of QS extract against K. pneumoniae, E. coli, B. subtilis, S. enterica, and A. baumannii, and QS extracts showed maximum inhibition with methanolic solvents, as shown in Table 2. All extracts exhibited potential bacterial inhibition activity from 9 to 18 mm to control (12 to 16 mm). In addition, both plant extracts showed significant antibacterial activity against A. baumannii as shown in Supplementary Data.
Table 2. Antibacterial activity of P. cornuta and Q. semicarpifolia extracts.
| Extract Solvents 4000 µg/mL |
B. subtilis | E. coli | K. pneumoniae | S. enterica | A. baumannii |
|---|---|---|---|---|---|
| Zone of Inhibition (mm) | |||||
| PCB | 11.5 | 11.0 | 11.5 | 14.5 | 16 |
| PCC | 13 | 13 | 12 | 13 | 14 |
| PCE | 12 | 11.5 | 13 | 13 | 13 |
| PCM | 11 | 11 | 12 | 14 | 13 |
| PCN | 12 | 14 | 11 | 15.5 | 15 |
| QSB | 12 | 13 | 12 | 8 | 15 |
| QSC | 12.5 | 11 | 13 | 8 | 14 |
| QSE | 12 | 12.5 | 11 | 10 | 16 |
| QSM | 14 | 15 | 13 | 10 | 18 |
| QSN | 11 | 12.5 | 12.5 | 7 | 16 |
| P | 12 | 13 | 16 | 15 | 12 |
| N | - | - | - | - | - |
Values are means of triplicate (n = 3), - means no activity, extracts in butanol (PCB, QSB), chloroform (PCC, QSC), ethyl acetate (PCE, QSE), methanol (PCM, QSM), and n-hexane (PCN, QSN). Low activity (7–10 mm); moderate (11–13 mm); high activity (14–18 mm).
3.2. Antifungal Effect
P. cornuta and Q. semicarpifolia have shown no significant inhibition of the fungal isolates A. flavus, A. niger, and Pythium sp., but not for R. oryzae. The susceptibility of R. oryzae by P. cornuta was observed in the PCM and PCN extracts only. In the case of Q. semicarpifolia, the maximum mycelial inhibition was observed in QSE (21 mm), followed by PCM and PCN (16.6 mm), as shown in Table 3. The percentage of mycelial growth inhibition was significant in R. oryzae, followed by F. fujikuroi isolates. R. oryzae appeared susceptible to PCM and PCE extracts with 67 and 64% mycelial inhibition, respectively. On the other hand, Q. Semicarpifolia restricted the R. oryzae fungal growth up to 57% with QSM and QSB extracts as shown in Supplementary Data Figure S3. The maximum mycelial inhibition against F. fujikuroi pathogen was observed with PCC extract (59%) and QSE (54%) (Table 4).
Table 3. Antifungal activity of P. cornuta and Q. semicarpifolia extracts.
| Extract | R. oryzae | A. flavus | A. niger | Pythium sp. |
|---|---|---|---|---|
| Zone of Inhibition (mm) | ||||
| PCB | - | - | - | - |
| PCC | - | - | - | - |
| PCM | 16.5 | - | - | 1.5 |
| PCN | 16 | - | - | - |
| QSB | 16 | - | - | - |
| QSC | 16 | - | - | - |
| QSE | 21 | - | - | - |
| QSM | 16 | - | - | 2.25 |
| QSN | 16.5 | - | - | - |
| DMSO | - | - | - | - |
| Terbinafine | 30 | 35 | 32.5 | 36 |
Values are means of triplicate (n = 3), - means no activity. Extracts in butanol (PCB, QSB), chloroform (PCC, QSC), ethyl acetate (PCE, QSE), Methanol (PCM, QSM), and n-hexane (PCN, QSN).
Table 4. Percentage inhibition of mycelial growth of F. fujikuroi, R. oryzae, and P. ultimum by plant extracts.
| Extracts | Fungal Isolates | ||
|---|---|---|---|
| F. fujikuroi | R. oryzae | P. ultimum | |
| PCB | 54 | 62 | 38 |
| PCC | 59 | 59 | 39 |
| PCE | 52 | 64 | 40 |
| PCM | 55 | 67 | 43 |
| PCN | 50 | 60 | 44 |
| QSB | 49 | 57 | - |
| QSC | 54 | 53 | - |
| QSE | 46 | 54 | - |
| QSM | 44 | 57 | - |
| QSN | 37 | 48 | - |
| Positive control/Terbinafine | 56 | 79 | 62 |
| Negative control | - | - | - |
%Age mycelial inhibition expressed as mean ± SD (n = 3). Lower inhibition = 20–30%, moderate inhibition = 40–50%, high inhibition = 60–80%. Positive control: Terbinafine.
3.3. Anticancer Activity
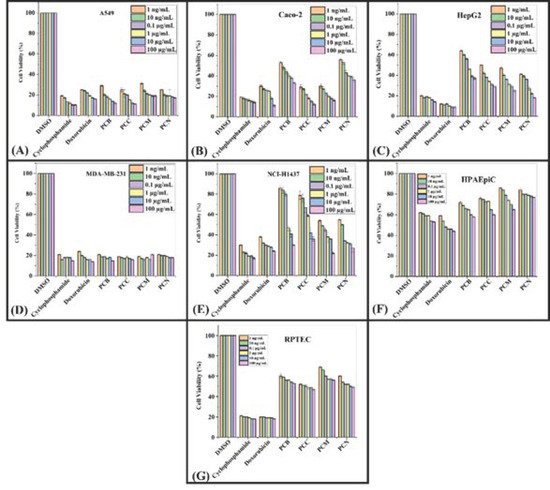
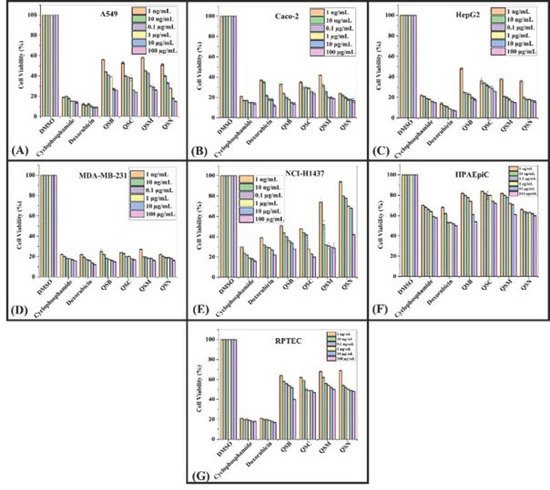
To assess the cytotoxic effect of P. cornuta and Q. semicarpifolia extracts on lung (A549), gut (Caco-2), liver (HepG2), breast (MDA-MB-231), and lung (NCI-H1437) cancer cell lines, an MTS assay was performed. The lower percentage cell viability values indicated a higher rate of cytotoxicity. Furthermore, the growth inhibition of cancerous cells was dose-dependent, where maximum growth inhibition was observed at the highest concentrations, i.e., 100 µg/mL (Figure 2 and 3).
The inhibitory effect of P. cornuta extracts was highest against MD-MBA-231 and potent against A549 and Caco-2 cells (100 µg/mL) (Figure 2A,B,D, respectively). Moreover, PC crude extracts showed moderate activity against HepG2 and NCI-H1437 (Figure 2C,E, respectively). However, all extracts showed less inhibition of cell proliferation in NCI-HI437 cells and good inhibition in MDA-MB-231 (18–30%) compared with the standard drugs (17 to 27% cell viability). Further, the percentage cell viability rate was 54 to 76% in primary epithelial cells HPAEpiC and HRPTEpiC, providing safety data for this study, Figure 2F,G. In addition to this, extracts in different solvents showed a slightly different inhibition pattern against a specific type of cancerous cells lines. Chloroform extracts of P. cornuta showed the highest cytotoxic effect in Caco-2, A549, and MDA-MB-231 cancerous cells, signifying the antibacterial activity results. These findings also indicated that statistically significant (p = 0.001) growth inhibition had been observed against A549 and MDA-MB321 (Figure 2A,D). The percentage of cell viability by P. cornuta extracts is shown in Table 5.
The effect of Q. semicarpifolia extracts on the cell viability of breast and gut cell lines was 30–35% viability after treatment (Figure 3B,D), whereas the lung and liver cell lines had 35–69% cell viability in the order of A549 > HepG2 cells > NCI-H1437 (Figure 3A,C,E respectively, Table 5). In contrast, no significant effect of Q. semicarpifolia extracts was observed on normal cell lines (Figure 3F,G). However, positive control (doxorubicin, cyclophosphamide) inhibited cancer cell line growth with 17–27% cell viability. Furthermore, butanolic and n-hexane extracts in the QS plant exhibited low cell viability, providing remarkable retardation of cancerous cell proliferation. Thus, the results suggest that the Q. semicarpifolia extracts exhibit strong anti-proliferative ability without affecting the normal cells, as shown in Figure 3.

Figure 2. Cell viability: MTS assay histograms represent the percentage viability with respect to control cells (positive control: 30–40% viable cells) after exposure to: 1 ng/mL, 10 ng/mL, 0.1 µg/mL, 1 µg/mL, 10 µg/mL, 100 µg/mL of PCB, PCC, PCM, PCN extracts in A549 cells (A), Caco-2 (B), HepG2 (C), MDA-MB-231 (D), NCI-H1437 (E) cancerous cell lines and HPAEpiC (F) and RPTEC (G) cell lines. Data shown as mean ± SE (n = 3).

Figure 3. Cell viability: MTS assay histograms represent the percentage cell viability with respect to control cells (positive control: 20–30% viable cells) after exposure to: 1 ng/mL, 10 ng/mL, 0.1 µg/mL, 1 µg/mL, 10 µg/mL, 100 µg/mL of QSB, QSC, QSM, QSN extracts in A549 cells (A), Caco-2 (B), HepG2 (C), MDA-MB-231 (D), NCI-H1437 (E) cancerous cell lines and HPAEpiC (F) and RPTEC (G) cell lines. Data shown as mean ± SE (n = 3).
Table 5. Average (n = 3) % age cell viability of plant extracts against human-derived cancerous cell lines and healthy cell lines.
| Extracts (100 µg/mL) |
Cancerous Cell Lines | Normal Cell Lines | |||||
|---|---|---|---|---|---|---|---|
| Caco-2 | A549 | HepG2 | MDA-MB-231 | NCI-H1437 | HPAEpiC | HRPTEpiC | |
| PCB | 42.6 | 26.85 | 50.3 | 19 | 67.71 | 64.85 | 58.85 |
| PCC | 20.5 | 25.42 | 37.3 | 18 | 58.14 | 72.28 | 52.28 |
| PCM | 22.3 | 29.14 | 34.6 | 26.57 | 47.71 | 78.85 | 63.28 |
| PCN | 44.5 | 22 | 30.5 | 19.71 | 39.14 | 80.71 | 53.28 |
| QSB | 29.71 | 38.8 | 35.71 | 29.28 | 46.42 | 71.14 | 56 |
| QSC | 30.42 | 36.6 | 33 | 22.42 | 35.85 | 75.71 | 54.85 |
| QSM | 34.42 | 38.8 | 31.85 | 28.57 | 48.85 | 76.14 | 61.85 |
| QSN | 24 | 30.8 | 23.85 | 20.28 | 68.71 | 64.14 | 54 |
| Doxo. | 20.8 | 20.50 | 10.85 | 19 | 27.42 | 49.57 | 19.57 |
| Cyclopho | 17.14 | 14.42 | 17.85 | 18 | 20.71 | 57.14 | 18.71 |
This entry is adapted from the peer-reviewed paper 10.3390/plants11010048
References
- Kumar, A. Phytochemistry, pharmacological activities and uses of traditional medicinal plant Kaempferia galanga L.–An overview. J. Ethnopharmacol. 2020, 253, 112667.
- Rai, P.K.; Lalramnghinglova, H. Ethnomedicinal plant resources of Mizoram, India: Implication of traditional knowledge in health care system. Ethnobot. Leafl. 2010, 2010, 6.
- Mahomoodally, M.F. Traditional medicines in Africa: An appraisal of ten potent African medicinal plants. Evid.-Based Complement. Altern. Med. 2013, 2013.
- Aarestrup, F.M. Veterinary drug usage and antimicrobial resistance in bacteria of animal origin. Basic Clin. Pharmacol. Toxicol. 2005, 96, 271–281.
- Nabavi, S.F.; Di Lorenzo, A.; Izadi, M.; Sobarzo-Sánchez, E.; Daglia, M.; Nabavi, S.M. Antibacterial effects of cinnamon: From farm to food, cosmetic and pharmaceutical industries. Nutrients 2015, 7, 7729–7748.
- Khanna, S. Immunological and biochemical markers in oral carcinogenesis: The public health perspective. Int. J. Environ. Res. Public Health 2008, 5, 418–422.
- Alfei, S.; Marengo, B.; Zuccari, G. Oxidative stress, antioxidant capabilities, and bioavailability: Ellagic acid or urolithins? Antioxidants 2020, 9, 707.
- Iqbal, J. Impact of silvicultural system on natural regeneration in Western Himalayan moist temperate forests of Pakistan. J. For. Sci. 2021, 67, 101–112.
- Sher, H.; Aldosari, A.; Ali, A.; de Boer, H.J. Indigenous knowledge of folk medicines among tribal minorities in Khyber Pakhtunkhwa, northwestern Pakistan. J. Ethnopharmacol. 2015, 166, 157–167.
- Ahmad, H.; Öztürk, M.; Ahmad, W.; Khan, S.M. Status of Natural Resources in the Uplands of the Swat Valley Pakistan; Climate Change Impacts on High-Altitude Ecosystems; Springer: Berlin/Heidelberg, Germany, 2015; pp. 49–98.
- Jeelani, S.M.; Rather, G.A.; Sharma, A.; Lattoo, S.K. In perspective: Potential medicinal plant resources of Kashmir Himalayas, their domestication and cultivation for commercial exploitation. J. Appl. Res. Med. Aromat. Plants 2018, 8, 10–25.
- Gilani, S.A.; Qureshi, R.A.; Khan, A.M.; Potter, D. Morphological characterization of the pollens of the selected species of genus Prunus Linn. from Northern Pakistan. Afr. J. Biotechnol. 2010, 9, 2872–2879.
- Söhretoglu, D.; Ekizoglu, M.; Kiliç, E.; Sakar, M.K. Antibacterial and antifungal activities of some Quercus species growing in Turkey. FABAD J. Pharm. Sci. 2007, 32, 127.
This entry is offline, you can click here to edit this entry!
