Your browser does not fully support modern features. Please upgrade for a smoother experience.
Please note this is an old version of this entry, which may differ significantly from the current revision.
Subjects:
Others
This work presents a mathematical model of homeostasis dynamics in healthy individuals, focusing on the generation of conductive data on glucose homeostasis throughout the day under dietary and physical activity factors. Two case studies on glucose dynamics for populations under conditions of physical activity and sedentary lifestyle were developed.
- daily activities
- extended Bergman minimal model
- glucose homeostasis
- Monte Carlo approach
1. Introduction
Day by day it is more common to see in society cases of chronic degenerative diseases derived from metabolic diseases such as diabetes mellitus, this is largely a product of poor diet promoted by the large amount of food products with high amounts of glucose and sedentary habits that most people present throughout the day. In Mexico, the National Health and Nutrition Survey reported that 8,542,718 people over 20 years of age had a previous medical diagnosis of type 2 diabetes mellitus (T2DM) [1]. For this reason, it is necessary to have a better understanding of the effects that factors such as diet and physical activity have on glucose homeostasis.
According to Williams et al. [2], in 2019 Mexico ranked sixth in the world in terms of economic investment for the treatment of diabetes (17.0 billion dollars invested), for this reason it is important to seek alternatives that improve the management and prevention of the disease in the country, through projections that provide more information on sectors vulnerable to suffering from this condition. Environmental factors [3], family history [4], age [5], overweight [6], polycystic ovary syndrome [7], hypertension [8], abnormal cholesterol levels [9] and triglyceride levels [10], poor diet [4], as well as sedentary lifestyles [11], are important parameters in the development of metabolic diseases, for this reason, it is necessary to pay more attention to these factors to improve disease prevention strategies, considering changes in lifestyles, diet, regular physical activity and maintaining a healthy body weight as alternatives for the prevention and reduction of these ailments as well as cardiovascular problems [4,11].
From the mathematical point of view, the problem of metabolic diseases has been approached on the basis of in-silico experiments, which in conjunction with mathematical models generate numerical approximations of the behavior of glucose homeostasis when food intake occurs. An example of this are precursor studies such as Dalla Man et al. [12] who propose a mathematical model of glucose homeostasis under conditions where the patient may be healthy or have T2DM; Kovatchev et al. [13] and Man et al. [14] based on mathematical models develop virtual patients (children, adolescents and adults) with type 1 diabetes mellitus (T1DM) for the development of applications in-silico related to glycemic control.
Based on the mathematical models of glucose homeostasis, a new alternative of studies focused on the analysis of virtual populations has emerged, where virtual patients (VP) are developed with particular characteristics for the study to be performed. An example of this is the work proposed by Orozco-López et al. [15], where physically healthy VP are developed with T1DM based on minimum order models, Visentin et al. [16] on the other hand generates VP with T1DM and Visentin et al. [17] creates VP with T2DM according to maximum order models, which are some examples of the current panorama in the research of VP development. This type of research seeks to ensure the feasibility of in-vivo experiments from those previously developed. In several works, in-silico studies based on a population of analyzed VP are proposed, in Garcia-Tirado et al. [18] predictive control techniques of multistage models for artificial pancreas (AP) systems based on 100 VP with T1DM are developed, in Rahmanian et al. [19], a controller is developed to regulate blood glucose levels in patients with T1DM, where they relied on in-silico experimentation. In Nath et al. [20] according to 100 VP with T1DM nonlinear observers based on glucose control are designed. Similar situations are presented in Bhattacharjee et al. [21], Lee et al. [22], Rashid et al. [23] and Toffanin et al. [24] where in-silico experimentation in AP systems plays an important role to obtain an approximation of the results that can be obtained in in-vivo experimentation.
Physical activity is a factor that improves glucose homeostasis as well as body weight control [25]. Several papers present mathematical models describing variations in the dynamics of glucose homeostasis according to physical activity for experimental development in-silico. In Alkhateeb et al. [26], studies on minimum order mathematical models for the development of VP that consider variations of the glycemic profile in patients with T1DM under food intakes as well as physical activity are presented; a simulator for the development of VP with T1DM under conditions of physical activity, insulin administration and food intakes is shown in Kartono et al. [27], Resalat et al. [28], Garcia-Tirado et al. [18] and Moser et al. [29] research concerning the effects of physical activity on glucose homeostasis. Therefore, it is possible to observe that most of the attention of metabolism studies from the mathematical point of view are focused on conditions of diabetes mellitus, especially the case of type 1, being this a reduced sector of the population with metabolic diseases.
2. Effect of Primary and Secondary Factors on the Behavior of Glucose Homeostasis
Glucose concentration is closely related to diet and activity, for this reason food intake has been considered as the main factor in the variations of glucose concentration in the organism, since this factor produces a high degree of change in glucose dynamics. On the other hand, physical activity as well as stress and fatigue have been considered as secondary factors, since in comparison to diet, the impact on the dynamics of glucose concentration turns out to be much smaller. Figure 1 shows the behavior of glucose concentration in a healthy person with regular physical activity according to diet and physical activity factors. From this figure, the correlation between primary and secondary factors in the variation of blood glucose concentration in healthy people is demonstrated. Diet being a factor that increases blood glucose levels quickly and highly, while the impact of physical activity causes a slow and minimal decrease in the behavior of blood glucose.
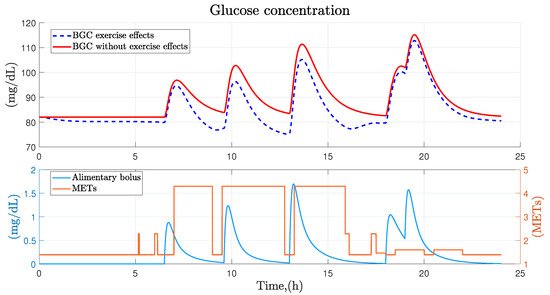
Figure 1. Effect of diet and physical activity on glucose concentration. Graphical visualization of the effect from diet and physical activity on the dynamics of blood glucose concentration.
3. Dynamic Behavior of Glucose Homeostasis
As an example case in Figure 2 and Figure 3, the isolated case shows the dynamics of glucose homeostasis in participant 14, who in this case was an office worker under the work from home scheme. For her, four food intakes were contemplated (breakfast, lunch, snack and dinner), first intake had a carbohydrate amount of 47.6 g (only slow absorbing carbohydrates), composed of a vegetables portion, two slices of bread, lean meat, 1/3 of an avocado and 1 water glass, developing at 10:00 am; subsequently, second intake occurred at 2:00 p.m. with an amount of 41 g (only slow absorbing carbohydrates) consisting of a vegetables portion, 2 corn tortillas, lean meat, 1/3 of avocado and 2 pure water glasses; between 6:00 p.m., 16.3 g from an apple and a small handful of almonds were ingested; finally at 9:00 p.m., last intake was developed with an amount of 39.7 g (16.8 g of slow absorption and 22.9 g of rapid absorption), consisting of 1 slice of bread and a liquid yogurt.
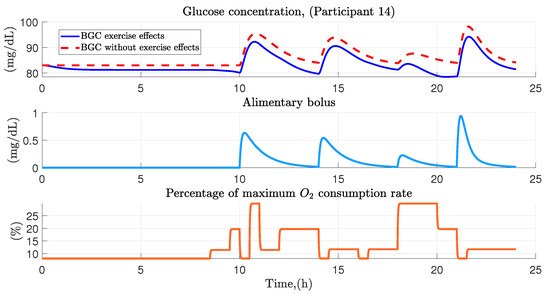
Figure 2. Variation of blood glucose concentration in the participant 14. Graphical representation of the effect of physical activity and diet in participant 14, placing in a dashed line the glucose dynamics without considering physical activity.
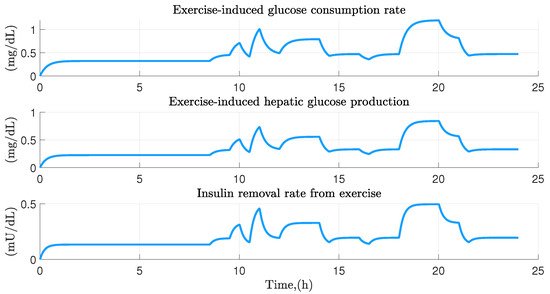
Figure 3. Exercise effect on the glucose homeostasis of the participant 14. Graphical representation of the reduction in glucose and insulin levels derived from the physical activity performed.
Regarding physical activity, the following was contemplated: work on the computer from 8:30 to 9:30 a.m., then from 9:30 to 10:00 a.m., domestic activities were performed. After the first meal, a walk was taken until 11:30 a.m. At the end of the activity, various activities were carried out which can range from computer work to domestic activities ending until the second lunchtime. Later, at 2:30 p.m., activities such as reading or checking social networks were carried out. From 4:00 to 4:30 p.m a short nap was performed, at the end of the nap the participant worked on the computer until 6:00 p.m., during this time a snack was ingested between taking a walk, which ended until 8:00 p.m. where domestic activities were performed until the last intake performed at 9:00 p.m., finally from 9:30 p.m. until midnight activities ranging from watching TV to the use of the smartphone were performed.
Figure 3, presents the graphical results in the variation of glucose in participant 14 throughout the day. This figure is divided into three sections, the upper section presents the variation of glucose considering the physical activity performed throughout the day (blue color) and in contrast presents the variation of glucose without considering the effects of physical activity (red dashed line); in the middle and lower part of the figure are presented the dynamics of food intake (blue color) and physical activity performed based on oxygen consumption in the system (orange color), the effect of both factors is reflected in the glucose concentration, which rises to values above 90 mg/dL after each intake and can reach values close to hypoglycemia (70 mg/dL, as defined in Bequette et al. [37]) due to the over exposure of physical activity as can be seen in the 20th hour of simulation.
In Figure 4, physical activity effect on the glucose homeostasis is illustrated. The upper part shows the glucose consumption rate over a 24 h period in the face of variations in the intensity of physical exercise. In the middle part the effect produced in hepatic glucose production is shown, finally in the lower part the insulin removal rate due to physical activity is shown. As can be seen, there is a marked relationship between physical activity and the variation of both insulin and glucose in the short term, which depending on the intensity, the required demand will be greater.
4. People with Regular PHYSICAL activity
From the sample of 20 healthy persons, a total of 7 persons were considered physically active (2 of them women) and in relation to the ENSANUT subsample, a total of 39 physically active persons were obtained (24 of them women). The sectioning of this population was based in whether the person spent more than 8 h of the day developing activities above 1.5 METs. Figure 5 presents a comparison between the glucose dynamics in the population of physically active people from the sample of 20 healthy people (item a, left side of the figure) and the ENSANUT 2018 subsample (item b, right side of the figure). In both cases there turns out to be some degree of discrepancy between each of the individuals analyzed since in each of the cases the times of food intake and physical activity vary from person to person, but generally remain at values between 80 and 100 mg/dL except for some cases where there were amounts of carbohydrates consumed above the normal values for the population and therefore glucose levels turned out to be higher than normal. Or in the opposite case where the amount of intake was lower than average leading to glucose concentration values below 80 mg/dL. The behavior of physical activity was very similar in most cases in both samples, with mean values of 20% of oxygen consumed in the sample of 20 healthy people and 50% in the ENSANUT subsample.
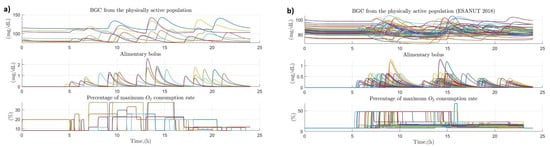
Figure 5. Effect of primary and secondary factors on blood glucose in physically active populations. (a) Effect of diet and physical activity on blood glucose concentration in physically active persons (sample of 20 healthy persons); (b) Effect of diet and physical activity on blood glucose concentration in physically active people (ENSANUT 2018 subsample).
Regarding the data generated with the Monte Carlo approach, the behavior of glucose homeostasis was analyzed in 100 physically active virtual patients (50 of them women) over a 24-h period, simulating by means of 5 physical activities and 3 to 4 random food intakes in a normal day in the daily life of these people. Figure 6, represents the behavior of blood glucose for the case of 50 physically active men before the effect of the factors of diet and physical intensity performed. The behavior of glucose turns out to oscillate between values of 80 and 120 mg/dl throughout the day, the highest values are the product of each of the intakes made by the virtual patient and the decrease in them is the product of the effect of insulin and physical activity developed throughout the day. Food intake tends to be varied according to the time it develops, but with similar values between them. Because they are physically active people, the maximum percentage of oxygen consumed tends to oscillate between 8 and 80% of its totality, generally remaining at values of 30% of its totality throughout the period of activity of the person.
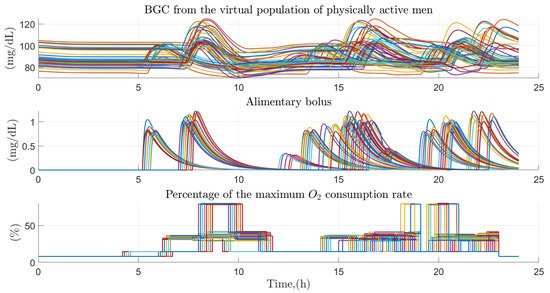
Figure 6. Effect of primary and secondary factors on the virtual population of physically active men. Effect of diet and physical activity on glucose concentration in the virtual population of 50 physically active men.
5. People with Sedentary Habits
The rest of both populations analyzed were classified as having a sedentary tendency because they spend less than 8 h of the day performing activities above 1.5 METs. The number of people in the population of 20 healthy people was 13 participants (6 of them men), while that of the ENSANUT subsample was 30 participants (18 men). Figure 7 shows the comparison between samples in the variations of glucose concentration throughout the day in relation to the effects of carbohydrate intake and the physical activity performed by people with sedentary tendencies. Compared to the physically active population, the behavior for glucose in the population of 20 people is more volatile due to the variability in the amount of carbohydrates consumed, which tend to be higher than in the case of the active population. While in the ENSANUT subsample, it turns out to be more constant due to the fact that two intakes are generally contemplated throughout the day. The physical activity, on the other hand, in both cases turns out to oscillate between values of 10 to 30% of the oxygen consumption, presenting peculiarities in some cases where due to the activity performed the oxygen consumption oscillates between values of 45 to 80%, being generally the only activity higher than 1.5 METs performed by these people throughout the day.
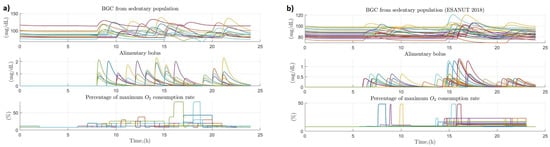
Figure 7. Effect of primary and secondary factors on blood glucose in sedentary populations. (a) Effect of diet and physical activity on glucose concentration in a sample of people with sedentary habits (sample of 20 healthy people); (b) Effect of diet and physical activity on glucose concentration in a sample of people with sedentary habits (ENSANUT 2018 subsample).
Based on the data generated from the Monte Carlo approach, the behavior of glucose homeostasis was analyzed in 100 virtual patients with sedentary tendencies (50 of them men) over a period of 24 h, simulating by means of 5 physical activities of the sedentary type (use of mobile devices, sitting jobs and housework) quantified based on what was proposed in Caballero et al. [32], in addition to 3 to 4 random food intakes on a normal day in the daily lives of these people. Figure 8 shows the case of women with sedentary habits based on the Monte Carlo approach, turning out to be similar to that proposed in the case of physically active virtual patients, but in this case having the peculiarity that the maximum percentage of oxygen consumed turns out to oscillate between 8 and 30% of the total maximum consumption, sedentary activities prevailing at all times throughout the day.
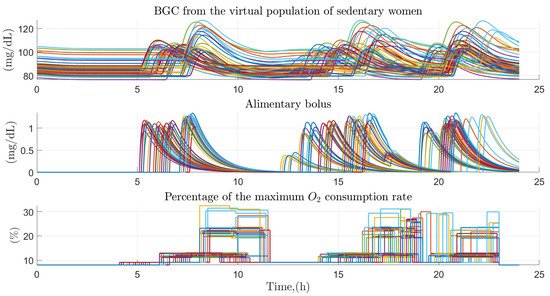
Figure 8. Effect of primary and secondary factors on the virtual population of sedentary women. Effect of diet and physical activity on glucose concentration in a virtual population of 50 women with sedentary habits.
6. Comparison between the Variation of Glucose Homeostasis of the Analyzed Profiles
The development of physical activity to regulate blood glucose levels is an important factor to take into account, because in the case of people who perform physical activities on a regular basis it is possible to avoid peaks in glucose levels derived from dietary intakes in addition to leading promptly to stable glucose levels, greatly improving the performance of glucose homeostasis.
Figure 9, presents a graphic example of the previously mentioned, illustrating the effect of dietary intake and physical activity in a person with sedentary tendencies (blue line) and a physically active one (red line). The figure presents two types of contrast: the first one presents the variation of glucose when physical activity is considered in the mathematical equations (continuous lines) and when it is omitted (dashed lines) in both analyzed profiles; on the other hand, the second contrast presents the difference between the dynamics of glucose in a person with sedentary tendencies and one who is physically active on a regular basis. In the case of the person who has sedentary tendencies, the effect of physical activity on the decrease in glucose is discrete, giving a similar behavior between the glucose dynamics when physical activity is considered and when it is not considered. The opposite is happening in the physically active person, where the decrease in glucose levels derived from physical activity is considerable, thus avoiding a precipitous increase in glucose derived from a dietary intake.
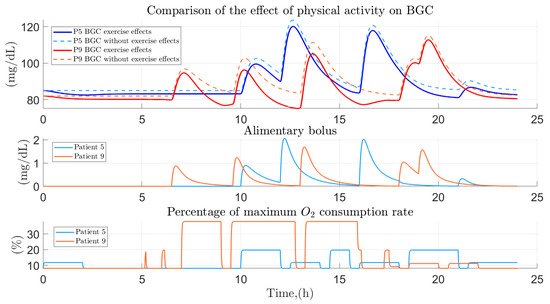
Figure 9. Comparison between the glucose dynamics of a physically active person and one with sedentary tendencies. Contrast between the effect of exercise on glucose lowering between a physically active person and a person tending to be sedentary.
This entry is adapted from the peer-reviewed paper 10.3390/ijerph19020716
This entry is offline, you can click here to edit this entry!