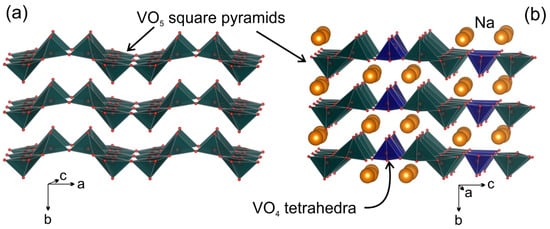
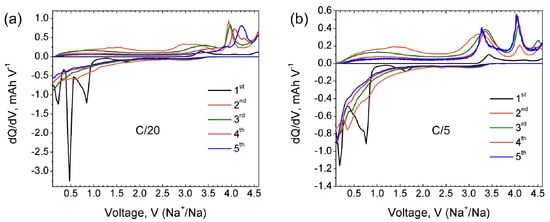
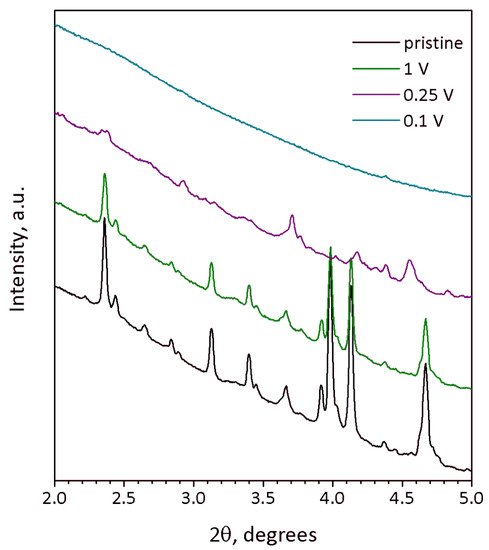
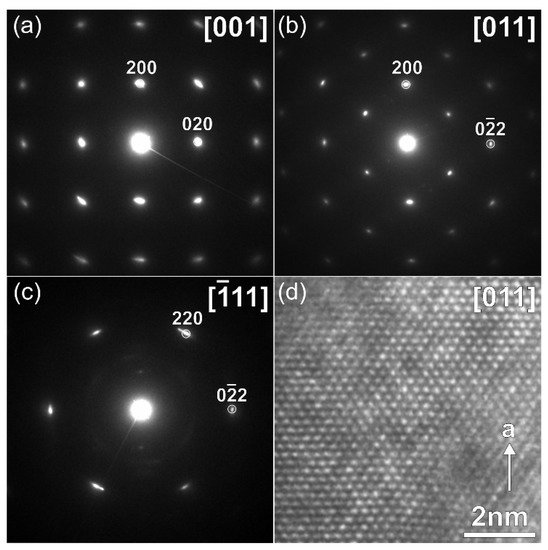
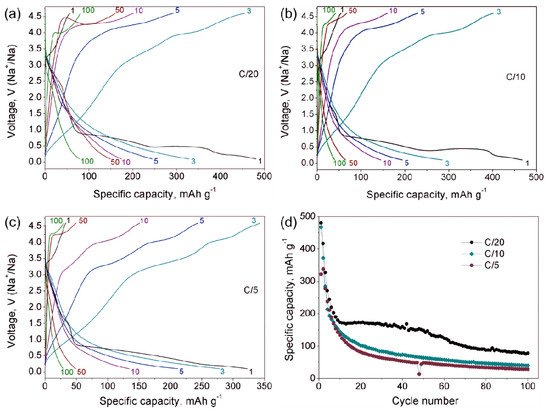
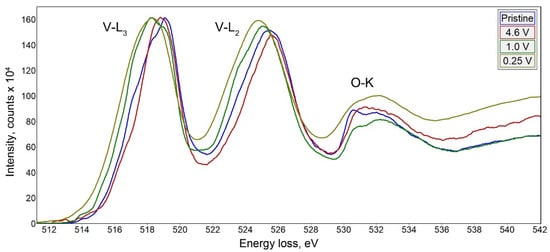
Na9V14O35 (η-NaxV2O5) has been synthesized by a solid-state route in an evacuated sealed silica tube and tested as electroactive material for Na half-cells. Being charged to 4.6 V vs. Na+/Na, almost 3 Na can be extracted per Na9V14O35 formula unit, resulting in a charge capacity of about 60 mAh g−1. Upon discharge below 1 V, Na9V14O35 uptakes Na up to the Na:V = 1:1 atomic ratio that is accompanied by a drastic increase of the separation between the layers of the VO4 tetrahedra and VO5 tetragonal pyramids, and a volume increase of about 31%. The induced structure instability triggers a transformation of the ordered layered Na9V14O35 structure into a rock-salt type disordered structure. Ultimately, the amorphous products of a conversion reaction are formed at 0.1 V, delivering the discharge capacity up to 490 mAh g−1, which, however, quickly fades with the number of charge-discharge cycles.
- Na-ion batteries
- sodium-vanadium bronzes
- electrochemical cycling
1. Introduction
2. Current Insights
This entry is adapted from the peer-reviewed paper 10.3390/molecules27010086
References
- Masquelier, C.; Croguennec, L. Polyanionic (phosphates, silicates, sulfates) frameworks as electrode materials for rechargeable Li (or Na) batteries. Chem. Rev. 2013, 113, 6552–6591.
- Yabuuchi, N.; Kubota, K.; Dahbi, M.; Komaba, S. Research development on sodium-ion batteries. Chem. Rev. 2014, 114, 11636–11682.
- West, K.; Zachau-Christiansen, B.; Jacobsen, T.; Skaarup, S. Sodium insertion in vanadium oxides. Solid State Ion. 1988, 28−30, 1128–1131.
- Pouchard, M.; Casalot, A.; Galy, J.; Hagenmuller, P. Vanadium bronzes with NaxV2O5 formula. Bull. Soc. Chim. Fr. 1967, 11, 4343–4348.
- Kanke, Y.; Takayama-Muromachi, E.; Kato, K.; Matsui, Y. Phase equilibrium study of the system NaV2O5–V2O3–V2O5 at 923 K. J. Solid State Chem. 1990, 89, 130–137.
- Savariault, J.M.; Parize, J.L.; Tkatchenko, D.B.; Galy, V. τ-NaxV2O5(x = 0.64): A vanadium bronze with an original intergrowth structure. J. Solid State Chem. 1996, 122, 1–6.
- Renard, M.S.; Emery, N.; Roginskii, E.M.; Baddour-Hadjeana, R.; Pereira-Ramos, J.-P. Crystal structure determination of a new sodium vanadium bronze electrochemically formed. J. Solid State Chem. 2017, 254, 62–68.
- Wadsley, A.D. The crystal structure of Na2−xV6O15. Acta Cryst. 1955, 8, 695–701.
- Emery, N.; Baddour-Hadjean, R.; Batyrbekuly, D.; Laϊk, B.; Bakenov, Z.; Pereira-Ramos, J.-P. γ-Na0.96V2O5: A new competitive cathode material for sodium ion battery synthesized by a soft chemistry route. Chem. Mater. 2018, 30, 5305–5314.
- Carpy, A.; Galy, J. Affinement de la structure cristalline du bronze NaV2O5α’. Acta Crystallogr. 1975, B31, 1481–1482.
- Nagaraju, G.; Chandrappa, G.T. Solution phase synthesis of Na0.28V2O5 nanobelts into nanorings and the electrochemical performance in Li battery. Mater. Res. Bull. 2012, 47, 3216–3223.
- Znaidi, L.; Baffier, N.; Huber, M. Synthesis of vanadium bronzes NaxV2O5 through sol–gel processes I-monoclinic bronzes (M = Na, Ag). Mater. Res. Bull. 1989, 24, 1501–1514.
- Seo, I.; Hwang, G.C.; Kim, J.-K.; Kim, Y. Electrochemical characterization of micro-rod β-Na0.33V2O5 for high performance lithium ion batteries. Electrochim. Acta 2016, 193, 160–165.
- Wang, P.-P.; Xu, C.-Y.; Ma, F.-X.; Yang, L.; Zhen, L. In situ soft-chemistry synthesis of β-Na0.33V2O5 nanorods as high-performance cathode for lithium-ion batteries. RSC Adv. 2016, 6, 105833–105839.
- Liang, S.Q.; Zhou, J.; Fang, G.Z.; Zhang, C.; Wu, J.; Tang, Y.; Pan, A.Q. Synthesis of mesoporous β-Na0.33V2O5 with enhanced electrochemical performance for lithium ion batteries. Electrochim. Acta 2014, 130, 119–126.
- Lu, Y.K.; Wu, J.; Liu, J.; Lei, M.; Tang, S.S.; Lu, P.J.; Yang, L.Y.; Yang, H.R.; Yang, Q. Facile synthesis of Na0.33V2O5 nanosheet-graphene hybrids as ultrahigh performance cathode materials for lithium ion batteries. ACS Appl. Mater. Interfaces 2015, 7, 17433–17440.
- Delmas, C.; Cognac-Auradou, H.; Cocciantelli, J.M.; Ménétrier, M.; Doumerc, J.P. The LixV2O5 system: An overview of the structure modifications induced by the lithium intercalation. Solid State Ion. 1994, 69, 257–264.
- Liu, H.; Zhu, Z.; Yan, Q.; Yu, S.; He, X.; Chen, Y.; Zhang, R.; Ma, L.; Liu, T. A disordered rock salt anode for fast-charging lithium-ion batteries. Nature 2020, 585, 63–67.
- Muller-Bouvet, D.; Baddour-Hadjean, R.; Tanabe, M.; Huynh, L.T.N.; Le, M.L.P.; Pereira-Ramos, J.-P. Electrochemically formed α’-NaV2O5: A new sodium intercalation compound. Electrochim. Acta 2015, 176, 586–593.
- Tepavcevic, S.; Xiong, H.; Stamenkovic, V.R.; Zuo, X.; Balasubramanian, M.; Prakapenka, V.B.; Johnson, C.S.; Rajh, T. Nanostructured Bilayered Vanadium Oxide Electrodes for Rechargeable Sodium-Ion Batteries. ACS Nano 2012, 6, 530–538.
- Hu, F.; Jiang, W.; Dong, Y.; Lai, X.; Xiao, L.; Wu, X. Synthesis and electrochemical performance of NaV6O15 microflowers for lithium and sodium ion batteries. RSC Adv. 2017, 7, 29481–29488.
- Millet, P.; Henry, J.-Y.; Galy, J. The vanadium oxide bronze η-NaxV2O5 (x = 1.286). Acta Cryst. 1999, C55, 276–279.
- Isobe, M.; Ueda, Y.; Oka, Y.; Yao, T. Crystal structure and magnetic properties of Na9V14O35: Sodium-vanadium bronze η-NaxV2O5. J. Solid State Chem. 1999, 145, 361–365.
- Shannon, R.D. Revised effective ionic radii and systematic studies of interatomic distances in halides and chalcogenides. Acta Cryst. 1976, A32, 751–767.
- Tan, H.; Verbeeck, J.; Abakumov, A.; Van Tendeloo, G. Oxidation state and chemical shift investigation in transition metal oxides by EELS. Ultramicroscopy 2012, 116, 24–33.
