Metabolic Obesity in People with Normal Body Weight: History
Please note this is an old version of this entry, which may differ significantly from the current revision.
Contributor:

Metabolic Obesity in People with Normal Body Weight (MONW) has been observed for the first time in 1981 Neil Ruderman, describing a case of patients with symptoms indicative of the metabolic syndromes — reduced insulin sensitivity, hypertension, T2DM, and hypertriglyceridemia — despite normal body mass index (BMI). The primary diagnostic criteria were complex and required the use of tests not routinely used in healthy subjects. In later years, the diagnosis was based on the criteria of classic metabolic syndrome (MetS). Currently, new criteria are being searched for that will allow for a quick and accurate diagnosis of the MONW. 

  • MONW
  • obesity
  • diagnostic criteria

1. Introduction

Modern human lifestyle is not conducive to maintaining health. Sedentary work, low physical activity, improper diet, irregular meals and snacking between them, as well as overeating in the evening, promote obesity [1]. According to the definition provided by the World Health Organization (WHO), overweight and obesity are defined as abnormal or excessive fat accumulation that presents a risk to health [2]. Statistics on the percentage of people with excessive adipose tissue are not optimistic. The Global Burden of Disease Group who analyzed data from 68.5 million persons from 195 countries reported in 2017 that between 1980 and 2015, the prevalence of childhood and adult obesity has doubled in 73 countries and shows a steady increase in most other countries [3]. Moreover, the results of Ward et al., suggest that by 2030 every second adult person will have obesity and every fourth adult person will have severe obesity [4].
Obesity is usually caused by supplying the body with too many nutrients in relation to the amount needed. This excess is stored in the body as triglycerides, commonly known as fat, and the adipocytes where triglycerides are stored, are known as fat cells. Increased fat mass can manifest itself by increasing the size of the adipocyte cells (hypertrophy) and proliferation (hyperplasia). When adipocytes cannot uptake excess triglycerides it leads to adipogenesis, creating extra space for large amounts of fat to be stored [5].
Excessive body fat is conducive to the development of many diseases, including: metabolic syndrome (MetS), type 2 diabetes mellitus (T2DM), hypertension, ischemic heart disease, atherosclerosis, hyperlipidemia, non-alcoholic fatty liver, as well as complications related to the osteoarticular, musculoskeletal and respiratory systems. Moreover, obesity is one of the risk factors for breast, uterine, esophageal and kidney cancer [1][6][7].
Obesity is a heterogeneous disorder. People with obesity are characterized by inter-individual variability in terms of the distribution of adipose tissue, metabolic profile and the degree of cardiovascular and metabolic risk. Abdominal fat storage is much more conducive to the development of T2DM and coronary diseases than peripheral or gluteal–femoral obesity. Significant anatomical, cellular, molecular, physiological, clinical and prognostic differences are also observed between subcutaneous adipose tissue (SAT) and visceral adipose tissue (VAT) [8]. Although both types of adipose tissue have been shown to be responsible for the development of insulin resistance [9], the excess of visceral depot may turn out to be detrimental to human health. Visceral adipose tissue is much more metabolically and hormonally active compared to its subcutaneous counterpart, it also exhibits pro-inflammatory properties and is prone to lipolysis. In addition to the aforementioned insulin resistance, visceral adipose tissue plays a significant role in the development of T2DM, glucose intolerance, hypertension and cardiovascular disease [10][11]. Long-term observations showed a significant positive association between increased levels of VAT and an increased risk of cardiovascular disease. No such relationship was observed in the case of SAT [12].
Visceral fat became the subject of interest in the 1980s when Ruderman et al. [13] described a case of patients with symptoms indicative of the metabolic syndromes—reduced insulin sensitivity, hypertension, T2DM, and hypertriglyceridemia—despite normal body mass index (BMI). Obesity of this type is defined as metabolically obese normal weight (MONW). Scientists did not develop a single set of diagnostic criteria for metabolic obesity in people with normal body weight.

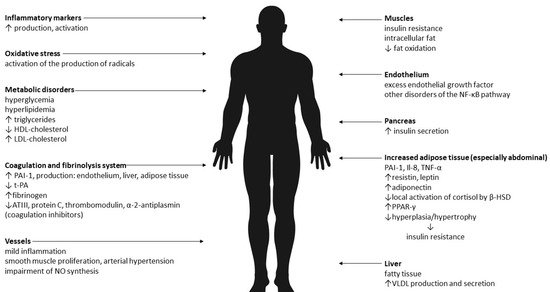
2. Biological Mechanisms of MONW

Based on the research carried out so far in the MONW group (women and men, in different age groups and different ethnic groups), it can be concluded that the excessive accumulation of fat, mainly visceral, adversely affects the lipid profile [13][14][15], blood pressure [13][14], intensifies inflammatory and thrombotic processes [16], as well as oxidative stress [17]. On the other hand, in other studies in non-obese patients with an excessive accumulation of fat, no atherogenic lipid profile, differences in blood pressure values [18][19] or in the concentration of adipocytokines [14][15] were observed.
The central parts of the complex and still insufficiently recognized pathogenesis of MONW are the increased amount of visceral and subcutaneous fat in the abdominal area, insulin resistance and hyperinsulinemia, which are recognized as key disorders in MONW [14][19]. The increase in the mass of visceral adipose tissue causes increased lipolytic activity and the excess release of free fatty acids, which are accumulated in the liver and skeletal muscles. In the liver, increased very-low-density lipoprotein (VLDL) biosynthesis and reduced degradation, thereof, translate into an increase in the concentration of triglycerides in the blood plasma, and as a result of the action of lipoprotein lipase (LPL), cholesterol ester transfer protein (CEPT) and hepatic lipase (HL), LDL particles of high atherogenic potential are formed from VLDL particles. In addition, CETP-mediated multiplied lipid transport generates HDL particles of larger sizes. Hepatic insulin resistance is also manifested by increased glycogenolysis and gluconeogenesis, which increases endogenous glucose production and is associated with the development of non-alcoholic fatty liver disease (NAFLD) [20]. On the other hand, in skeletal muscles, the accumulation of biologically active lipids (long-chain acyl-CoA, diacylglycerols, ceramides) negatively affects the operation of the insulin pathway, inducing muscle insulin resistance, which is associated with impaired translocation of GLUT4 to the cell membrane and reduced transport of glucose to the interior myocytes, thus preventing glucose uptake [21]. This partially explains the complex relationships between obesity, insulin resistance, hyperglycemia and dyslipidemia.
Hypertrophic adipocytes are also a source of pro-inflammatory cytokines that enhance insulin resistance both in the fat cells themselves and in other tissues. Activated by inflammatory mediators (TNF-α, interleukin 1), nuclear factor kappa B (NF-kB) and c-Jun N-terminal kinase (JNK) pathways are the link between chronic inflammation and insulin resistance [22]. Obesity is accompanied by a subclinical chronic inflammation in which, in addition to activating pro-inflammatory signal transduction pathways, there is also an overexpression of pro-inflammatory cytokines in adipose tissue. Among the adipokines, whose activity may contribute to the development of metabolic disorders observed in MONW, the most frequently mentioned are resistin, leptin, adiponectin, TNF-α and IL-6 [17][23]. The pro-inflammatory and prothrombotic states are important components of the metabolic disorders associated with the excessive accumulation of adipose tissue, especially of the visceral type. The pro-inflammatory state is characterized by an increased concentration of cytokines such as TNF-α and IL-6, as well as an increased concentration of acute phase proteins—fibrinogen and CRP protein. The prothrombotic state is diagnosed on the basis of elevated levels of fibrinogen, PAI-1 and other coagulation factors. Increased biosynthesis of the above-mentioned cytokines by lipid-laden adipocytes causes not only tissue resistance to insulin but also pro-inflammatory state, endothelial dysfunction and disorders of coagulation and fibrinolysis.
There is evidence from experimental and clinical studies for a causal relationship between the amount of body fat and insulin resistance and the development and maintenance of elevated blood pressure. The increase in the prevalence of arterial hypertension especially concerns visceral obesity [24]. The etiological factors of arterial hypertension include: hemodynamic disorders accompanying obesity and an increase in peripheral vascular resistance associated with endothelial dysfunction, insulin resistance and the influence of adipokines released from adipose tissue [25].
The excess of energy substrates flowing into the cell in the form of free fatty acids and glucose causes the formation of an increased amount of acetyl-CoA and, thus, NADP in the mitochondria and, as a result, an increase in the biosynthesis of reactive oxygen species (ROS) and the development of oxidative stress [26].
Therefore, it seems that the results of research on the pathogenesis of MONW to date are not unequivocal. The dominant causes are insulin resistance and abdominal obesity. It is believed that the cause of the changes is the increased mass of adipose tissue and its pro-inflammatory activity. Adipose tissue is an active endocrine and paracrine endocrine organ, and the secreted pro-inflammatory substances (adipokines) are an important link between excess body weight, insulin resistance, atherosclerosis and type 2 diabetes. In addition, there is oxidative stress. The effects of abdominal obesity and insulin resistance are summarized in Figure 1.
Figure 1. The effects of abdominal obesity and insulin resistance [13][14][15][16][17][18][19][20][21][22][23][24][25][26]. Legend: VLDL—very-low-density lipoprotein, NO—nitric oxide, PAI-1—plasminogen activator inhibitor-1, t-PA—tissue plasminogen activator, ATIII—antithrombin III, NF-κB—Il-8—interleukin-8, TNF-α—tumor necrosis factor α, β-HSD—beta- hydroxysteroid dehydrogenase, PPAR-γ—peroxisome proliferator-activated receptor gamma, HDL—high-density lipoprotein, LDL—low-density lipoprotein.
It is known that the occurrence of MONW is influenced by both environmental factors—lack of physical activity, unhealthy diet, smoking, alcohol consumption—and genetic factors. While comparing eating habits, controlled studies found that women with MONW consumed more saturated fat and less fiber than metabolically healthy women [27]. The effect of smoking was confirmed by Tilaki and Heidari [28]. Smoking was statistically significantly (p = 0.005) associated with the MONW phenotype in 170 men and women of Iranian origin. Research in the Korean population has shown that there is an association between the prevalence of MONW and moderate alcohol consumption, and a small amount of time for moderate-intensity physical activity [29]. Smoking and alcohol consumption as risk factors were confirmed in a meta-analysis by Wang et al. [30]. It is certain that genetic factors also have an influence on the occurrence of MONW. However, data on specific genes are quite limited. Li et al. [31] showed that CDKAL1 rs2206734 is associated with protection against the MONW phenotype. CDKAL1, which belongs to the methylthiotransferase family, increases translation efficiency and is widely expressed in metabolic tissues, including adipose tissue and pancreatic β cells. In turn, Park et al. [32] found links between the genes GCKR, ABCB11, CDKAL1, CDKN2B, NT5C2 and APOC1, and metabolic disorders in people with normal body weight.

3. Primary criteria for MONW

The author of the first MONW diagnostic criteria is Ruderman et al. [33], who in 1989 proposed a scoring system that assessed 22 features (Table 1) that were assigned a specific number of points. Obtaining at least 7 points was equivalent to the diagnosis of MONW.
Table 1. A point scale to identify people with MONW [33].
Points Symptoms
1 triglycerides level > 100–150 mg/dL
blood presure 125–140/85–90 mmHg
weight gain: >4 after 18 years for women and 21 years for men
BMI: 23–25 kg/m2
waist: 71.1–76.2 for women and 86.3–91.4 for men
ethnicity: black women, Japanese-Americans, Latinos,
Melanesians, Polynesians, New Zealand Maoris
2 impaired fasting glucose (110–125 mg/dL)
triglycerides level > 150 mg/dL
blood presure > 140/90 mmHg
essential hypertension (under age 60 years)
premature coronary heart disease (under age 60 years)
low birth weight (<2.5 kg)
inactivity (<90 min aerobic exercise/week)
weight gain: >8 after 18 years for women and 21 years for men
BMI: 25–27 kg/m2
waist: >76.2 for women and >91.4 for men
uric acid (>8 mg/dL)
ethnicity: Indians, Australian aborigines, Micronesians, Naruans
3 gestational diabetes
triglycerides level > 150 mg/dL and HDL cholesterol < 35 mg/dL
type 2 diabetes mellitus or impaired glucose tolerance
hypertriglyceridemia
weight gain: >12 after 18 years for women and 21 years for men
premature coronary heart disease (under age 60 years)
ethnicity: some American Indian tribes
4 type 2 diabetes mellitus
impaired glucose tolerance
polycystic ovaries
This system had its drawbacks, requiring the performance of biochemical tests not routinely performed in healthy people (including uric acid concentration). For this reason, the search for much simpler and more accessible diagnostic criteria was started.

This entry is adapted from the peer-reviewed paper 10.3390/ijerph19020624

References

  1. Kawalec, A.; Kawalec, A. Analysis of the body composition of young adults and the frequency of occurrence of so-called normal weight obesity: A pilot study. Nurs. Public Health 2019, 9, 167–171.
  2. WHO. Obesity: Preventing and Managing the Global Epidemic; WHO: Geneva, Switzerland, 2015.
  3. Jones, A.; Tovee, M.; Cutler, L.; Parkinson, K.; Ells, L.; Araujo-Soares, V.; Pearce, M.; Mann, K.; Scott, D.; Harris, J.; et al. Health Effects of Overweight and Obesity in 195 Countries over 25 Years. Yearb. Paediatr. Endocrinol. 2018, 15.
  4. Ward, Z.J.; Bleich, S.N.; Cradock, A.L.; Barrett, J.L.; Giles, C.M.; Flax, C.; Long, M.W.; Gortmaker, S.L. Projected U.S. State-Level Prevalence of Adult Obesity and Severe Obesity. N. Engl. J. Med. 2019, 381, 2440–2450.
  5. Ahmed, B.; Sultana, R.; Greene, M.W. Adipose tissue and insulin resistance in obese. Biomed. Pharmacother. 2021, 137, 111315.
  6. Dżygadło, B.; Łepecka-Klusek, C.; Pilewski, B. Use of bioelectrical impedance analysis in prevention and treatment of overweight and obesity. Probl. Hig. Epidemiol. 2012, 93, 274–280.
  7. Bosello, O.; Donataccio, M.P.; Cuzzolaro, M. Obesity or obesities? Controversies on the association between body mass index and premature mortality. Eat. Weight Disord. 2016, 21, 165–174.
  8. Ibrahim, M.M. Subcutaneous and visceral adipose tissue: Structural and functional differences. Obes. Rev. 2010, 11, 11–18.
  9. Cnop, M.; Landchild, M.J.; Vidal, J.; Havel, P.J.; Knowles, N.G.; Carr, D.R.; Wang, F.; Hull, R.L.; Boyko, E.J.; Retzlaff, B.M.; et al. The concurrent accumulation of intra-abdominal and subcutaneous fat explains the association between insulin resistance and plasma leptin concentrations: Distinct metabolic effects of two fat compartments. Diabetes 2002, 51, 1005–1015.
  10. Kokot, I.M.; Pawlik-Sobecka, L.; Płaczkowska, S.; Żółcińska-Wilczyńska, M.; Piwowar, A. The relationship between total body fat and distribution of body fat mass and markers of insulin resistance in young women with normal weight—A pilot study. Clin. Diabetol. 2016, 5, 41–48.
  11. Wedell-Neergaard, A.-S.; Lang Lehrskov, L.; Christensen, R.H.; Legaard, G.E.; Dorph, E.; Larsen, M.K.; Launbo, N.; Fagerlind, S.R.; Seide, S.K.; Nymand, S.; et al. Exercise-Induced Changes in Visceral Adipose Tissue Mass Are Regulated by IL-6 Signaling: A Randomized Controlled Trial. Cell Metab. 2019, 29, 844–855.
  12. Mongraw-Chaffin, M.; Allison, M.A.; Burke, G.L.; Criqui, M.H.; Matsushita, K.; Ouyang, P.; Shah, R.V.; Shay, C.M.; Anderson, C.A.M. CT-derived body fat distribution and incident cardiovascular disease: The multi-ethnic study of atherosclerosis. J. Clin. Endocrinol. Metab. 2017, 102, 4173–4183.
  13. Ruderman, N.B.; Schneider, S.H.; Berchtold, P. The “metabolically-obese,” normal-weight individual. Am. J. Clin. Nutr. 1981, 34, 1617–1621.
  14. Katsuki, A.; Sumida, Y.; Urakawa, H.; Gabazza, E.C.; Murashima, S.; Maruyama, N.; Morioka, K.; Nakatani, K.; Yano, Y.; Adachi, Y. Increased Visceral Fat and Serum Levels of Triglyceride Are Associated With Insulin Resistance in Japanese Metabolically Obese, Normal Weight Subjects With Normal Glucose Tolerance. Diabetes Care 2003, 26, 2341–2344.
  15. Miazgowski, T.; Safranow, K.; Krzyżanowska-Świniarska, B.; Iskierska, K.; Widecka, K. Adiponectin, visfatin and regional fat depots in normal weight obese premenopausal women. Eur. J. Clin. Investig. 2013, 43, 783–790.
  16. De Lorenzo, A.; Del Gobbo, V.; Premrov, M.G.; Bigioni, M.; Galvano, F.; Di Renzo, L. Normal-weight obese syndrome: Early inflammation? Am. J. Clin. Nutr. 2007, 85, 40–45.
  17. Katsuki, A.; Sumida, Y.; Urakawa, H.; Gabazza, E.C.; Murashima, S.; Nakatani, K.; Yano, Y.; Adachi, Y. Increased Oxidative Stress Is Associated With Serum Levels of Triglyceride, Insulin Resistance, and Hyperinsulinemia in Japanese Metabolically Obese, Normal-Weight Men. Diabetes Care 2004, 27, 631–632.
  18. Dvorak, R.V.; DeNino, W.F.; Ades, P.A.; Poehlman, E.T. Phenotypic characteristics associated with insulin resistance in metabolically obese but normal-weight young women. Diabetes 1999, 48, 2210–2214.
  19. Conus, F.; Allison, D.B.; Rabasa-Lhoret, R.; St-Onge, M.; St-Pierre, D.H.; Tremblay-Lebeau, A.; Poehlman, E.T. Metabolic and behavioral characteristics of metabolically obese but normal-weight women. J. Clin. Endocrinol. Metab. 2004, 89, 5013–5020.
  20. Stefan, N.; Schick, F.; Häring, H.U. Causes, Characteristics, and Consequences of Metabolically Unhealthy Normal Weight in Humans. Cell Metab. 2017, 26, 292–300.
  21. Zaid, H.; Antonescu, C.N.; Randhawa, V.K.; Klip, A. Insulin action on glucose transporters through molecular switches, tracks and tethers. Biochem. J. 2008, 413, 201–215.
  22. Davis, R.J. Signal transduction by the JNK group of MAP kinases. Cell 2000, 103, 239–252.
  23. Kershaw, E.E.; Flier, J.S. Adipose tissue as an endocrine organ. J. Clin. Endocrinol. Metab. 2004, 89, 2548–2556.
  24. Poirier, P.; Lemieux, I.; Mauriège, P.; Dewailly, E.; Blanchet, C.; Bergeron, J.; Després, J.P. Impact of waist circumference on the relationship between blood pressure and insulin: The Quebec health survey. Hypertension 2005, 45, 363–367.
  25. Poirier, P.; Giles, T.D.; Bray, G.A.; Hong, Y.; Stern, J.S.; Pi-Sunyer, F.X.; Eckel, R.H. Obesity and cardiovascular disease: Pathophysiology, evaluation, and effect of weight loss: An update of the 1997 American Heart Association Scientific Statement on obesity and heart disease from the Obesity Committee of the Council on Nutrition, Physical. Circulation 2006, 113, 898–918.
  26. Ceriello, A.; Motz, E. Is Oxidative Stress the Pathogenic Mechanism Underlying Insulin Resistance, Diabetes, and Cardiovascular Disease? The Common Soil Hypothesis Revisited. Arterioscler. Thromb. Vasc. Biol. 2004, 24, 816–823.
  27. Hyun, Y.J.; Koh, S.J.; Chae, J.S.; Kim, J.Y.; Kim, O.Y.; Lim, H.H.; Jang, Y.; Park, S.; Ordovas, J.M.; Lee, J.H. Atherogenecity of LDL and unfavorable adipokine profile in metabolically obese, normal-weight woman. Obesity 2008, 16, 784–789.
  28. Hajian-Tilaki, K.; Heidari, B. Metabolically healthy obese and unhealthy normal weight in Iranian adult population: Prevalence and the associated factors. Diabetes Metab. Syndr. Clin. Res. Rev. 2017, 12, 129–134.
  29. Lee, K. Metabolically obese but normal weight (MONW) and metabolically healthy but obese (MHO) phenotypes in Koreans: Characteristics and health behaviors. Asia Pac. J. Clin. Nutr 2009, 18, 280–284.
  30. Wang, B.; Zhuang, R.; Luo, X.; Yin, L.; Pang, C.; Feng, T.; You, H.; Zhai, Y.; Ren, Y.; Zhang, L.; et al. Prevalence of Metabolically Healthy Obese and Metabolically Obese but Normal Weight in Adults Worldwide: A Meta-Analysis. Horm. Metab. Res. 2015, 47, 839–845.
  31. Li, G.; Li, Y.; Han, L.; Wang, D.; Zhang, Q.; Xiao, X.; Qi, L.; Willi, S.M.; Li, M.; Mi, J.; et al. Interaction between early environment and genetic predisposition instigates the metabolically obese, normal weight phenotype in children: Findings from the BCAMS study. Eur. J. Endocrinol. 2020, 182, 393–403.
  32. Park, J.M.; Park, D.H.; Song, Y.; Kim, J.O.; Choi, J.E.; Kwon, Y.J.; Kim, S.J.; Lee, J.W.; Hong, K.W. Understanding the genetic architecture of the metabolically unhealthy normal weight and metabolically healthy obese phenotypes in a Korean population. Sci. Rep. 2021, 11, 2279.
  33. Ruderman, N.; Chisholm, D.; Pi-Sunyer, X.; Schneider, S. The metabolically obese, normal-weight individual revisited. Diabetes 1998, 47, 699–713.
More
This entry is offline, you can click here to edit this entry!
Video Production Service