Your browser does not fully support modern features. Please upgrade for a smoother experience.
Please note this is an old version of this entry, which may differ significantly from the current revision.
Subjects:
Medicine, Research & Experimental
Botulinum toxin A (BoNT-A) has found wider therapeutic acceptance in rehabilitation across a range of neurological disorders resulting in spasticity and/or dystonia and in other medical and surgical conditions. The new research shows the toxin is effective against neuropathic pain, a common debilitating condition with poor response to currently available therapy.
- neuropathic pain
- botulinum toxin
- systematic review
- meta-analysis
1. Introduction
Neuropathic pain (NP) resulting from damage or dysfunction of the peripheral or central nervous systems is one of the most common forms of pain, affecting up to 10% of the general population [1][2]. The current evidence of treatment outcomes puts success rates at best between 30% and 50%, and existing treatments come with significant side effects [3]. The effect of NP pervades patient sensation, thoughts, feelings, and behaviours. Treatment outcomes of these patients’ experiences have been described as “woefully inadequate” [1][3]. Clinicians’ express difficulty in dealing with NP [4], thus limiting the outcomes of pain relief, the healing of underlying conditions, and rehabilitation to a satisfactory functional quality of life.
Over the last two decades, botulinum toxin A (BoNT-A) has found wider therapeutic acceptance in rehabilitation across a range of neurological disorders resulting in spasticity and/or dystonia and in other medical and surgical conditions [5][6]. Other scientific research from pharmacology, toxicology, and biology [6][7] has identified the mechanism of BoNT-A in NP (Figure 1) and supported its use as being safe and effective for an increasing number of applications, including a number of conditions with neuropathic pain. Multiple randomised controlled trials (RCTs) [8][9][10][11][12][13][14][15][16][17][18][19][20][21][22][23][24][25][26] and systematic reviews [27][28][29][30][31][32][33] have added evidence, specifically on NP. Despite this substantial body of evidence, BoNT-A has not been considered as adequate for the first-line treatment of NP, and it is reasonable and important for rehabilitation medicine physicians to ask why this is so.
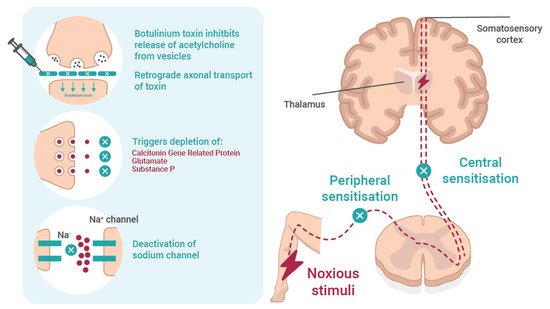
Figure 1. The mechanism and effect of botulinum toxin in neuropathic pain. Botulinum toxin reversibly inhibits the release of acetylcholine from the presynaptic vesicle and causes local chemodenervation resulting in reduced muscle contraction. The possible mechanisms of action on pain involves (i) retrograde axonal transport of toxin; (ii) inhibition of neuropeptides, such as substance P, calcitonin gene-related protein (CGRP), and glutamate; and (iii) deactivation of Na channel. All prevent peripheral and central sensitisation.
To date, published RCTs on NP have shown efficacy and safety but have failed to provide adequate supportive evidence addressing the diagnosis of NP, the effective optimum dose, administration in different NP conditions, the duration of effectiveness, quality of life and functional ability, and other data that would underpin NP management guidelines. The limited design and small sample size of the RCTs led Shackleton et al. [28] to conclude that the promising pain control results shown in medical and surgical use in recent years required further well-designed placebo-controlled trials, not only to support BoNT-A as a backup treatment but also for first-line pain relief. Croford [3] has further argued that new treatments for chronic pain are of the utmost urgency. To design an appropriate guidelines trial, we require more detail on the limitations of the study evidence to date.
2. Final Visual Analogue Scale (VAS) Measures
The Visual Analog Scale (VAS) is discussed in some detail because of its consistent use as an outcome measure in the reviewed studies and, secondly, because of its importance of identifying bias in research and research reporting.
The mean final VAS and the standard deviation of the final VAS for placebo and botulinum toxin groups were pooled across 17 studies using a random effects meta-analysis model. Heterogeneity in the study estimates was assessed using the I-squared statistic (88.1%) and Cochran’s Q p value (<0.0001), which showed considerable heterogeneity leading to the use of random effects models in analyses. The overall mean difference in the final VAS across the studies was 2.59 (95% confidence interval (CI): 1.79, 3.38) (Figure 2), identifying a mean higher VAS outcome pain score in the placebo group overall.
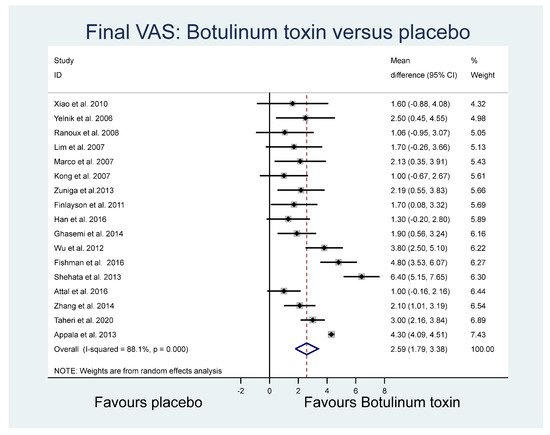
Figure 2. Final VAS.
2.1. VAS Difference
The mean VAS differences (final minus baseline) and the standard deviation of VAS difference for the BoNT-A and placebo groups were pooled across 7 of the 17 studies. Heterogeneity analysis using the I2 statistic (88.2%) showed substantial heterogeneity. Overall, the mean difference in the final VAS units across the studies was 2.34 (95% CI: 1.07, 3.61), identifying a higher mean VAS outcome pain score in the placebo group.
2.2. 50% Reduction in VAS
The proportion of patients with at least a 50% reduction in VAS between baseline and final time periods in the BoNT-A and placebo groups was pooled across six studies using a random effects meta-analysis model. Heterogeneity in the study estimates was assessed using the I2 statistic (44.9%) and showed moderate heterogeneity. The mean relative risk across the studies was 4.90 (95% CI: 2.00, 6.13), identifying a higher mean VAS outcome pain score in the placebo group.
2.3. Pain Frequency (Number of Neuralgia Attacks in a Single Day)
The mean pain frequencies and standard deviations for the BoNT-A and placebo groups were pooled across three studies. Heterogeneity in the study estimates was assessed using the I2 statistic and showed moderate heterogeneity (49.7%). The overall mean difference in pain attacks across the studies was 24.47 (95% CI: 19.09, 29.86), identifying a higher mean frequency of pain in the placebo group.
2.4. Other Relevant Outcomes
Of the other study outcomes (sleep—three studies, anxiety—two studies, depression—two studies, and mental and physical health—two studies) included in the RCTs, there were no statistically significant differences observed between the BONT-A and placebo groups in the meta-analysis (Figure 3, Figure 4 and Figure 5).
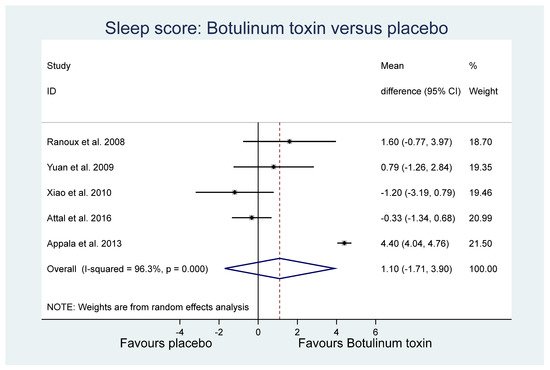
Figure 3. Sleep.
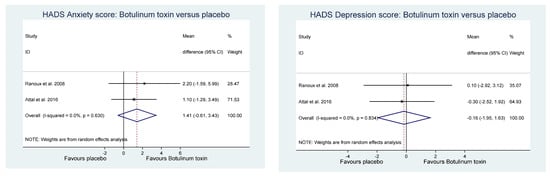
Figure 4. Hospital anxiety and depression score.
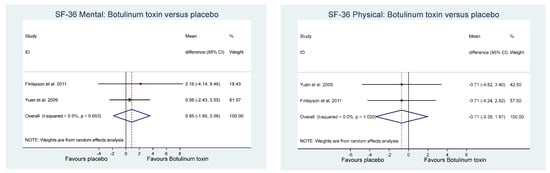
Figure 5. Quality of life.
2.5. Final VAS Funnel Plot
For the comparison of the BoNT-A and placebo final VAS (based on Figure 1), a funnel plot assessed publication bias for the final continuous VAS outcome (Figure 6). The funnel plot shows the standard error of mean difference on the y-axis and the mean difference on the x-axis. As most of the values fall outside the “funnel”, there is a substantial degree of study bias (Egger’s test: R = 2.73, p = 0.002). Oher likely sources of this bias are the small and variable sample sizes of the RCTs and the variability across other elements of RCT composition, including the sample (inpatients, outpatients, or both) [34].
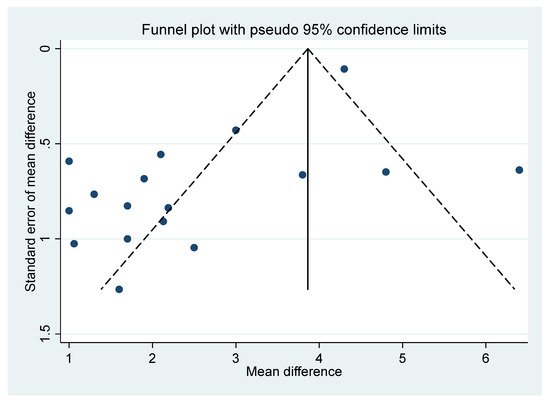
Figure 6. Funnel plot.
This entry is adapted from the peer-reviewed paper 10.3390/toxins14010036
References
- Smith, B.H.; Hébert, H.L.; Veluchamy, A. Neuropathic pain in the community: Prevalence, impact, and risk factors. Pain 2020, 161, S127–S137.
- Wan, A. GP pain management: What are the P’s and A’s of pain management. Aust. Fam. Physician 2014, 43, 537–540.
- Crofford, L.J. Chronic Pain: Where the Body Meets the Brain. Trans. Am. Clin. Climatol. Assoc. 2015, 126, 167–183.
- Upshur, C.C.; Luckmann, R.S.; Savageau, J.A. Primary care provider concerns about management of chronic pain in community clinic populations. J. Gen. Intern. Med. 2006, 21, 652–655.
- Intiso, D. Therapeutic Use of Botulinum Toxin in Neurorehabilitation. J. Toxicol. 2012, 2012, 802893.
- Gooriah, R.; Ahmed, F. Therapeutic uses of botulinum toxin. J. Clin. Toxicol. 2015, 5, 1–7.
- Pirazzini, M.; Rossetto, O.; Eleorpra, R.; Montecucco Witkin, J.M. Botulinum neurotoxins: Biology, pharammcologyand toxicology. Pharmacol. Rev. 2017, 69, 200–235.
- Yuan, R.Y.; Sheu, J.J.; Yu, J.M.; Chen, W.T.; Tseng, I.J.; Chang, H.H.; Hu, C.J. Botulinum toxin for diabetic neuropathic pain: A randomized double-blind crossover trial. Neurology 2009, 72, 1473–1478.
- Yelnik, A.P.; Colle, F.M.; Bonan, I.V.; Vicaut, E. Treatment of shoulder pain in spastic hemiplegia by reducing spasticity of the subscapular muscle: A randomised, double blind, placebo controlled study of botulinum toxin A. J. Neurol. Neurosurg. Psychiatry 2007, 78, 845–848.
- Marco, E.; Duarte, E.; Vila, J.; Tejero, M.; Guillen, A. Is Botulinum Toxin Type A Effective in The Treatment of Spastic Shoulder Pain in Patients After Stroke Unclear Risk. A Double-blind Randomized Clinical Trial. J. Rehabil. Med. 2007, 39, 440–447.
- Kong, K.-H.; Neo, J.-J.; Chua, K.S. A randomized controlled study of botulinum toxin A in the treatment of hemiplegic shoulder pain associated with spasticity. Clin. Rehabil. 2007, 21, 28–35.
- Lim, J.-Y.; Koh, J.-H.; Paik, N.-J. Intramuscular Botulinum Toxin-A Reduces Hemiplegic Shoulder Pain. Stroke 2008, 39, 126–131.
- Ranoux, D.; Attal, N.; Morain, F.; Bouhassira, D. Botulinum toxin type a induces direct analgesic effects in chronic neuropathic pain. Ann. Neurol. 2008, 64, 274–283.
- Xiao, L.; Mackey, S.; Hui, H.; Xong, D.; Zhang, Q.; Zhang, D. Subcutaneous Injection of Botulinum Toxin A Is Beneficial in Postherpetic Neuralgia. Pain Med. 2010, 11, 1827–1833.
- Finlayson, H.C.; O’Connor, R.J.; Brasher, P.M.; Travlos, A. Botulinum toxin injection for management of thoracic thoracic outlet syndrome: A double-blind, randomized trial. Pain 2011, 152, 2023–2028.
- Wu, C.-J.; Lian, Y.-J.; Zheng, Y.-K.; Zhang, H.-F.; Chen, Y.; Xie, N.-C.; Wang, L.-J. Botulinum toxin type A for the treatment of trigeminal neuralgia: Results from a randomized, double-blind, placebo-controlled trial. Cephalalgia 2012, 32, 443–450.
- Shehata, H.S.; El-Tamawy, M.S.; Shalaby, N.M.; Ramzy, G. Botulinum toxin-type A: Could it be an effective treatment option in intractable trigeminal neuralgia? J. Headache Pain 2013, 19, 92–98.
- Apalla, Z.; Sotiriou, E.; Lallas, A.; Lazaridou, E.; Loannides, D. Botulinum Toxin A in Postherpetic Neuralgia A Parallel, Randomized, Double-Blind, Single-Dose, Placebo-controlled Trial. Clin. J. Pain 2013, 29, 857–864.
- Zúñiga, C.; Piedimonte, F.; Díaz, S.; Micheli, F. Acute Treatment of Trigeminal Neuralgia With Onabotulinum Toxin A. Clin. Neuropharmacol. 2013, 36, 146–150.
- Ghasemi, M.; Ansari, M.; Basiri, K.; Shaygannejad, V. The effects of intradermal botulinum toxin type a injections on pain symptoms of patients with diabetic neuropathy. J. Res. Med. Sci. 2014, 19, 106–111.
- Zhang, H.; Lian, Y.; Ma, Y.; Chen, Y.; He, C.; Xie, N.; Wu, C. Two doses of botulinum toxin type A for the treatment of trigeminal neuralgia: Observation of therapeutic effect from a randomized, double-blind, placebo-controlled trial. J. Headache Pain 2014, 15, 65.
- Han, Z.; Song, D.H.; Oh, H.; Chung, M.E. Botulinum toxin type A for neuropathic pain in patients with spinal cord injury. Ann. Neurol. 2016, 79, 569–578.
- Attal, N.; de Andrade, D.C.; Adam, F.; Ranoux, D.; Teixeira, M.J.; Galhardoni, R.; Raicher, I.; Üçeyler, N.; Sommer, C.; Bouhassira, D. Safety and efficacy of repeated injections of botulinum toxin A in peripheral neuropathic pain (BOTNEP): A randomised, double-blind, placebo-controlled trial. Lancet Neurol. 2016, 15, 555–565.
- Fishman, L.M.; Wilkins, A.N.; Rosner, B. Electro physiologically identified piriformis syndrome is successfully treated with incobotulinum toxin and physical therapy. Muscle Nerve 2017, 56, 258–263.
- Salehi, H.; Moussaei, M.; Kamiab, Z.; Vakilian, A. The effects of botulinum toxin type A injection on pain symptoms, quality of life, and sleep quality of patients with diabetic neuropathy: A randomized double-blind clinical trial. Iran. J. Neurol. 2019, 18, 99–107.
- Taheri, M.; Sedaghat, M.; Solhpour, A.; Rostami, P.; Lima, B.S. The Effect of Intradermal Botulinum Toxin a injections on painful diabetic polyneuropathy. Diabetes Metab. Syndr. 2020, 14, 1823–1828.
- Meng, F.; Peng, K.; Yang, J.-P.; Ji, F.-H.; Xia, F.; Meng, X.-W. Botulinum toxin-A for the treatment of neuralgia: A systematic review and meta-analysis. J. Pain Res. 2018, 11, 2343–2351.
- Shackleton, T.; Ram, S.; Black, M.; Ryder, J.; Clark, G.T.; Enciso, R. The efficacy of botulinum toxin for the treatment of trigeminal ad postherpetic neuralgia: A systematic review with meta-analyses. Oral Surgery Oral Med. Oral Path. Oral Rad. 2016, 19, 61–71.
- Morra, M.E.; Elgebaly, A.; Elmaraezy, A.; Khalil, A.M.; Altibi, A.M.A.; Vu, T.L.-H.; Mostafa, M.R.; Huy, N.T.; Hirayama, K. Therapeutic efficacy and safety of botulinum toxin A therapy in trigeminal neuralgia: A systematic review and meta-analysis of randomised controlled trials. J. Headache Pain 2016, 17, 63.
- Nauman, M.; Jankovic, J. Safety of botulinum toxin type A: A systematic review and meta-analysis. Curr. Med. Res. Opin. 2004, 20, 981–990.
- Herd, C.P.; Tomlinson, C.L.; Rick, C.; Scotton, W.J.; Edwards, J.; Ives, N.J.; Clarke, C.; Sinclair, A.J. Cochrane systematic review and meta-analysis of botulinum toxin for the prevention of migraine. BMJ Open 2019, 9, e027953.
- Lakhan, S.E.; Velasco, D.N.; Tepper, D. Botulinum Toxin-A for Painful Diabetic Neuropathy: A Meta-Analysis. Pain Med. 2015, 16, 1773–1780.
- Wei, J.; Zhu, X.; Yang, G.; Shen, J.; Xie, P.; Zuo, X.; Xia, L.; Han, Q.; Zhao, Y. The efficacy and safety of botulinum toxin type A treatment of trigeminal neuralgia and peripheral neuropathic pain: A meta-analysis of randomised controlled trails. Brain Behav. 2019, 9, e01409.
- Lee, S.W.; Kim, K.S.; Chung, J.H.; Park, H.J.; Sohn, Y.S.; Jeon, W.J.; Cho, S.Y.; Shin, W.J. Assessing the quality of randomised controlled trails of complex regional pain syndrome published in the Journal of Clinical Pain Medicine Field. J. Korean Med. Sci. 2012, 27, 973–980.
This entry is offline, you can click here to edit this entry!