Your browser does not fully support modern features. Please upgrade for a smoother experience.
Please note this is an old version of this entry, which may differ significantly from the current revision.
Subjects:
Agriculture, Dairy & Animal Science
Croakers, locally called Jewfish or Poa mash, are among the largest groups of commercially important fishes exploited from Bangladesh’s Bay of Bengal (BoB) water. Croakers are under the Perciformes order and belong to the family Sciaenidae.
- Croakers
- yield
- exploitation
- fisheries reference point
- maximum sustainable yield
1. Introduction
There are 20 species of Corkers under 12 genera that have been reported from the marine water of Bangladesh [1]. Johnius is the most dominant genus of croakers. The most abundant species of croaker are Johnius belangerii (Belanger’s croaker), J. elongates (Spindle croaker), J. dussumieri (Bearded croaker), Otolithes cuvieri (Lesser tiger-tooth croaker), Otolithoides pama (Pama croaker), Pennahia anea (Greyfin croaker), and Protonibea diacanthus (Spotted croaker). These seven species of croakers play a vital role in Bangladesh’s national economy [2][1].
Croakers are bottom-dwelling carnivore fishes distributed in the shallow coastal and marine waters of the BoB. While juvenile croakers are found in coastal water, adults can move toward shallow water of the BoB, where maximum commercial fishing occurs [2][3]. Croakers are harvested by artisanal and industrial fishers in which the fishery is caught by bottom trawl, gillnet, and long lines [1]. This fishery accounts for about 12.8% of the entire demersal fish population in Bangladesh’s exclusive economic zone (EEZ). In comparison, 66.5% of demersal fishes on the continental shelf are within 20 m of water depth. This fishery contributed 6.3% of the total marine catches from the BoB [4]. People consume about 50% of harvested croakers in fresh conditions [5]. Large croakers are used for the value-added product, while the small ones (about 86% of total croaker catches) are sun-dried [6]. Croaker has high demand in local and international markets, particularly in Saudi Arabia, Kuwait, Qatar, the Middle East, and other Arab nations as a fresh and dry condition [5]. Bangladesh exports about 1000 metric tons (mt) of dried and salted croaker to China, Hong Kong, Singapore, South Korea, Japan, and other southeast Asian nations [5][6].
Because of the high demand for croaker and other fisheries, fishing pressure is growing in Bangladesh’s coastal and marine water. Moreover, the unselective operation of set bag net (SBN) and other fishing gear in coastal waters is hampering the stock of both pelagic and demersal fisheries in this region. As a result, the croaker has been overexploited by high fishing pressure for decades. Because of different management and conservation measures, the natural stock of croakers has been progressively improving since 1990 [7]. However, there are minimal studies on the growth pattern, mortality, and length-weight relationships of a few croaker species, but no comprehensive information on the stock condition of croaker in the BoB [5][8][2][1][6][9][10].
This research analyzed a 16-year time series of commercial trawling catch and effort (CE) data of croakers from the BoB. The Monte Carlo method (CMSY) was applied to evaluate the BRPs (biological reference points) and MSY (maximum sustainable yield) of the croaker. The MSY is the widely used target BRPs for fisheries management [11]. Many contemporary techniques exist for estimating MSY and BPRs in data-limited fisheries, but CMSY is one of the powerful methods [12]. The CMSY can better evaluate BRPs than other techniques and is particularly handy for developing nations with limited/absent effort data [12][13].
From Bangladesh’s perspective, commercial fisheries data are limited, poor, and even absent for many species. Thus, Bangladesh’s marine fisheries management primarily focused on establishing a marine protected area, closure of spawning grounds, and mesh size restrictions. Further, Bangladesh has a limited data set of croakers, and there is currently no research into MSY and stock status—this is a significant constraint on realizing the total allowable catch (TAC) and stock status
2. CMSY- and BSM-Derived Fisheries Reference Points (BRPs)
The CMSY and BSM methods delivered important stock information and BRPs (Table 1). The BSM-derived BRPs are considered the management information for the croaker fishery of the BoB. The BSM produced higher k (127,000 mt) than the CMSY (123,000 mt). The r produced by CMSY and BSM were very close, and values were 1.13 and 1.12, respectively. The catch fit diagram (Figure 1a) depicted a gradual increase in observed and predicted catch, while the CPUE fit diagram (Figure 1b) displayed a similar fluctuation in CPUE. The highest catch (38,414 mt) and CPUE (0.198) were observed in 2008 and 2013, respectively, while the lowest catch (25,251 mt) and CPUE were reported in 2001. There was no remarkable variation between the predicted and observed catch and CPUE in the last year (2016), which is a good sign for the sustainability of this fishery. The CMSY and BSM-derived MSY were 35,900 mt per year and 33,900 mt per year. MSY values from both methods were very close to last year’s catch (33,768 mt per year in 2016), indicating a fully exploited condition.
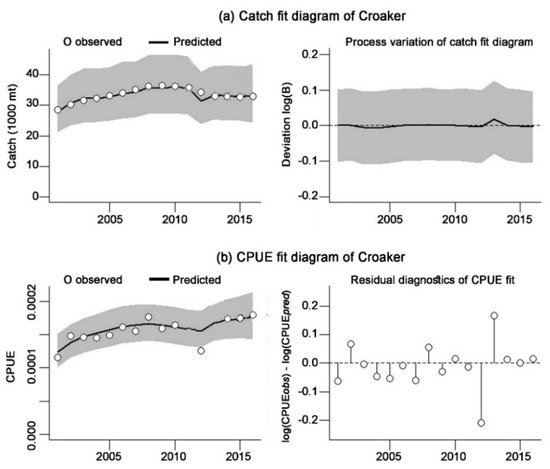
Figure 1. Schematic plots (a) represent the observed and predicted catch fit diagram, and (b) represent the observed and predicted CPUE fit diagram for the croaker fishery in the BoB derived from the CMSY method with 95% confidence limits (gray shaded).
Table 1. Estimated r, k, and MSY of croaker in the BoB, with 95% confident intervals (CI).
| Model Name | k (mt) | r (year−1) | MSY (mt) |
|---|---|---|---|
| CMSY | 127,000 (87,800–171,000) | 1.13 (0.779–1.6) | 35,900 (28,500–42,900) |
| BSM | 123,000 (90,200–178,000) | 1.12 (0.81–1.58) | 33,900 (32,300–39,800) |
The management information of croaker derived from the BSM method is represented in Table 2 and Figure 2. BSM produced the catch diagram and the stock diagram of the croaker illustrated in Figure 2. The catch diagram shows the catches below the MSY line (Figure 2a). The stock diagram (Figure 2b) illustrates that B/BMSY at the beginning of the data year was below the unity (<1) line, depicting overfished biomass. However, gradually, the fish has recovered and resulted in safe biomass (≥1) in the last year (2016). In 2016, the estimated B (72,300 mt) was very close to the BMSY (63,300 mt), suggesting that the biomass is enough to produce the MSY. The exploitation figure (Figure 2c) shows that the exploitation line never crossed the MSY limit. The maximum rate of fishing mortality FMSY was 0.57, F was 0.46, and F/FMSY was 0.81, respectively, suggesting a safe fishing status.
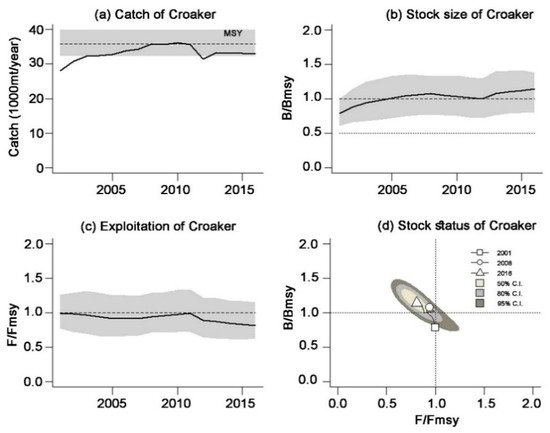
Figure 2. Schematic plots represent the result for croaker fishery in the BoB based on BSM analysis: (a) time series of catch and the estimated MSY with 95% confidence interval (CI) in the gray area; (b) time series drive of relative biomass (B/BMSY); (c) time series drive of exploitation (F/FMSY); (d) relationship between F/FMSY and B/BMSY with CI of 50% (yellow), 80% (gray), and 95% (black).
Table 2. Management information of croaker in the BoB produced by BSM method.
| Population Parameters | Parameter Values | 95% Confident Intervals (CI) |
|---|---|---|
| MSY | 33,900 | 32,300–39,800 |
| FMSY | 0.57 | 0.41–0.79 |
| BMSY | 63,300 | 45,100–88,900 |
| Biomass (B2016) | 72,300 | 50,900–87,500 |
| B/BMSY | 1.14 | 0.80–1.38 |
| Fishing mortality (F2016) | 0.46 | 0.38–0.65 |
| Exploitation (F/FMSY) | 0.81 | 0.63–1.16 |
3. Stock Status of Croaker Fishery
The CMSY methods assessed F/FMSY values < 1 and B/BMSY values close to 1, indicating safe fishing conditions and healthy stock in which biomass levels were enough to produce the MSY and, thus, the biomass levels were enough of a sustainable state of croaker in the BoB. Kobe phase plot was used to depict the current stock status and exploitation rate relative to target reference points (TRPs) such as FMSY and BMSY. The Kobe plot is characterized by four colored quadrants (orange, red, yellow, and green) for F/FMSY on B/BMSY. The orange plot denotes the healthy stock that will be depleted by overfishing. The red color plot indicates the overfished and overfishing status in which the biomass cannot produce the MSY. The yellow color plot shows very low biomass, but the stock has a chance to recover in a sustainable state if fishing pressure is reduced. The green plot is the management targeted area, signifying healthy stock status and sustainable fishing to produce the MSY. The Kobe plot indicates the probability of 80.7% of the stock subsiding into the green area. 10.6% in the red area, 8.5% in the yellow area, and 0.3% in the orange area. The BSM-derived BRPs indicate that the exploitation of croaker stock started from the yellow plot in 2001 and already moved to the green area because of the reduction in fishing efforts from 2013 and safe fishing pressure (Figure 3). The representation of the Kobe phase plot suggests that the current level of fishing pressure should be strictly maintained to ensure the sustainability of croaker in the marine water of Bangladesh.
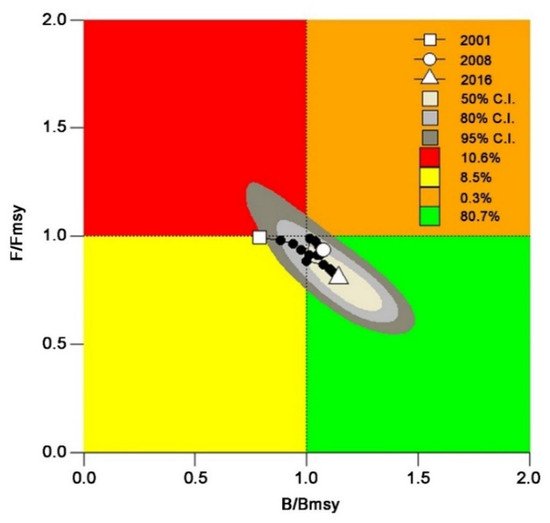
Figure 3. Kobe plot illustrating the concurrent movement of exploitation (F/FMSY) and the relative biomass (B/BMSY) of croaker in the BoB waters of Bangladesh.
4. Summary
To recommend maintaining the catch at the MSY level, and current fishing pressure should not increase to ensure the sustainability of the croaker. The evaluated BPRs and stock information from this research will help fishery managers and policymakers to manage the croaker and other fisheries’ sustainability in the Bay of Bengal, Bangladesh.
This entry is adapted from the peer-reviewed paper 10.3390/jmse10010063
References
- Fanning, L.P.; Chowdhury, S.R.; Uddin, M.S.; Al-Mamun, M.A. Marine Fisheries Survey Reports and Stock Assessment 2019; Department of Fisheries, Government of Bangladesh: Dhaka, Bangladesh, 2019.
- Sabbir, W.; Rahman, M.A.; Hossain, M.Y.; Hasan, M.R.; Mawa, Z.; Rahman, O.; Tanjin, S.; Sarmin, M.S. Stock assessment of Hooghly Croaker Panna heterolepis in the Bay of Bengal (Southern Bangladesh): Implications for sustainable management. Heliyon 2021, 7, e07711.
- Froese, R.; Pauly, D. Fishbase. Available online: https://fishbase.mnhn.fr/search.php (accessed on 20 August 2021).
- DoF (Department of Fisheries). Yearbook of Fisheries Statistics of Bangladesh, 2019–2020; Department of Fisheries, Ministry of Fisheries and Livestock, Government of Bangladesh: Dhaka, Bangladesh, 2020; Volume 37.
- Zafar, M.; Mustafa, G.; Amin, S.M.N.; Haque, M.A. Population dynamics of Johnius argentatus (Houttuyn) from the northeastern part of the Bay of Bengal, Bangladesh. Asian Fish. Sci. 2000, 13, 243–249.
- Uddin, K.; Reza, M.; Islam, M.; Kamal, M. Influence of salt on drying performance of silver jewfish (Otolithes argentatus) in a Hohenheim type solar tunnel dryer. J. Bangladesh Agric. Univ. 2014, 12, 227–233.
- Lin, L.; Liu, Z.; Jiang, Y.; Huang, W.; Gao, T. Current status of small yellow croaker resources in the southern Yellow Sea and the East China Sea. Chin. J. Oceanol. Limnol. 2011, 29, 547–555.
- Sabbir, W.; Hossain, M.Y.; Rahman, M.A.; Hasan, M.R.; Khan, M.N.; Mawa, Z.; Tanjin, S.; Sarmin, M.S.; Rahman, O.; Nima, A.; et al. Growth pattern of the Hooghly croaker Panna heterolepis (Trewavas, 1977) in the Bay of Bengal (Bangladesh) in relation to eco-climatic factors. Egypt. J. Aquat. Biol. Fish. 2020, 24, 847–862.
- Mustafa, M.G.; Ahmed, I.; Ilyas, M. Population Dynamics of Five Important Commercial Fish Species in the Sundarbans Ecosystem of Bangladesh. J. Appl. Life Sci. Int. 2019, 22, 1–13.
- Jayasankar, P. Population dynamics of big-eye croaker Pennahia macrophthalmus and blotched croaker Nibea maculata (Sciaenidae) in the trawling grounds off Rameswaram Island, east coast of India. Indian J. Mar. Sci. 1995, 24, 153–157.
- Prager, M.H. User’s Guide for ASPIC Suite, Version 7: A Stock–Production Model Incorporating Covariates and Auxiliary Programs; Prager Consulting: Portland, OR, USA, 2016.
- Froese, R.; Demirel, N.; Coro, G.; Kleisner, K.M.; Winker, H. Estimating fisheries reference points from catch and resilience. Fish Fish. 2017, 18, 506–526.
- Barman, P.P.; Karim, E.; Khatun, M.H.; Rahman, M.F.; Alam, M.S.; Liu, Q. Application of CMSY to Estimate Biological Reference Points of Bombay Duck (Harpadon nehereus) from the Bay of Bengal, Bangladesh. Appl. Ecol. Environ. Res. 2020, 18, 8023–8034.
This entry is offline, you can click here to edit this entry!