Your browser does not fully support modern features. Please upgrade for a smoother experience.
Please note this is an old version of this entry, which may differ significantly from the current revision.
Subjects:
Anatomy & Morphology
Histological and ultrastructural studies revealed peculiar mesenchymal cells adjacent to the epithelium that generated an intricate mesh spanning from the folds’ base to their apex. Their voluminous nuclei, limited cytoplasm and long cytoplasmic projections characterized them as telocytes (TCs).
- intestine
- stem-cell niche
- telocytes
- rainbow trout
1. Identification and Characterization of Telocytes in the Rainbow Trout Gut
1.1. Histological Analysis
The morphological analysis of the intestinal stroma revealed the presence of slender, elongated cells. They were in the subepithelial region around the folds’ base and along their length in both the proximal and distal intestine. Hematoxylin–eosin staining highlighted a typical distribution generating a supportive network within the interstitial space adjacent to the enterocytes’ basement membrane (Figure 1).
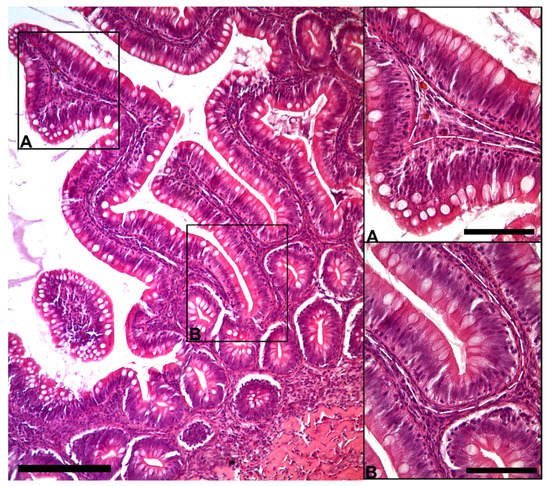
Figure 1. Representative image of hematoxylin–eosin-stained sections showing the general organization of peculiar stromal cells (Scale bar 250 µm) located just below the enterocytes’ basement membrane along the folds ((A); scale bar 50 µm) and encircling the folds’ base ((B); scale bar 50 µm).
The observation using the light microscope revealed that this cell population was characterized by a peculiar moniliform shape due to the presence of a thin and elongated nucleus and stretched, slender cytoplasmic projections (Figure 2).
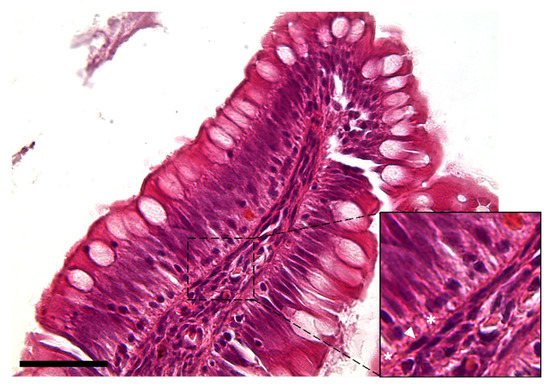
Figure 2. Hematoxylin–eosin-stained section showing the peculiar moniliform shape of the stromal cells because of their thin elongated nuclei (arrowhead) and long cytoplasmic branches (asterisks) (Scale bar 50 µm).
Moreover, Periodic Acid Schiff–Alcian Blue at pH 2.5 (PAS–AB 2.5), Masson’s trichrome, Mallory’s triple stain, Crossman’s trichrome histochemical staining (Figure 3 and Figure 4), and toluidine-blue-stained semi-thin sections (Figure 5) further emphasized the generation of a continuous elaborate network underneath the intestinal epithelium.
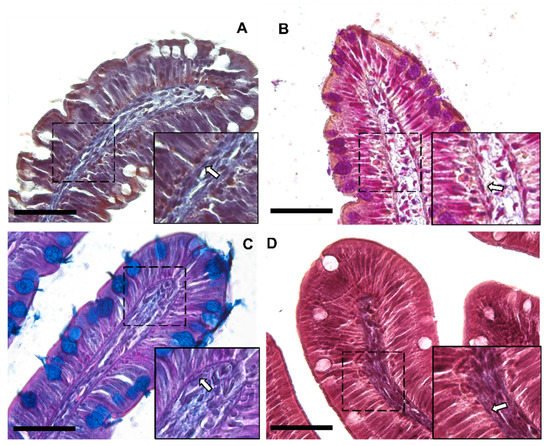
Figure 3. Representative images of Crossman’s trichrome (A), Mallory’s triple stain (B), Periodic Acid Schiff–Alcian Blue at pH 2.5 (PAS–AB 2.5) (C) and Masson’s trichrome (D) histochemical staining emphasizing the intricate network underneath the intestinal epithelium in the proximal intestine of rainbow trout (arrow). Scale bar 50 µm.
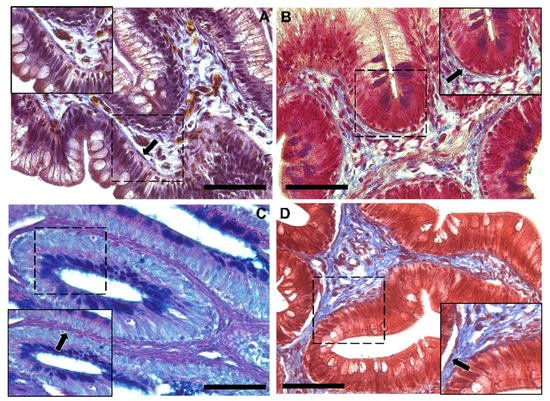
Figure 4. Representative images of Crossman’s trichrome (A), Mallory’s triple stain (B), Periodic Acid Schiff–Alcian Blue at pH 2.5 (PAS–AB 2.5) (C) and Masson’s trichrome (D) histochemical staining emphasizing the intricate network underneath the intestinal epithelium in the distal intestine (arrow). Scale bar 50 µm.
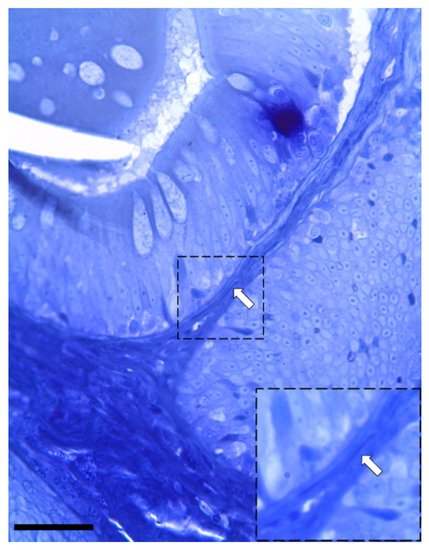
Figure 5. Semi-thin section stained with toluidine blue showing the presence of elongated stromal cells located along the enterocytes’ basement membrane (arrow). (Scale bar 25 µm).
1.2. Ultrastructural Analysis
The examination with TEM confirmed the presence of stromal cells underlying the epithelium which were clearly distinguishable from the common fibroblasts found in the lamina propria. They presented an elongated nucleus containing heterochromatin clusters with limited cytoplasm and very long, thin projections. Moreover, they possessed an irregular shape with a variable number of branches, generally 2–3 per cell (Figure 6). These branches, called telopods (TPs), developed in a non-linear fashion, presented peripheral dilations, or podoms (Pm), that hosted cellular organelles and vacuoles (Figure 7), and were surrounded by collagen fibers (Figure 8).
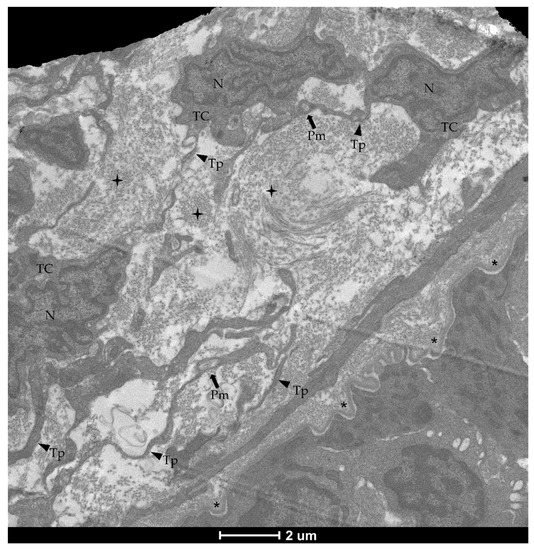
Figure 6. Transmission electron microscopy (TEM) showing telocytes (TCs) located along the enterocytes’ basement membrane (asterisks) characterized by extended nuclei (N), limited cytoplasm and long, thin discontinuous branches (Tp) surrounded by collagen fibers (cross) which dilate in the periphery, forming podoms (Pm).
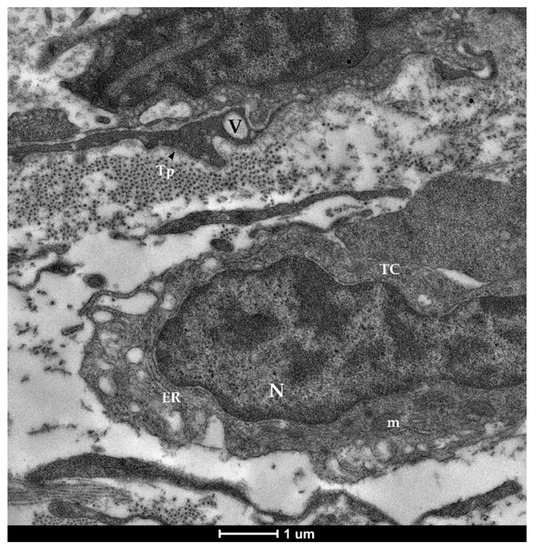
Figure 7. Transmission electron microscopy (TEM) showing telocytes (TCs) characterized by extended nuclei (N), limited cytoplasm hosting cellular organelles (ER—endoplasmic reticulum, m—mitochondria) and vacuoles (V).
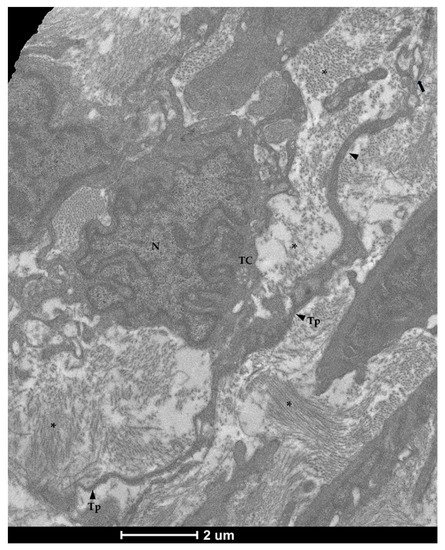
Figure 8. Transmission electron microscopy (TEM) showing telocytes (TCs) characterized by extended nuclei (N), scarce and limited cytoplasm with long and thin prolongations (Tp) forming podoms (arrow) and surrounding by collagen fibers (asterisks).
Overall, histological and ultrastructural features confirmed the identity of these cells as telocytes.
1.3. Pdgfrα and Foxl1 Expression
In situ hybridization showed that pdgfrα was expressed in many cells located exclusively in the stroma. Here, two clearly distinct pdgfrα+ cell populations were visible. The first displayed high pdgfrα expression, had slender, elongated nuclei and was located just below the basement membrane of the intestinal epithelium. These cells created a continuous plexus that extended from the basal to the apical compartment (Figure 9A,B; Scale bar 100 µm). They showed more intense pdgfrα expression at the fold apex and along its length, while it tended to become lower around the folds’ base (Figure 9C,D; Scale bar 50 µm). The other pdgfrα + population was characterized by a low signal and was located in the innermost region of the lamina propria, away from the epithelium (Figure 8E; Scale bar 50 µm).
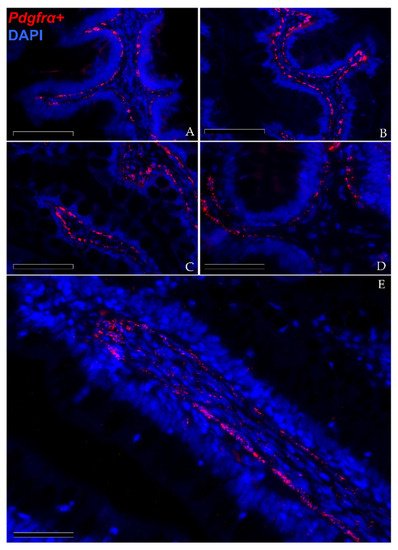
Figure 9. In situ hybridization of pdgfrα (red dots) along the rainbow trout gut. Pdgfrα+ cells were distributed along the folds’ stroma. Two distinct pdgfrα+ cell populations have been observed: the first showed pdgfrα at high levels and was specifically located adjacent to the enterocytes’ basement membrane. This created a complex mesh underlying the folds’ epithelium ((A,B); Scale bar 100 µm). Moreover, the signal was more intense along the folds’ length and at the folds’ apex compared to the one around the folds’ base ((C,D); Scale bar 50 µm). The other expressed pdgfrα at low levels and was located in the inner region of the lamina propria ((E); Scale bar 50 µm). Nuclei were counterstained with DAPI.
Foxl1+ cells were observed along the folds’ connective axis in both the proximal and distal intestine. Its expression was rare and limited to a few cells located in the peri-epithelial space at the folds’ base. In the distal intestine, foxl1+ cells were found not only around the folds’ base but also around the base of the secondary folds protruding from the complex plicae, which are characteristic of this region. As opposed to pdgfrα, scattered mRNA dots of foxl1 were also found in the epithelium lining the base of the folds (Figure 10).
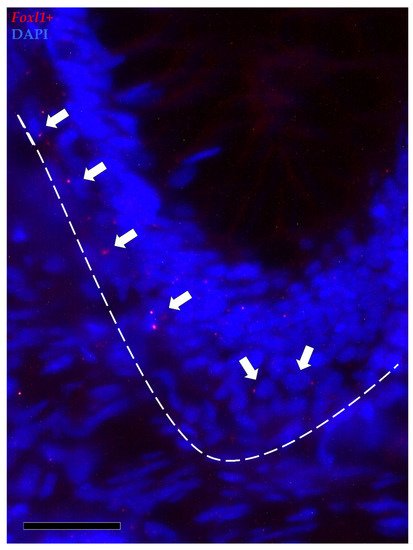
Figure 10. In situ hybridization of foxl1 (red dots) around the base of the folds of the proximal intestine. Foxl1 was expressed by a few stromal cells encircling the folds’ base (arrows). Some mRNA dots were also observed within the epithelium lining the folds’ base.
Furthermore, pdgfrα and foxl1 transcripts were co-expressed in a few elongated cells localized just beneath the basal membrane, at the base and at the apex of the intestinal folds, indicating the presence of a small telocyte subpopulation along the whole intestinal length (Figure 11).
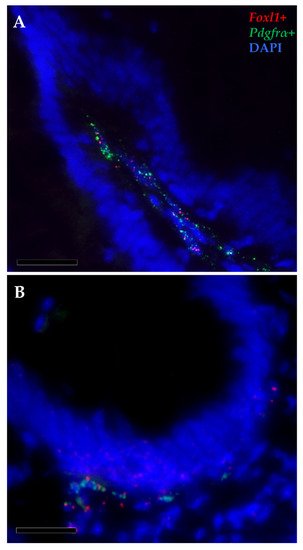
Figure 11. In situ hybridization of foxl1 (red dots) and pdgfrα mRNA (green dots) within the stromal space along the folds (A) and surrounding the folds’ base of the proximal intestine (B). Few pdgfrα+ cells simultaneously expressed foxl1, indicating the presence of a small functional telocyte subset.
2. Telocytes as Stromal Component of the Stem-Cell Niche
We previously demonstrated that sox9+ cells in the RT intestine could represent the stem-cell population because of their morphological characteristics and topographical location being analogous to the well-known crypt-base-columnar cells (CBCs) in the small and large intestines of mice [25]. To further confirm our previous hypothesis, we performed an ultrastructural analysis of the epithelial cell population lining the folds’ base.
TEM investigation revealed the presence of rare and slender cells characterized by an unbalanced nucleus-to-cytoplasm ratio in favor of the nucleus, which contained loose, decondensed heterochromatin, a distinguishing marker of the stem-cell population. These observations confirmed their identity as crypt-base-columnar stem cells. They were interposed among other common epithelial cells which were instead defined by a heterochromatin cluster with a compact appearance (Figure 12).
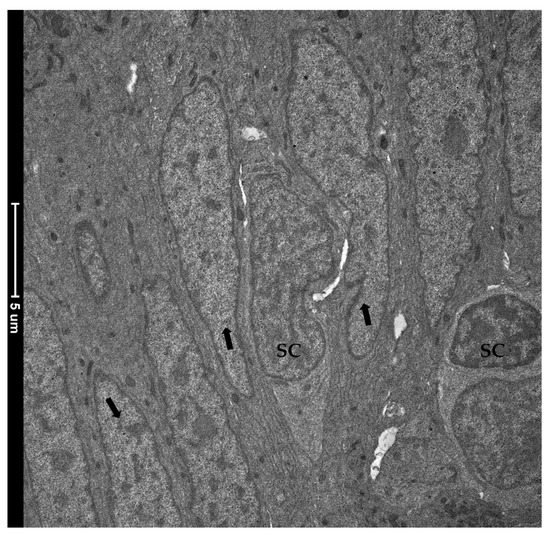
Figure 12. Transmission electron microscopy (TEM) showing the ultrastructural features of the epithelial cells lining the folds’ base. Rare and slender cells displaying the typical stem-cell nuclei characterized by loose, decondensed heterochromatin (SC) were found interposed among common epithelial cells defined by a heterochromatin cluster with a compact appearance (arrows).
Immunodetection of PCNA revealed that TCs are not proliferating cells. However, they were in direct communication with proliferating cells since they enwrapped the proliferative compartment located at the base of the folds (Figure 13).
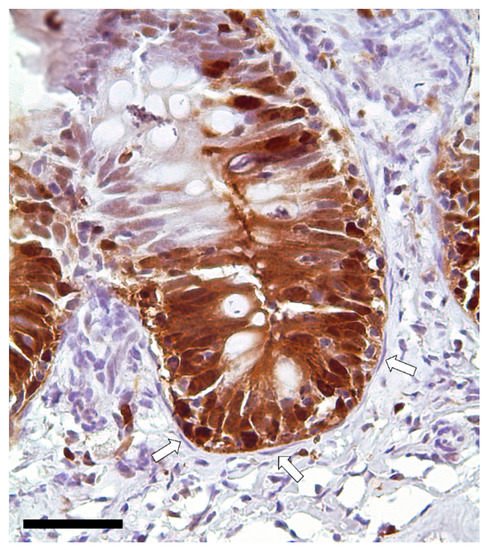
Figure 13. Immunolocalization of proliferating cell nuclear antigen (PCNA) showing a strong signal in the epithelial cells located at the folds’ base. Instead, telocytes enwrapping the proliferative compartment did not show any expression (arrows). Scale bar 50 µm.
To further elucidate the relationship between TCs and the intestinal stem cells, we then combined the in situ hybridizations of foxl1+ and sox9, the marker of RT stem cells.
Moreover, the results showed that the foxl1+ TCs were in close proximity to crypt-base-columnar sox9+ cells, the typical epithelial stem cells (Figure 14). Furthermore, foxl1 colocalized with sox9 in a few epithelial cells expressing this gene at lower levels in the folds’ base. These are known to be cells at the beginning of their differentiation pathway, described as progenitor cells [17].
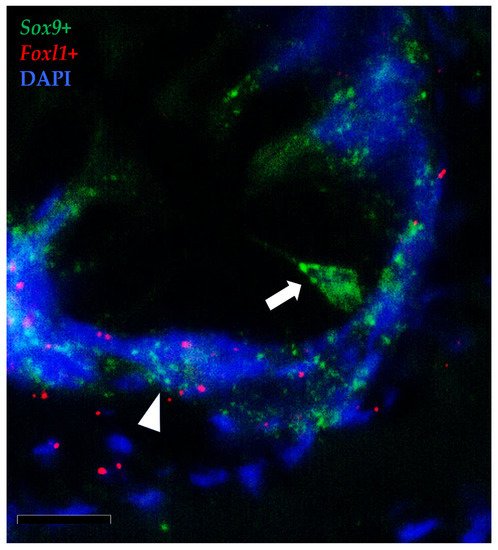
Figure 14. In situ hybridization of foxl1 (red dots) and sox9 (green dots) mRNA in rainbow trout distal intestine. Stromal foxl1+ cells were distributed in a strategic position close to crypt-base-columnar sox9+ cells (arrow). Few foxl1+ dots were also found in the epithelium lining the folds’ base where they colocalized with cells displaying sox9 at low level (arrowhead) (Scale bar 50µm).
Finally, spherical vesicles were detected in the extracellular space close to telocytes. Their position, shape, membrane morphology and size enabled their classification as extracellular vesicles (EVs) (Figure 15 and Figure 16). Furthermore, TCs distributed along the folds’ length produced EVs that were larger in diameter (310–450 nm) compared to those released by the TCs encircling the folds’ base (120–130 nm).
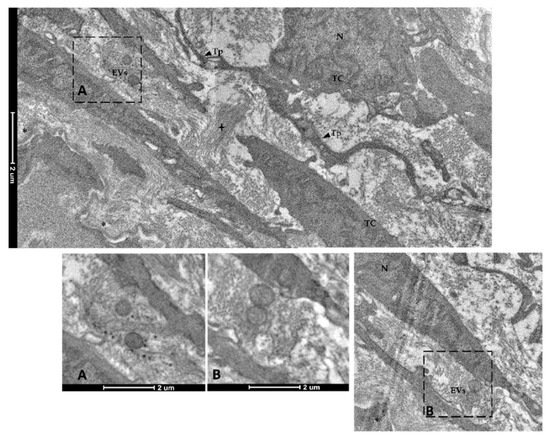
Figure 15. Transmission electron microscopy (TEM) showing extracellular vesicles (EVs) within the extracellular space in the close proximity of telocytes (TCs) located along the folds’ length (N—Nucleus, Tp—telopods, cross—collagen fibers, asterisk—basement membrane). Images A–B show extracellular vesicles in higher magnification.
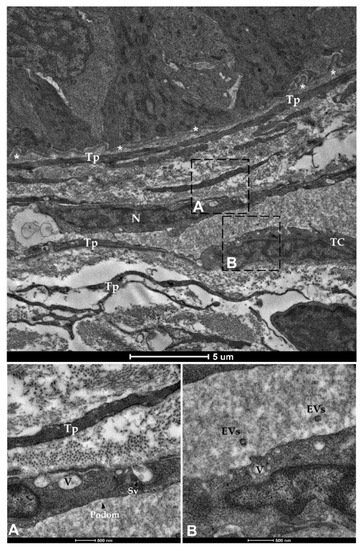
Figure 16. Transmission electron microscopy (TEM) showing telocytes (TCs) distributed juxtaposed to the epithelium and encircling the folds’ base, characterized by extended nuclei and long, slender prolongations. Shedding vesicles (SVs) and extracellular vesicles (EVs) released within the extracellular space are visible in higher magnification (A,B). (N—Nucleus, Tp—telopods, V—Vacuoles, asterisks—basement membrane).
This entry is adapted from the peer-reviewed paper 10.3390/ani12010074
This entry is offline, you can click here to edit this entry!