Defining Blood Plasma and Serum Metabolome by GC-MS: History
Please note this is an old version of this entry, which may differ significantly from the current revision.
Contributor: ,

Metabolomics uses advanced analytical chemistry methods to analyze metabolites in biological samples. The most intensively studied samples are blood and its liquid components: plasma and serum. Armed with advanced equipment and progressive software solutions, the scientific community has shown that small molecules’ roles in living systems are not limited to traditional “building blocks” or “just fuel” for cellular energy. 

  • serum
  • plasma
  • metabolomics
  • GC-MS

1. Introduction

Metabolites are substances with low molecular weight (<1500 Da), intermediates, and products of chemical reactions catalyzed by various enzymes in living systems. In other words, metabolites are small molecules reacting to intrinsic or environmental challenges. The metabolome, in turn, is a “snapshot” of all metabolites in the biological object at a specific time point.
Metabolomics is an essential member of the “omics” family. First, the genome and the transcriptome, made up of four bases, provide possible scenarios of the functioning of biological systems. Next, assembled from 20 amino acids, the proteome shows which protein machines are available. Finally, the metabolome indicates the reaction of the biological system to disturbances happening right now [1].
As the final stage of the spectrum of “omics,” metabolomics reflects the diversity of chemicals arising from the sequential and synergistic interactions of 20,000+ human genes, 60,000+ transcripts, and 1,000,000 types of proteins in the dynamically changing environment [2][3]. The information about how an organism or a cell attempts to retain nutrients while eliminating xenobiotics is vital for predicting the phenotype of a biological system [4].
Exploring the human metabolome is valuable for understanding pathophysiological processes and searching for new diagnostic and prognostic biomarkers of various disorders [5][6], accelerating drug discovery [7], and assessing the impact of diet [8][9], lifestyle [10], and other factors [11].
In the professional community of scientists working in metabolomics, the gas chromatography-mass spectrometry tandem (GC-MS) has a reputation as one of the most reliable, robust, and used analytical platforms, accompanied by a variety of spectral libraries for processing experimental data [12].

2. Serum and Plasma Metabolome as a “Snapshot” of a Human Biochemistry

The serum is a biological liquid obtained when whole blood coagulates. Coagulation is a vital process that prevents excessive blood loss from a minor wound. In a laboratory, it is common to centrifuge the coagulated blood to the bottom of the collection tube, leaving serum above the clot. The main components of serum are water, various proteins, peptides, amino acids, hormones, nitrogen compounds, various ions and salts, traces of nucleic acids, metabolites, and lipids.
Plasma is the liquid component of blood, where coagulation has been prevented. It is obtained when a clotting-prevention agent (called anticoagulant) is added to whole blood and then placed in a centrifuge to separate the cellular material from the lighter liquid layer. Common anticoagulant agents are EDTA (ethylenediaminetetraacetic acid), heparin, and citrate. After centrifugation, the remaining plasma contains fibrinogen and other coagulation factors in their original state. From the biochemical point of view, plasma is practically identical to the liquid fraction of circulating blood (except for anticoagulants). It can be said that the main difference between plasma and serum is the presence of fibrinogen and coagulation proteins. Still, there are many other more subtle differences (e.g., in eicosanoids’ levels [13][14]).
Studies show that none of the considered biological fluids has a clear advantage over the other in forming a representative metabolomic image of the object under investigation or the development of potential biomarkers [14–16]. Unless the primary plasma preparation looks more attractive: the processing is more reproducible and fast since there is no need to wait for the blood to clot, and clotting time may vary across individuals [17]. Another advantage of plasma over serum is the lower risk of hemolysis and thrombocytolysis, as well as the almost complete absence of post-centrifugal coagulation interference that can occur in serum.

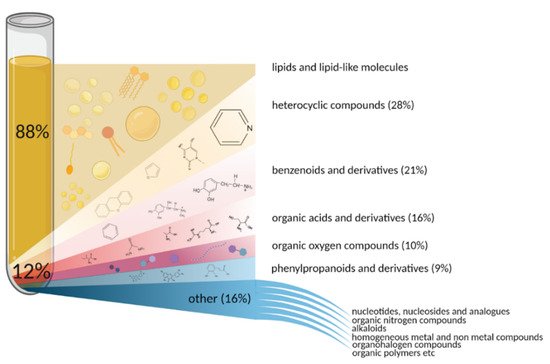
3. How Many Blood Metabolites Are There?

The potential space of organic substances that make up the metabolome is truly colossal: it lies between 1063 and 10200 unique substances [15]. At the moment, according to the HMDB 5.0, the world’s largest and most comprehensive human metabolome database [16], more than 18 thousand unique low-molecular compounds of various nature have been detected and quantified in human blood. However, the diversity of metabolites in human blood is complex and challenging to assess.
Globally, all human blood metabolites can be divided into water-soluble and lipid-soluble groups. The share of lipid-soluble molecules accounts for 88% of the metabolome (Figure 1). Lipids and lipid-like substances represent a significant and chemically diverse fraction of metabolome (>80,000 lipid molecules exist in humans, and more than 20,000 of them are found in the blood), which play essential roles in living systems. Various functional groups of lipids make them versatile machines serving as cellular barriers (various phospho- and glycolipids [17], membrane matrices (cholesterol), signaling agents (ceramide, sphingosine), and energy reservoirs (triglycerides) [18][19][20].
Non-lipid metabolites account for only about 12% of the total blood metabolome. Still, the variety of classes these substances belong to is much wider than that of the lipid-soluble fraction (Figure 1).
Figure 1. Diversity of chemical substances comprising human blood metabolome based on HMDB 5.0.

4. Approaches of Metabolome Exploration
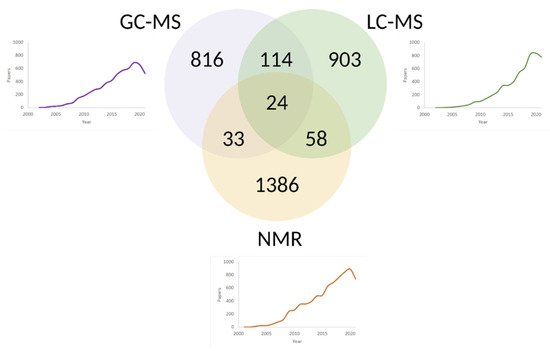
Just as proteomics differs from protein chemistry in that it seeks to cover the entire spectrum of protein compounds, metabolomics differs from local analytical techniques in the breadth of view on the profile of low molecular weight molecules. Metabolites are so diverse in physical and chemical properties: a mix of volatile alcohols, hydrophilic sugars, and hydrophobic lipids, amino- and non-amino organic acids comprise the metabolome of the sample. This motivates metabolome researchers to exploit the advantages of several analytical platforms [5].
High-throughput spectroscopic techniques are major tools of metabolomics. The most popular of them are nuclear magnetic resonance (NMR) spectroscopy [21] and mass spectrometry (MS) solo [22] or in tandem with gas (GC) [23][24] or liquid (LC) [25] chromatography (Figure 2). Both spectroscopic platforms provide extensive information on the composition and structure of several compounds of different chemical nature in a single analytical run.
Figure 2. Venn diagram and timelines comprising the number of scientific publications on blood metabolome studies via LC-MS, GC-MS, and NMR up to date. The queries “LC-MS blood metabolome”, “GC-MS blood metabolome” and “NMR blood metabolome” were addressed to the PubMed repository. The leader in the number of publications is the most mature NMR technology, followed by gas and liquid chromatography in tandem with MS. Due to the different applicability of NMR, LC-MS, GC-MS for various classes of metabolites, the combination of two or even three analytical platforms has been used in 200+ metabolomics projects. The synergy is especially noticeable between GC-MS and LC-MS, used together approximately in 7% of mass spectrometry-based experiments.

4.1. NMR

The NMR method is based on the magnetic properties of the 1H and 13C nuclei. Suppose a molecule containing such nuclei is placed in a magnetic field and irradiated with a radio-frequency pulse. In that case, the atomic nuclei will go into an excited state, and the researcher will be able to register the signal of subsequent relaxation. This signal depends on the amount of the irradiated substance and ultimately contains information about the environment of the nucleus. Thus, the NMR spectrum of a substance is a superposition of signals from all resonating nuclei.
NMR requires relatively simple sample preparation [26]. However, moderate resolution and sensitivity of NMR impede the determination of low-abundant metabolites [27]. Another significant drawback of NMR is the small number of determined metabolites in complex mixtures (from 20 to 200 unique substances, depending on the resolution of NMR) in comparison with MS (potentially more than 500 identified substances). This advantage makes mass spectrometry dominant for exploring a wide range of metabolites [28].

4.2. Tandem of Chromatography and Mass Spectrometry

Separation-based MS techniques take advantage of both “ingredients.” Due to the characteristic pattern of the parent and daughter ions and advanced MS detectors, the specificity of the analysis is ensured without loss of sensitivity [29]. Before MS detection, the procedure of chromatography is carried out to downgrade the complexity of the sample. The sample components are moving through the stationary phase in the flow of the mobile phase. As a result, the complexity of the analyzed mixture entering the mass spectrometer decreases due to the distribution of substances between the mobile and stationary phases of the chromatographic column by their solubility, polarity, and volatility.

5. Workflow of GC-MS Analysis of Blood Metabolome

5.1. Sample Preparation

The efficiency of metabolomic analysis largely depends on the stage of sample preparation. Aberrations at this stage affect the list of detected and identified molecules, the quality of the data, and, as a result, the biomedical interpretation of obtained results. Therefore, the choice of sample preparation method mainly depends on the type and volume of the sample, the physical-chemical properties of the analytes being measured, and the analytical platform used for the analysis. Metabolic analysis of plasma or serum by GC-MS involves several sequential sample preparation steps, including quenching, extraction, and derivatization. Each of these stages is described in Figure 3.
Figure 3. Stages of standard GC-MS analysis of plasma or serum samples. In a hypothesis-driven study, a metabolomic experiment starts with formulating a hypothesis, which further work will be aimed at confirming or refuting. Preanalytic operations involve quenching enzymatic processes (stage 1) in every biological sample from a representative sample. Further, the sample is purified (stage 2) from interfering protein molecules, followed by liquid or solid-phase extraction (stage 3), which allows the release of metabolites from the plasma or serum matrix and concentrates them in a smaller volume. Next, extracted metabolites are derivatized (stage 4) to improve their volatility and thermal stability. After ensuring that the quality criteria (stage 5) are met, the researcher performs a gas chromatography-mass spectrometric experiment (stage 6). Finally, data processing (stage 7) provides the researcher with either an answer to the original question or the basis for starting a new data-driven study [30].

5.2. Gas Chromatography

Gas chromatography allows the separation of a vaporized mixture of substances due to differences in the speed of movement of individual components in the flow of the gaseous mobile phase along with the stationary phase of the thermally controlled column.

5.3. Mass Spectrometry

After chromatographic separation, the analytes eluting from the column pass through a heated transfer line and interact with an MS detector. This interaction generates a response, which could be digitized and transferred to the data system. The magnitude of the signal from a certain molecular ion (or its fragments) and time from the moment of injection are used to generate a chromatogram.

5.4. Data Processing

Metabolomics is a data-intensive scientific field. The raw data acquired by tandem chromatography with mass spectrometry are a complex three- (or even four in case of GC×GC) dimensional set of retention times, m/z values, and their intensities. Interpretation of results obtained in a GC-MS experiment is a delicate process. Each academic group independently chooses to use commercial or freely available software or even create its customized scripts. Both public and commercial packages for GC-MS data processing perform primary preparation of raw files (noise smoothing, baseline correction, feature detection, alignment, normalization), library matching, visualization, and, optionally, downstream analysis (Figure 4).

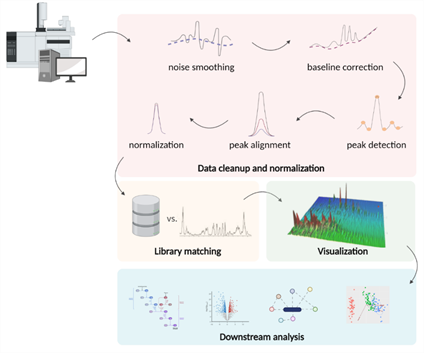
Figure 4. Typical steps in the processing of GC-MS metabolomics data: noise filtering, baseline correction, peak detection, and normalization. The filtered data obtained after preliminary processing is compared with the spectral libraries. The resulting array of annotated spectra can be visualized and used in further statistical algorithms to build biological models.

6. Current Challenges and Prospects in Measuring Metabolites

There are clear signs of the potential of integration of metabolomics into the clinical space [31], which is hampered by insufficiently effective design of data acquisition and (re-)processing [32][33], imperfect standard operating procedures [34], lack of adequate quality controls [35] and unrepresentative samples collections [36]. Already today, there are entire platforms of the complete cycle (for example, Metabolon [37]), within the framework of which the design of the experiment, its implementation and processing of the obtained data are carried out.

Due to their circulating nature, liquid blood components - plasma and serum - are excellent matrices for metabolomic studies [38]. However, the diverse chemistry and wide dynamic range of blood metabolites require digging deeper and developing tailored analytical techniques to provide proper metabolome coverage. It is believed that synergу of analytical tools [39], interdisciplinary researches [40], and standardization efforts [34], will increase the rate of integration of blood metabolomics discoveries into practice, providing health professionals, system biologists, data scientists, engineers, and analytical chemists the opportunity to advance their respective industries.

This entry is adapted from the peer-reviewed paper 10.3390/metabo12010015

References

  1. Goodacre, R. Metabolomics of a superorganism. J. Nutr. 2007, 137, 259S–266S.
  2. Kim, S.J.; Kim, S.H.; Kim, J.H.; Hwang, S.; Yoo, H.J. Understanding Metabolomics in Biomedical Research. Endocrinol. Metab. 2016, 31, 7.
  3. Ponomarenko, E.A.; Poverennaya, E.V.; Ilgisonis, E.V.; Pyatnitskiy, M.A.; Kopylov, A.T.; Zgoda, V.G.; Lisitsa, A.V.; Archakov, A.I. The Size of the Human Proteome: The Width and Depth. Int. J. Anal. Chem. 2016, 2016, 7436849.
  4. Schrimpe-Rutledge, A.C.; Codreanu, S.G.; Sherrod, S.D.; McLean, J.A. Untargeted Metabolomics Strategies—Challenges and Emerging Directions. J. Am. Soc. Mass Spectrom. 2016, 27, 1897–1905.
  5. Wishart, D.S. Metabolomics for Investigating Physiological and Pathophysiological Processes. Physiol. Rev. 2019, 99, 1819–1875.
  6. Johnson, C.H.; Ivanisevic, J.; Siuzdak, G. Metabolomics: Beyond biomarkers and towards mechanisms. Nat. Rev. Mol. Cell Biol. 2016, 17, 451–459.
  7. Wishart, D.S. Emerging applications of metabolomics in drug discovery and precision medicine. Nat. Rev. Drug Discov. 2016, 15, 473–484.
  8. Guasch-Ferre, M.; Bhupathiraju, S.N.; Hu, F.B. Use of Metabolomics in Improving Assessment of Dietary Intake. Clin. Chem. 2018, 64, 82–98.
  9. Li, J.; Guasch-Ferré, M.; Chung, W.; Ruiz-Canela, M.; Toledo, E.; Corella, D.; Bhupathiraju, S.N.; Tobias, D.K.; Tabung, F.K.; Hu, J.; et al. The Mediterranean diet, plasma metabolome, and cardiovascular disease risk. Eur. Heart J. 2020, 41, 2645–2656.
  10. Jacob, M.; Lopata, A.L.; Dasouki, M.; Abdel Rahman, A.M. Metabolomics toward personalized medicine. Mass Spectrom. Rev. 2019, 38, 221–238.
  11. Heaney, L.M.; Deighton, K.; Suzuki, T. Non-targeted metabolomics in sport and exercise science. J. Sports Sci. 2019, 37, 959–967.
  12. Beale, D.J.; Pinu, F.R.; Kouremenos, K.A.; Poojary, M.M.; Narayana, V.K.; Boughton, B.A.; Kanojia, K.; Dayalan, S.; Jones, O.A.H.; Dias, D.A. Review of recent developments in GC-MS approaches to metabolomics-based research. Metabolomics 2018, 14, 152.
  13. Lima-Oliveira, G.; Monneret, D.; Guerber, F.; Guidi, G.C. Sample management for clinical biochemistry assays: Are serum and plasma interchangeable specimens? Crit. Rev. Clin. Lab. Sci. 2018, 55, 480–500.
  14. Yasumoto, A.; Tokuoka, S.M.; Kita, Y.; Shimizu, T.; Yatomi, Y. Multiplex quantitative analysis of eicosanoid mediators in human plasma and serum: Possible introduction into clinical testing. J. Chromatogr. B 2017, 1068–1069, 98–104.
  15. Peironcely, J.E.; Reijmers, T.; Coulier, L.; Bender, A.; Hankemeier, T. Understanding and classifying metabolite space and metabolite-likeness. PLoS ONE 2011, 6, e28966.
  16. Wishart, D.S.; Feunang, Y.D.; Marcu, A.; Guo, A.C.; Liang, K.; Vázquez-Fresno, R.; Sajed, T.; Johnson, D.; Li, C.; Karu, N.; et al. HMDB 4.0: The human metabolome database for 2018. Nucleic Acids Res. 2018, 46, D608–D617.
  17. Harayama, T.; Riezman, H. Understanding the diversity of membrane lipid composition. Nat. Rev. Mol. Cell Biol. 2018, 19, 281–296.
  18. Züllig, T.; Trötzmüller, M.; Köfeler, H.C. Lipidomics from sample preparation to data analysis: A primer. Anal. Bioanal. Chem. 2020, 412, 2191–2209.
  19. Quehenberger, O.; Dennis, E.A. The human plasma lipidome. N. Engl. J. Med. 2011, 365, 1812–1823.
  20. O’Donnell, V.B.; Ekroos, K.; Liebisch, G.; Wakelam, M. Lipidomics: Current state of the art in a fast moving field. Wiley Interdiscip. Rev. Syst. Biol. Med. 2020, 12, e1466.
  21. Giraudeau, P. NMR-based metabolomics and fluxomics: Developments and future prospects. Analyst 2020, 145, 2457–2472.
  22. Kirwan, J.A.; Broadhurst, D.I.; Davidson, R.L.; Viant, M.R. Characterising and correcting batch variation in an automated direct infusion mass spectrometry (DIMS) metabolomics workflow. Anal. Bioanal. Chem. 2013, 405, 5147–5157.
  23. Wang, Y.; Zhou, L.; Zhou, Y.; Zhao, C.; Lu, X.; Xu, G. A rapid GC method coupled with quadrupole or time of flight mass spectrometry for metabolomics analysis. J. Chromatogr. B Analyt. Technol. Biomed. Life Sci. 2020, 1160, 122355.
  24. Fiehn, O. Metabolomics by Gas Chromatography-Mass Spectrometry: Combined Targeted and Untargeted Profiling. Curr. Protoc. Mol. Biol. 2016, 114, 30.4.1–30.4.32.
  25. Gika, H.; Virgiliou, C.; Theodoridis, G.; Plumb, R.S.; Wilson, I.D. Untargeted LC/MS-based metabolic phenotyping (metabonomics/metabolomics): The state of the art. J. Chromatogr. B 2019, 1117, 136–147.
  26. Martias, C.; Baroukh, N.; Mavel, S.; Blasco, H.; Lefèvre, A.; Roch, L.; Montigny, F.; Gatien, J.; Schibler, L.; Dufour-Rainfray, D.; et al. Optimization of Sample Preparation for Metabolomics Exploration of Urine, Feces, Blood and Saliva in Humans Using Combined NMR and UHPLC-HRMS Platforms. Molecules 2021, 26, 4111.
  27. Nagana Gowda, G.A.; Raftery, D. Can NMR solve some significant challenges in metabolomics? J. Magn. Reson. 2015, 260, 144.
  28. Emwas, A.H.M. The strengths and weaknesses of NMR spectroscopy and mass spectrometry with particular focus on metabolomics research. Methods Mol. Biol. 2015, 1277, 161–193.
  29. Wang, Y.; Liu, S.; Hu, Y.; Li, P.; Wan, J.B. Current state of the art of mass spectrometry-based metabolomics studies—A review focusing on wide coverage, high throughput and easy identification. RSC Adv. 2015, 5, 78728–78737.
  30. Chetwynd, A.J.; Dunn, W.B.; Rodriguez-Blanco, G.; Chetwynd, A.J.; Dunn, W.B.; Rodriguez-Blanco, G. Collection and Preparation of Clinical Samples for Metabolomics. Adv. Exp. Med. Biol. 2017, 965, 19–44.
  31. Kennedy, A.D.; Wittmann, B.M.; Evans, A.M.; Miller, L.A.D.; Toal, D.R.; Lonergan, S.; Elsea, S.H.; Pappan, K.L. Metabolomics in the clinic: A review of the shared and unique features of untargeted metabolomics for clinical research and clinical testing. J. Mass Spectrom. 2018, 53, 1143–1154.
  32. Yao, L.; Sheflin, A.M.; Broeckling, C.D.; Prenni, J.E. Data Processing for GC-MS- and LC-MS-Based Untargeted Metabolomics. Methods Mol. Biol. 2019, 1978, 287–299.
  33. Jarmusch, A.K.; Wang, M.; Aceves, C.M.; Advani, R.S.; Aguirre, S.; Aksenov, A.A.; Aleti, G.; Aron, A.T.; Bauermeister, A.; Bolleddu, S.; et al. ReDU: A framework to find and reanalyze public mass spectrometry data. Nat. Methods 2020, 17, 901–904.
  34. Spicer, R.A.; Salek, R.; Steinbeck, C. A decade after the metabolomics standards initiative it’s time for a revision. Sci. Data 2017, 4, 170138.
  35. Lu, W.; Su, X.; Klein, M.S.; Lewis, I.A.; Fiehn, O.; Rabinowitz, J.D. Metabolite Measurement: Pitfalls to Avoid and Practices to Follow. Annu. Rev. Biochem. 2017, 86, 277–304.
  36. Trifonova, O.P.; Maslov, D.L.; Balashova, E.E.; Lokhov, P.G. Mass spectrometry-based metabolomics diagnostics—Myth or reality? Expert Rev. Proteom. 2021, 18, 7–12.
  37. Metabolon—Enlightening Life. Available online: https://www.metabolon.com/ (accessed on 23 November 2021).
  38. Dunn, W.B.; Lin, W.; Broadhurst, D.; Begley, P.; Brown, M.; Zelena, E.; Vaughan, A.A.; Halsall, A.; Harding, N.; Knowles, J.D.; et al. Molecular phenotyping of a UK population: Defining the human serum metabolome. Metabolomics 2015, 11, 9–26.
  39. Alseekh, S.; Aharoni, A.; Brotman, Y.; Contrepois, K.; D’Auria, J.; Ewald, J.; Ewald, J.C.; Fraser, P.D.; Giavalisco, P.; Hall, R.D.; et al. Mass spectrometry-based metabolomics: A guide for annotation, quantification and best reporting practices. Nat. Methods 2021, 18, 747–756.
  40. Jendoubi, T. Approaches to Integrating Metabolomics and Multi-Omics Data: A Primer. Metabolites 2021, 11, 184.
More
This entry is offline, you can click here to edit this entry!
ScholarVision Creations