Biologics can be re-engineered for blood-brain barrier (BBB) transport as IgG fusion proteins, where the IgG domain is a monoclonal antibody (MAb) that targets an endogenous BBB transporter, such as the insulin receptor (IR) or transferrin receptor (TfR). The IR and TfR at the BBB transport the receptor-specific MAb in parallel with the transport of the endogenous ligand, insulin or transferrin.
- blood–brain barrier
- brain drug delivery
- monoclonal antibody
- transferrin receptor
- insulin receptor
1. Structure of the Human Transferrin Receptor-Holo Transferrin Complex
Transferrin (Tf) is a 679 amino acid bilobular protein comprised of an N-lobe (amino acids 1–331) and a C-lobe (amino acids 339–679), joined by a short linker (amino acids 332–338), and both lobes bind 1 ferrous (Fe+3) atom [1]. There are two transferrin receptors, TfR1 and TfR2, which are products of separate genes [2]. The TfR expressed at the BBB was identified with a BBB genomics investigation as TfR1 [3]. The crystal structure at a resolution of 3.2 angstroms was reported for the complex of the human TfR1 extracellular domain (ECD) and holo-Tf [1]. The human TfR1 ECD was expressed in baby hamster kidney (BHK) fibroblasts, and the human Tf was also expressed in BHK cells [1]. The Tf was mutated (Y426F, Y517F) to eliminate iron binding to the C-lobe, and the Tf was also mutated (N413D, N611D) to eliminate Tf N-linked glycosylation [1]. The hetero-tetrameric Tf-TfR complex is formed by two receptors and two holo-Tf molecules [1]. The TfR1 is a 760 amino acid protein comprised of multiple domains, including the intracellular amino terminal domain (amino acids 1–67), the transmembrane domain (amino acids 68–88), a stalk domain, which forms disulfide bonds between two receptors (amino acids 89–120), two protease-like domains (amino acids 121–188 and 384–606), an apical domain (amino acids 189–383), and a helical domain (amino acids 607–760) [1]. Amino acids 121–760 form the monomeric ECD of the TfR1. Transferrin in plasma exists in three forms: about 40% is apo-Tf, which does not bind to the TfR1 at physiologic pH; about 30% is diferric holo-Tf; and about 30% is mono-ferric Tf [1]. The affinity of diferric Tf for the TfR1 is ~6-fold greater than the affinity of monoferric Tf [4]. The concentration of Tf in human plasma is 45,000 nM [5], and the concentration of holo-Tf is about 25,000 nM. The plasma concentration of holo-Tf is nearly 1000-fold greater than the TfR1 concentration at the brain capillary endothelium in vivo, which is 40 nM [6]. The optimal TfRMAb binding site on the TfR is the apical domain, as holo-Tf binds to the protease-like and helical domains of the TfR1 as shown in Figure 1A.
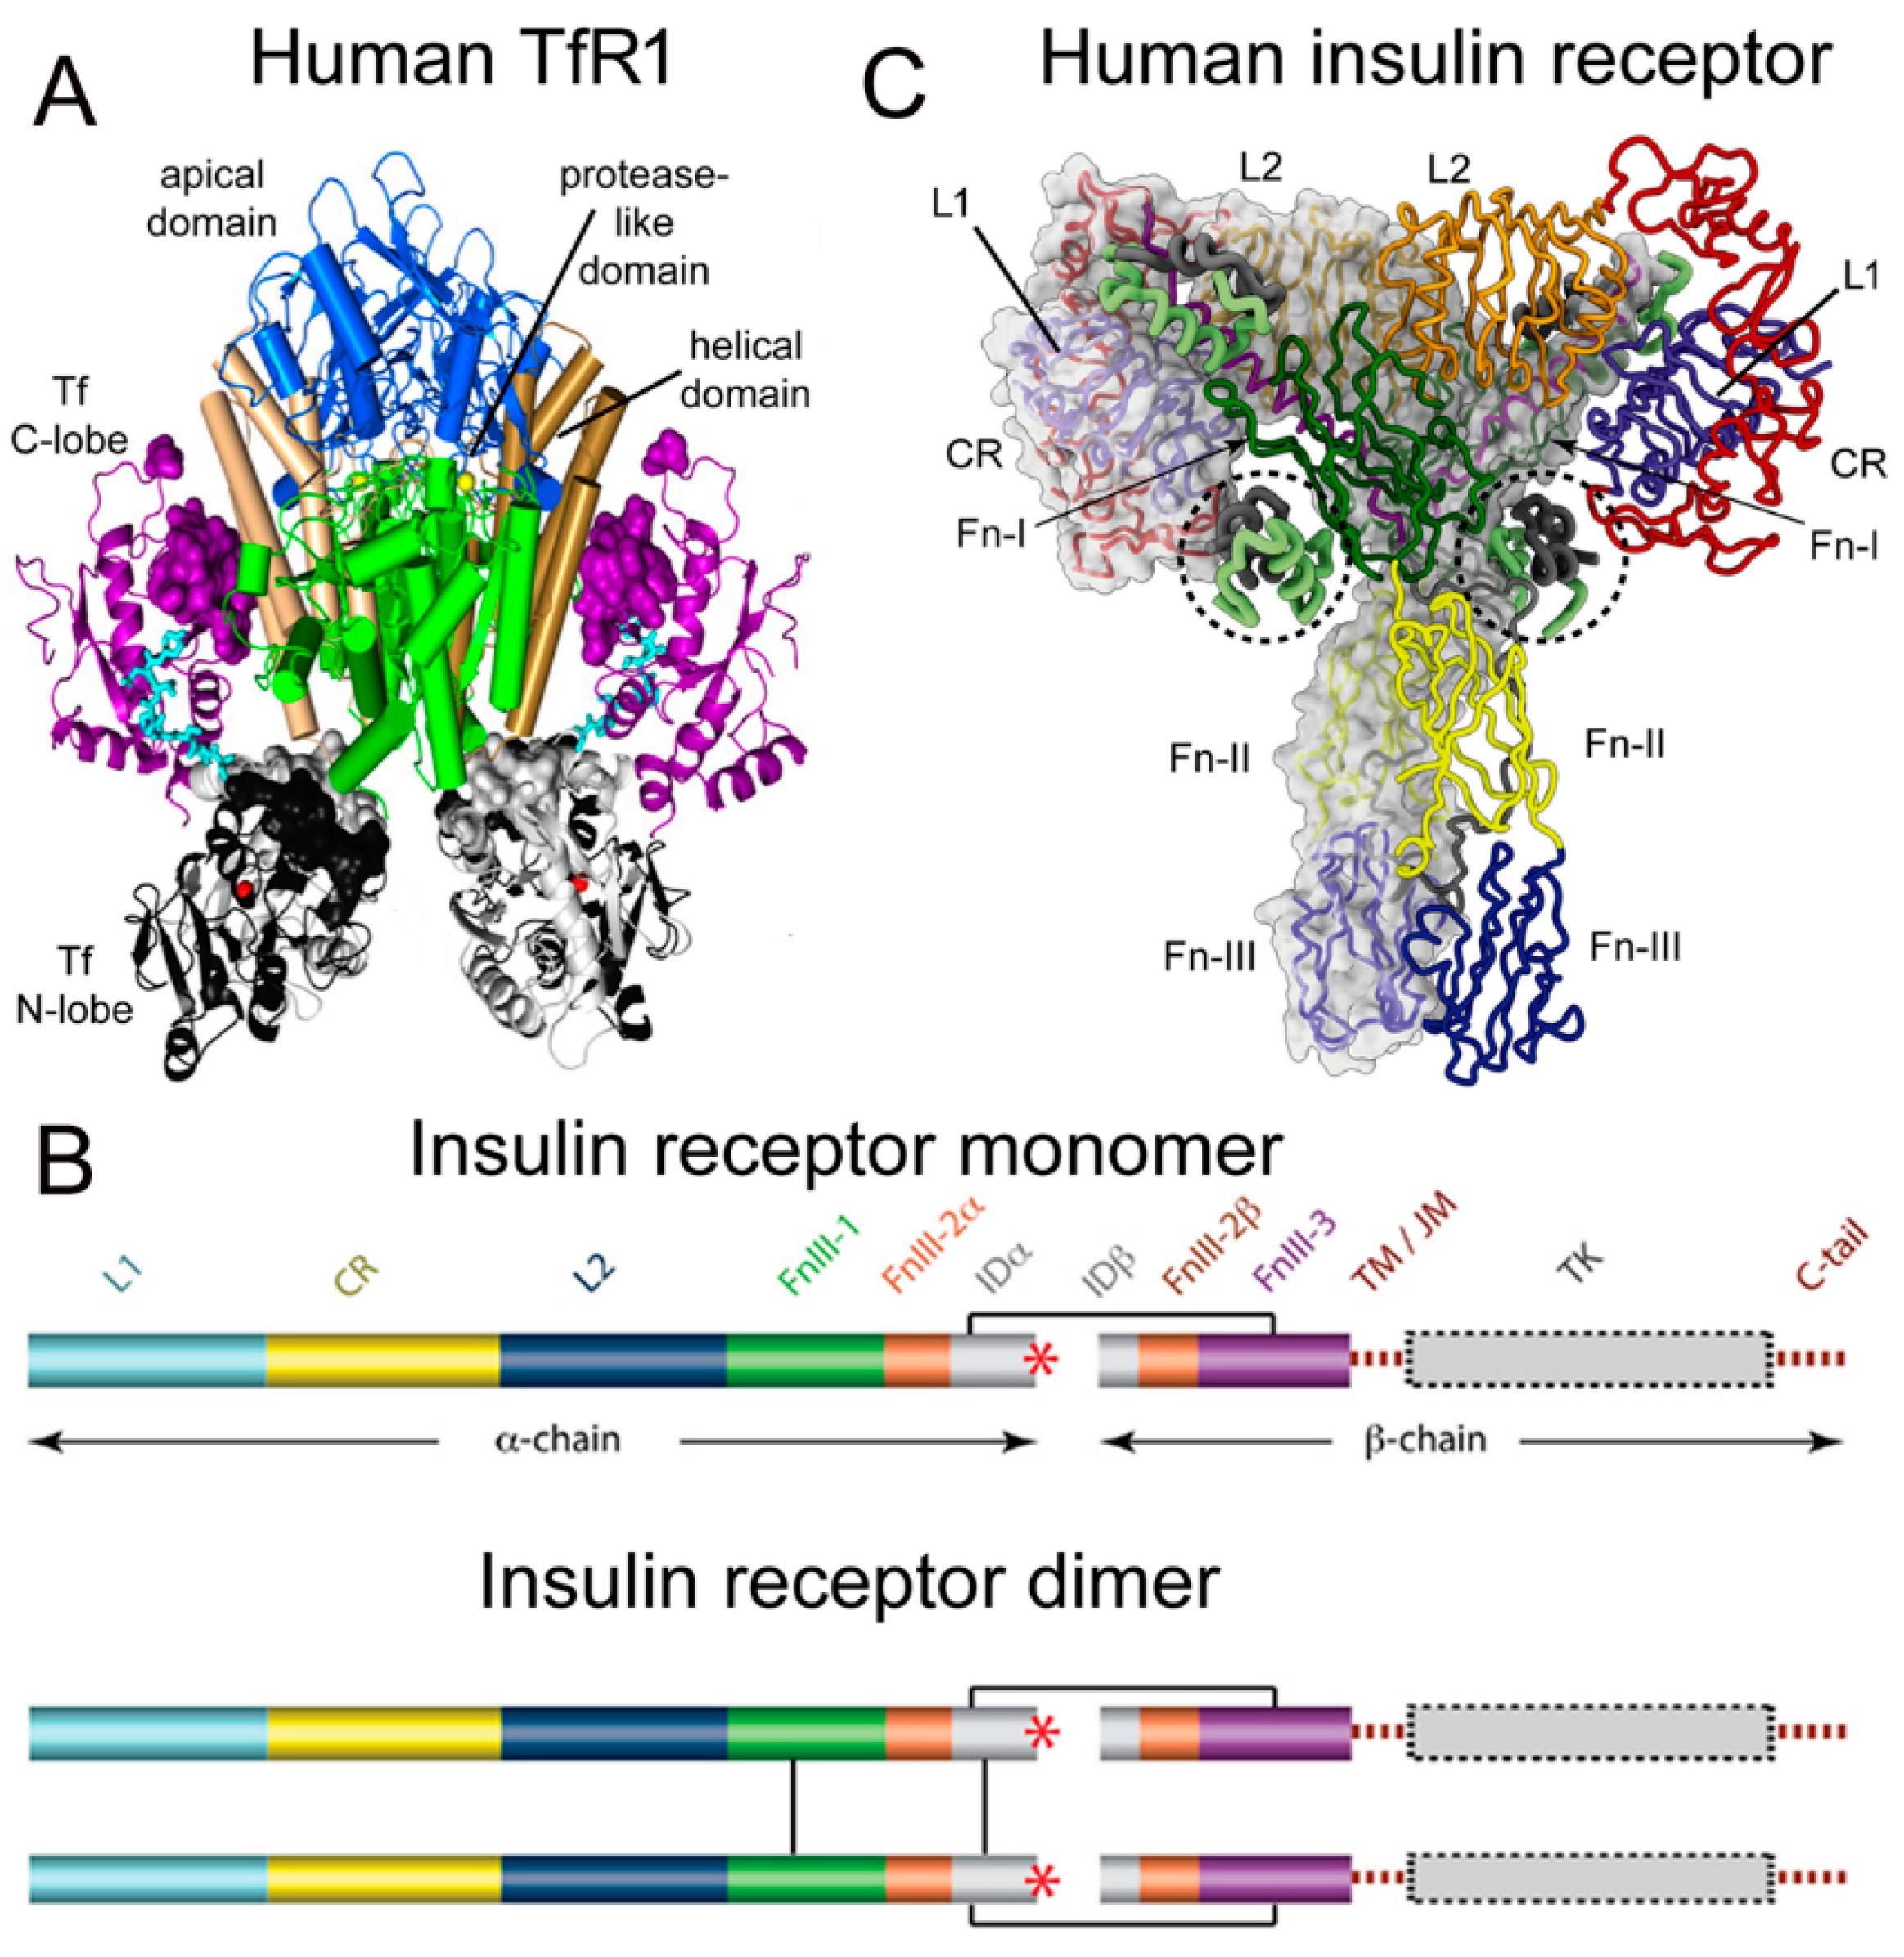 Figure 1. (A) Three-dimensional structure of the complex of the human TfR ECD and holo-Tf. The tetrameric complex is comprised of 2 TfRs and 2 holo-Tf molecules. The cell surface is at the bottom of the structure and the apical domain (blue) is at the top; the 2 protease-like domains are shown in green and the helical domain is shown in brown/tan. The N-lobe and C-lobe of Tf are shown in gray/black and purple, respectively. The Fe+3 bound within the N-lobe is shown in red; the linker between the N and C lobes of Tf is cyan. Reproduced with permission from [1]. (B) Two-dimensional structure of the human IR as a monomer (top) and a dimer (bottom). A single disulfide bond joins the alpha and beta chains of each monomer, and the dimer is formed by 2 disulfide bonds between each alpha chain. Reproduced from [7], Copyright© 2011 licensed under Creative Commons Attribution License (CC-BY). (C) Three-dimensional structure of the complex of the human IR and insulin. The structure is comprised of the IR dimer and 4 bound insulin molecules. Insulin bound to the second site formed by the FnIII-1/FnIII-2 domains is encircled. Reproduced with permission from [8], Copyright© 2021 Elsevier, as reported in [9]. The IR domains in panels B and C are defined in the text.
2. Structure of the Human Insulin Receptor-Insulin Complex
There are two human insulin receptors, designated IR-A (short form) and IR-B (long form), which are derived from a single gene by alternate processing of the primary transcript. In IR-A, which is primarily expressed in cancer and fetal tissues [10], exon 11 is deleted, resulting in a 12 amino acid truncation at the carboxyl terminus of the alpha chain, which corresponds to the α-CT domain of IR-B. IR-B is the isoform predominantly expressed in tissues [10]. Following removal of a 27 amino acid signal peptide, IR-B is encoded as a 1355 amino acid polypeptide, which is proteolytically cleaved to the alpha chain, amino acids 1–731 (not counting the signal peptide), and the beta chain, amino acids 736–1355 [11]. This separation into alpha and beta chains occurs at a furin cleavage site, RKRR [12], which corresponds to amino acids 732–735, and this sequence is removed in the cleavage. The cleavage into the separate alpha and beta chains is shown in Figure 1B (top). The alpha chain is formed by the first leucine-rich (L1) domain, the cysteine-rich (CR) domain, the second leucine-rich (L2) domain, the first fibronection III domain (FnIII-1), the first part of the second fibronection III domain (FnIII-2α), and the first part of the insert domain (IDα); the final 12 amino acids of the alpha chain is the αCT domain, which is involved in insulin binding [11]. The beta chain is formed by the second part of the insert domain (IDβ), the second part of the FnIII-2 domain (FnIII-2β), the third fibronectin domain (FnIII-3), the transmembrane (TM) domain, the juxtamembrane (JM) domain, the tyrosine kinase (TK) domain, and the carboxyl terminus (Figure 1B, top). An inter-chain disulfide bond joins the alpha and beta chains, and two additional disulfides between the two alpha chains form the hetero-tetrameric structure of the IR (Figure 1B, bottom). The ECD of the IR, which is approximately 900 amino acids in length, is formed by cleavage near the TM domain and includes all of the alpha chain and the amino terminal portion of the beta chain. The crystal structure of the ECD of the human IR complexed with monoclonal antibodies was originally produced [13]. Recently, the three-dimensional structure of the complex of insulin and the IR tetrameric structure was generated with cryo electron microscopy [9][14], as recently reviewed [8], and this structure is shown in Figure 1C. The structure of the insulin/IR complex reveals each IR monomer binds two insulin molecules, so that the IR dimer shown in Figure 1C binds four insulin molecules; two insulins are bound to the classical high-affinity binding site formed by interaction of the L1 and αCT domains of each alpha subunit and two insulins are bound to a low-affinity second site formed by interactions of the FnIII-1 and FnIII-2 domains of each alpha subunit (Figure 1C). Insulin is synthesized as a proinsulin precursor in pancreatic beta cells, and proinsulin is cleaved to 2 insulin subunits, the 21 amino acid A-chain and the 30 amino acid B-chain, which are joined together by 2 disulfide bonds [8]. The fasting plasma insulin concentration is about 0.3 nM in humans and primates [15][16]. The plasma concentration of insulin is ~100-fold lower than the IR concentration at the brain capillary endothelium in vivo, which is 24 nM [6].
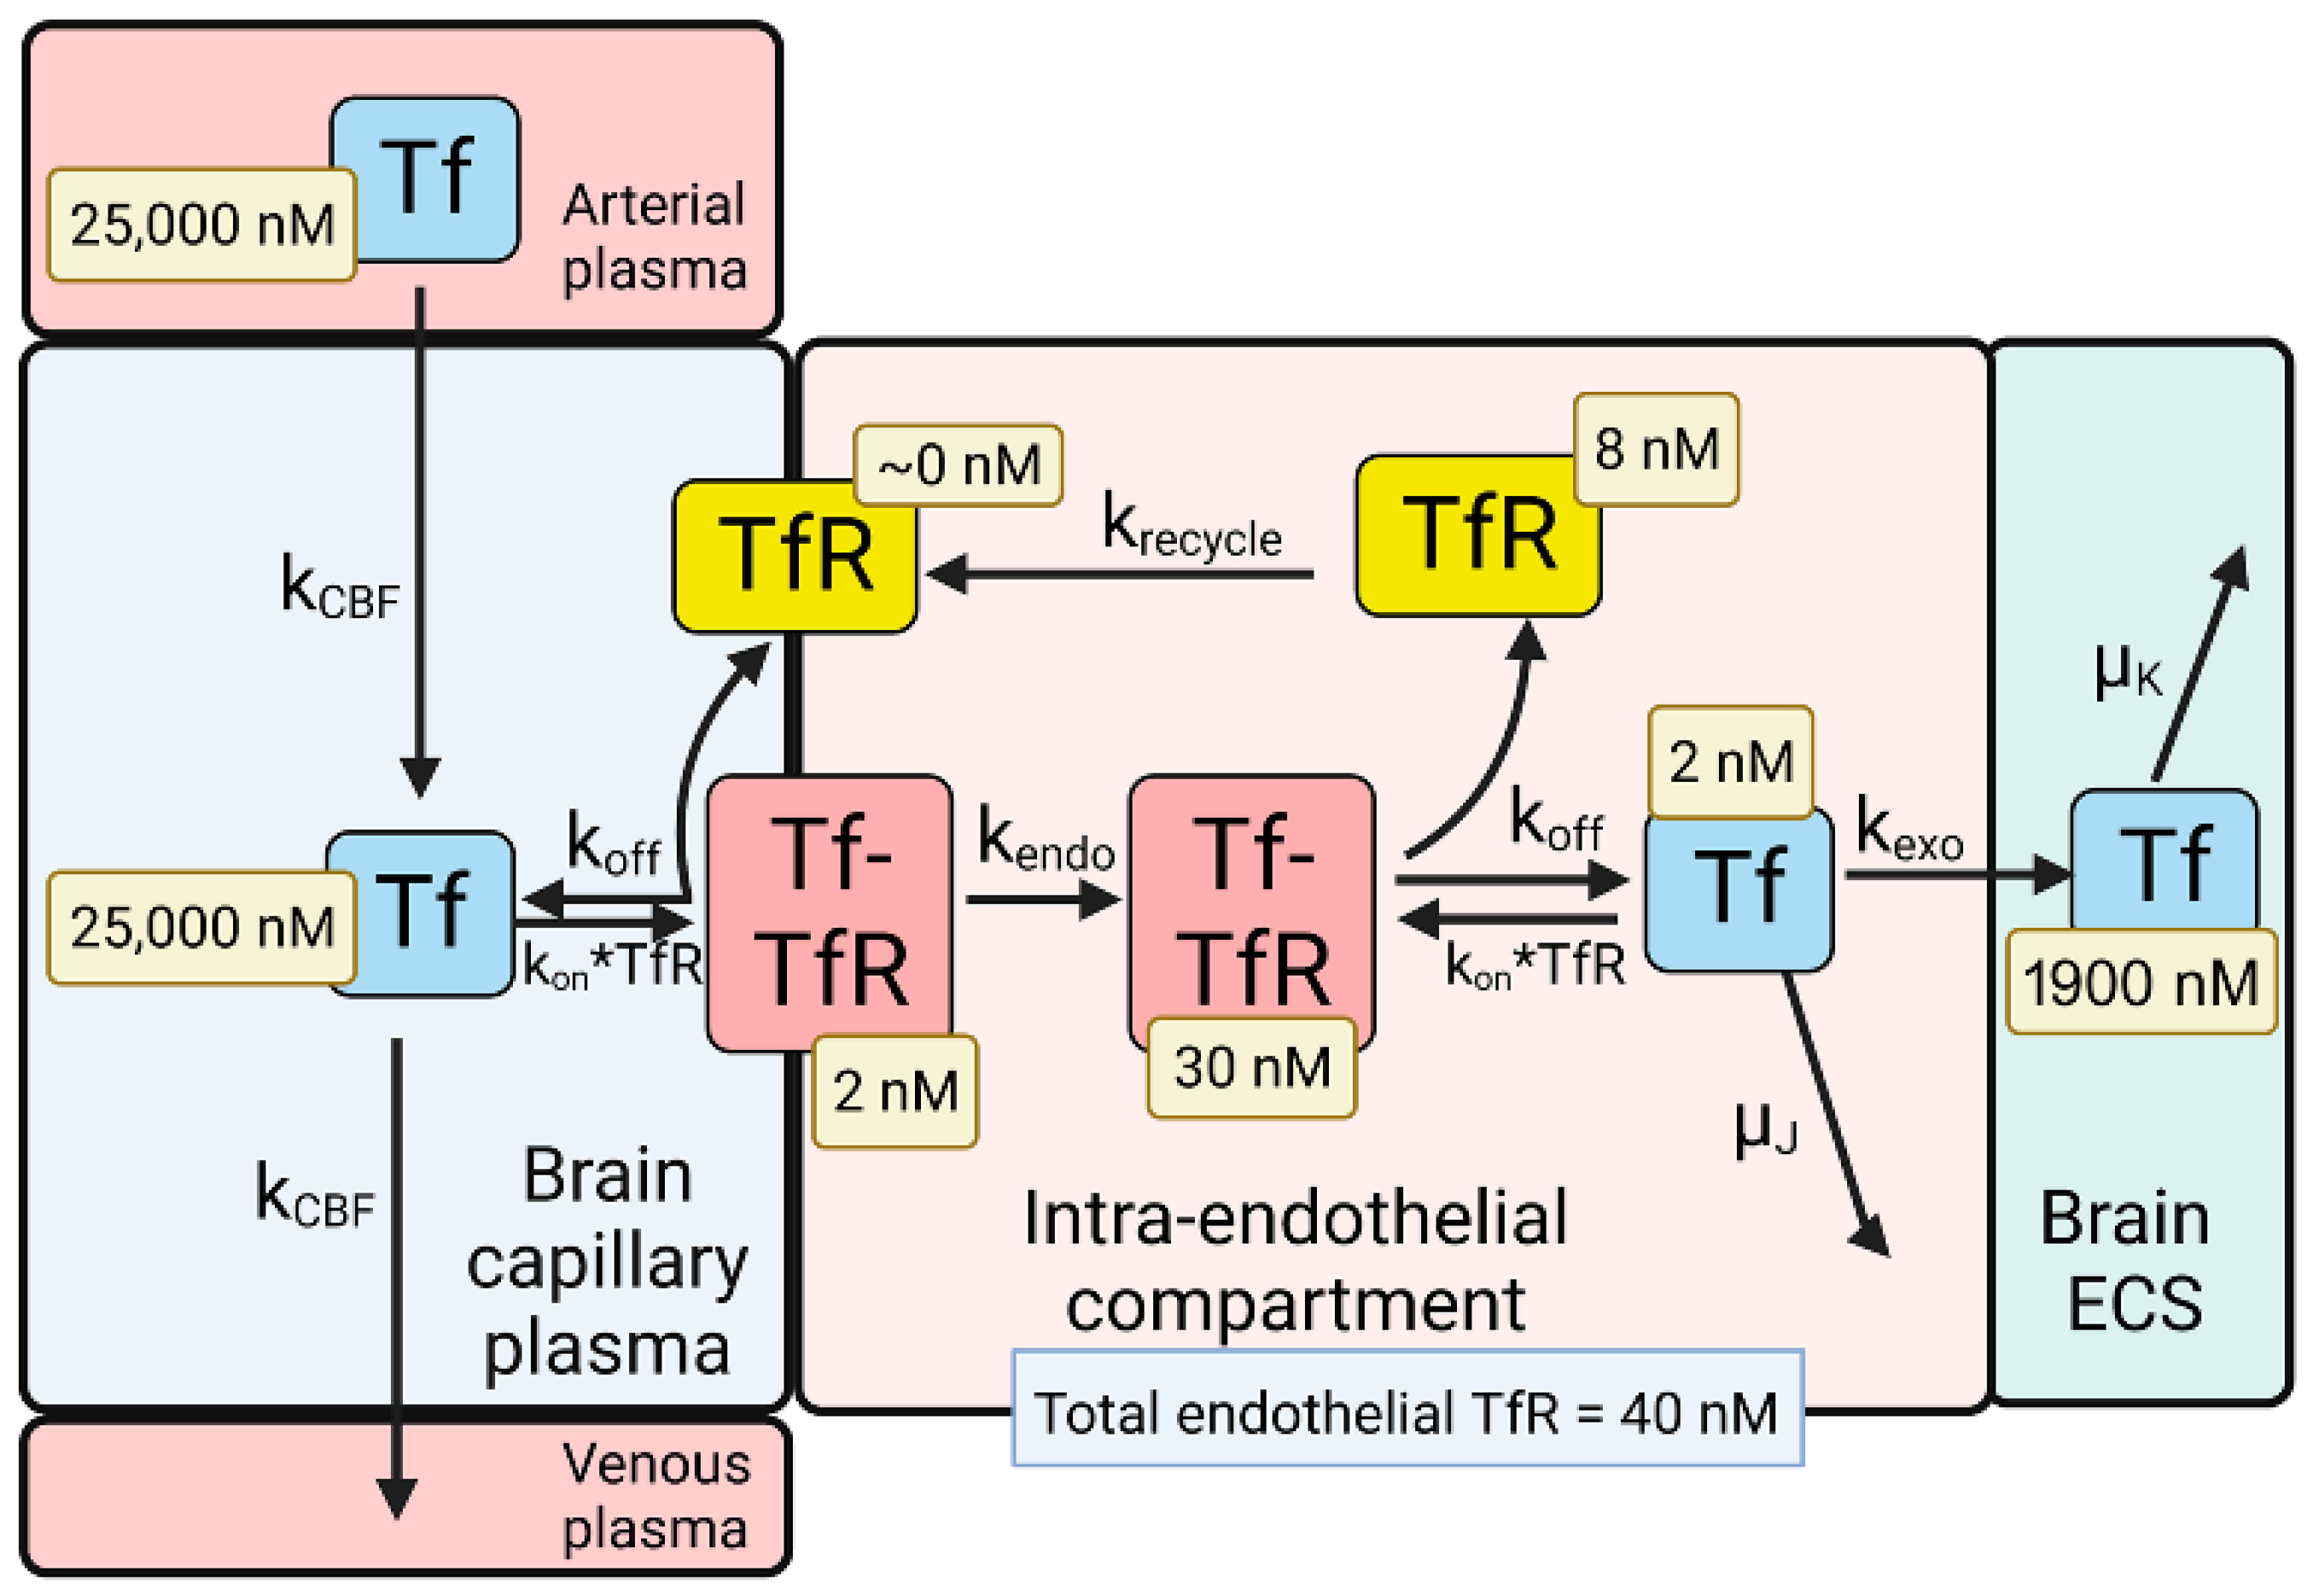
3. BBB Transport of Holo-Transferrin
The model solutions by numerical analysis of a partly flow-partly compartmental model of BBB holo-Tf transport have been described previously [6], and the holo-Tf model is shown in Figure 2.
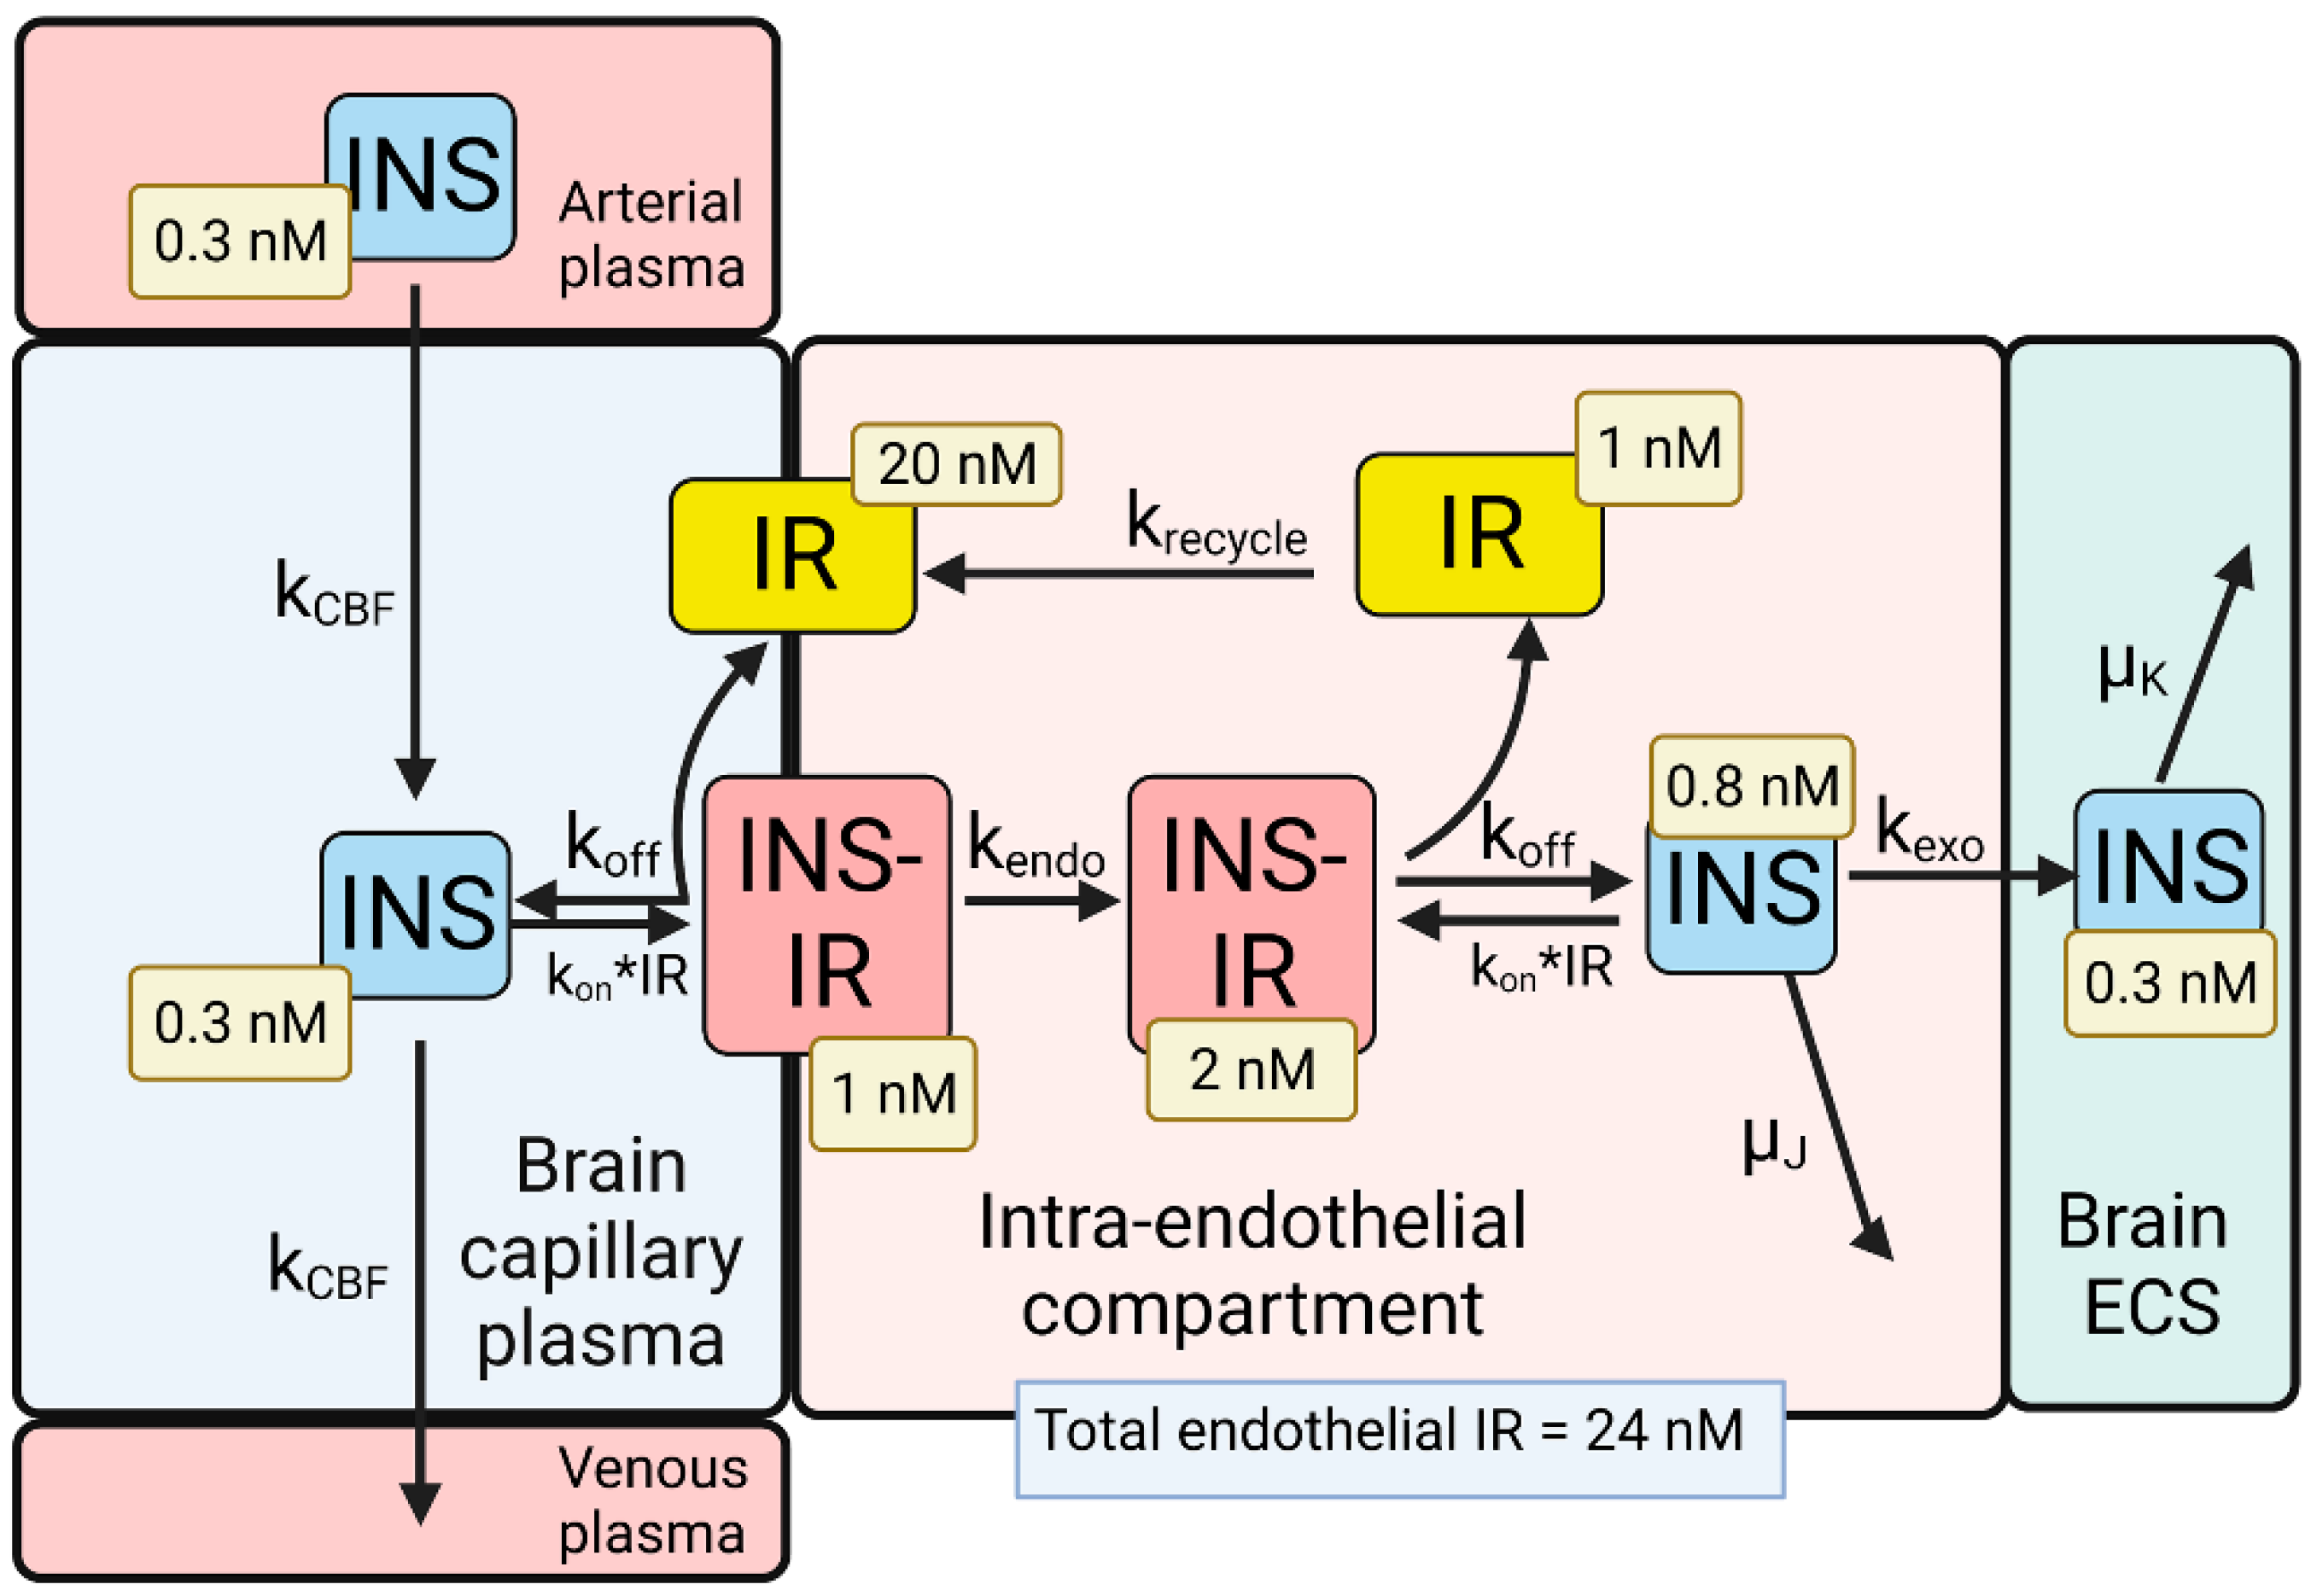
4. BBB Transport of Insulin
This entry is adapted from the peer-reviewed paper 10.3390/ph15010003
References
- Eckenroth, B.E.; Steere, A.N.; Chasteen, N.D.; Everse, S.J.; Mason, A.B. How the binding of human transferrin primes the transferrin receptor potentiating iron release at endosomal pH. Proc. Natl. Acad. Sci. USA 2011, 108, 13089–13094.
- Herbison, C.E.; Thorstensen, K.; Chua, A.C.; Graham, R.M.; Leedman, P.; Olynyk, J.K.; Trinder, D. The role of transferrin receptor 1 and 2 in transferrin-bound iron uptake in human hepatoma cells. Am. J. Physiol. Cell. Physiol. 2009, 297, C1567–C1575.
- Pardridge, W.M. The Isolated Brain Microvessel: A Versatile Experimental Model of the Blood-Brain Barrier. Front. Physiol. 2020, 11, 398.
- Mason, A.B.; Byrne, S.L.; Everse, S.J.; Roberts, S.E.; Chasteen, N.D.; Smith, V.C.; MacGillivray, R.T.; Kandemir, B.; Bou-Abdallah, F. A loop in the N-lobe of human serum transferrin is critical for binding to the transferrin receptor as revealed by mutagenesis, isothermal titration calorimetry, and epitope mapping. J. Mol. Recognit. 2009, 22, 521–529.
- Schmaier, A.H. Transferrin: A blood coagulation modifier. Cell. Res. 2020, 30, 101–102.
- Pardridge, W.M.; Chou, T. Mathematical Models of Blood-Brain Barrier Transport of Monoclonal Antibodies Targeting the Transferrin Receptor and the Insulin Receptor. Pharmaceuticals 2021, 14, 535.
- Ward, C.W.; Lawrence, M.C. Landmarks in insulin research. Front. Endocrinol. (Lausanne) 2011, 2, 76.
- Lawrence, M.C. Understanding insulin and its receptor from their three-dimensional structures. Mol. Metab. 2021, 52, 101255.
- Gutmann, T.; Schafer, I.B.; Poojari, C.; Brankatschk, B.; Vattulainen, I.; Strauss, M.; Coskun, U. Cryo-EM structure of the complete and ligand-saturated insulin receptor ectodomain. J. Cell. Biol. 2020, 219, e201907210.
- Giudice, J.; Barcos, L.S.; Guaimas, F.F.; Penas-Steinhardt, A.; Giordano, L.; Jares-Erijman, E.A.; Coluccio Leskow, F. Insulin and insulin like growth factor II endocytosis and signaling via insulin receptor B. Cell. Commun. Signal. 2013, 11, 18.
- Menting, J.G.; Whittaker, J.; Margetts, M.B.; Whittaker, L.J.; Kong, G.K.; Smith, B.J.; Watson, C.J.; Zakova, L.; Kletvikova, E.; Jiracek, J.; et al. How insulin engages its primary binding site on the insulin receptor. Nature 2013, 493, 241–245.
- Bravo, D.A.; Gleason, J.B.; Sanchez, R.I.; Roth, R.A.; Fuller, R.S. Accurate and efficient cleavage of the human insulin proreceptor by the human proprotein-processing protease furin. Characterization and kinetic parameters using the purified, secreted soluble protease expressed by a recombinant baculovirus. J. Biol. Chem. 1994, 269, 25830–25837.
- McKern, N.M.; Lawrence, M.C.; Streltsov, V.A.; Lou, M.Z.; Adams, T.E.; Lovrecz, G.O.; Elleman, T.C.; Richards, K.M.; Bentley, J.D.; Pilling, P.A.; et al. Structure of the insulin receptor ectodomain reveals a folded-over conformation. Nature 2006, 443, 218–221.
- Uchikawa, E.; Choi, E.; Shang, G.; Yu, H.; Bai, X.C. Activation mechanism of the insulin receptor revealed by cryo-EM structure of the fully liganded receptor-ligand complex. Elife 2019, 8, e48630.
- Bar, R.S.; Gorden, P.; Roth, J.; Kahn, C.R.; De Meyts, P. Fluctuations in the affinity and concentration of insulin receptors on circulating monocytes of obese patients: Effects of starvation, refeeding, and dieting. J. Clin. Investig. 1976, 58, 1123–1135.
- Bremer, A.A.; Stanhope, K.L.; Graham, J.L.; Cummings, B.P.; Wang, W.; Saville, B.R.; Havel, P.J. Fructose-fed rhesus monkeys: A nonhuman primate model of insulin resistance, metabolic syndrome, and type 2 diabetes. Clin. Transl. Sci. 2011, 4, 243–252.
- Giannetti, A.M.; Bjorkman, P.J. HFE and transferrin directly compete for transferrin receptor in solution and at the cell surface. J. Biol. Chem. 2004, 279, 25866–25875.
- Dodd, P.R.; Eckert, A.L.; Fletcher, L.M.; Kril, J.J.; Harper, C.G.; Halliday, J.W. Concentrations of transferrin and carbohydrate-deficient transferrin in postmortem human brain from alcoholics. Addict. Biol. 1997, 2, 337–348.
- Sigurdsson, S.; Aspelund, T.; Forsberg, L.; Fredriksson, J.; Kjartansson, O.; Oskarsdottir, B.; Jonsson, P.V.; Eiriksdottir, G.; Harris, T.B.; Zijdenbos, A.; et al. Brain tissue volumes in the general population of the elderly: The AGES-Reykjavik study. Neuroimage 2012, 59, 3862–3870.
- Strahan, M.E.; Crowe, A.; Morgan, E.H. Iron uptake in relation to transferrin degradation in brain and other tissues of rats. Am. J. Physiol. 1992, 263, R924–R929.
- Scapin, G.; Dandey, V.P.; Zhang, Z.; Prosise, W.; Hruza, A.; Kelly, T.; Mayhood, T.; Strickland, C.; Potter, C.S.; Carragher, B. Structure of the insulin receptor-insulin complex by single-particle cryo-EM analysis. Nature 2018, 556, 122–125.
- Mandikian, D.; Figueroa, I.; Oldendorp, A.; Rafidi, H.; Ulufatu, S.; Schweiger, M.G.; Couch, J.A.; Dybdal, N.; Joseph, S.B.; Prabhu, S.; et al. Tissue Physiology of Cynomolgus Monkeys: Cross-Species Comparison and Implications for Translational Pharmacology. AAPS J. 2018, 20, 107.
- Joris, P.J.; Mensink, R.P.; Adam, T.C.; Liu, T.T. Cerebral Blood Flow Measurements in Adults: A Review on the Effects of Dietary Factors and Exercise. Nutrients 2018, 10, 530.
- Frank, H.J.; Jankovic-Vokes, T.; Pardridge, W.M.; Morris, W.L. Enhanced insulin binding to blood-brain barrier in vivo and to brain microvessels in vitro in newborn rabbits. Diabetes 1985, 34, 728–733.
- Sykova, E.; Nicholson, C. Diffusion in brain extracellular space. Physiol. Rev. 2008, 88, 1277–1340.
- Knopp, J.L.; Holder-Pearson, L.; Chase, J.G. Insulin Units and Conversion Factors: A Story of Truth, Boots, and Faster Half-Truths. J. Diabetes Sci. Technol. 2019, 13, 597–600.
- Duckworth, W.C.; Bennett, R.G.; Hamel, F.G. Insulin degradation: Progress and potential. Endocr. Rev. 1998, 19, 608–624.